

Key Insights
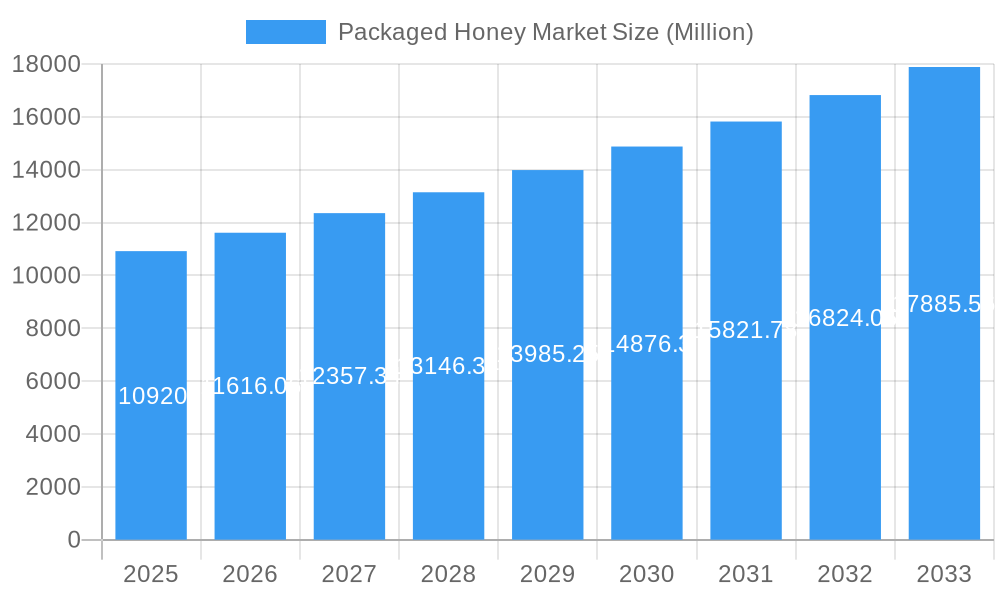
The global packaged honey market is experiencing robust growth, projected to reach a significant valuation of $10.92 billion. This expansion is fueled by an increasing consumer preference for natural and healthy food options, coupled with a growing awareness of honey's nutritional benefits. The market's Compound Annual Growth Rate (CAGR) of 6.43% signifies a dynamic and expanding landscape. Key drivers include the rising demand for premium and varietal honey products, driven by evolving culinary trends and a discerning consumer base seeking unique flavors and origins. Furthermore, the convenience and extended shelf-life offered by packaged honey, as opposed to raw, unpackaged alternatives, significantly contribute to its market penetration. The health and wellness trend, emphasizing natural sweeteners and their purported immune-boosting and antioxidant properties, continues to bolster demand across various demographics.
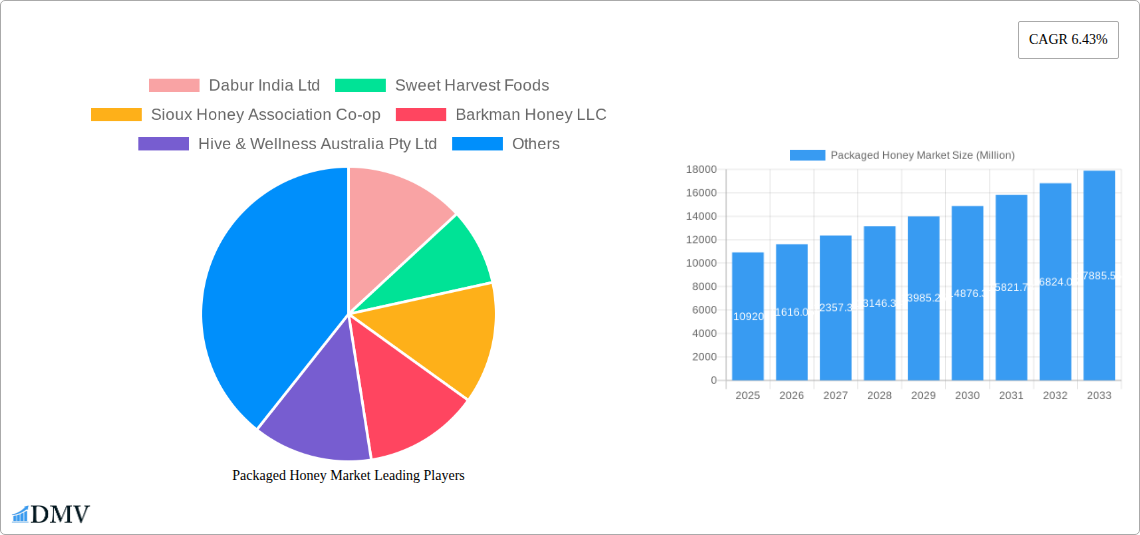
Packaged Honey Market Market Size (In Billion)
The market segmentation highlights the diverse offerings within the packaged honey sector. The distinction between conventional and organic honey reflects a growing segment of health-conscious consumers willing to pay a premium for organic certification. Packaging innovations also play a crucial role, with pet bottles and glass jars being prominent, catering to different consumer needs for portability and premium presentation. While the market presents substantial opportunities, it also faces restraints such as fluctuating raw material prices due to seasonal variations and potential impacts of climate change on bee populations, which could affect honey production. Additionally, stringent regulatory compliance regarding food safety and labeling standards across different regions adds a layer of complexity for manufacturers. Leading companies like Dabur India Ltd, Sweet Harvest Foods, and The J.M. Smucker Company are actively investing in product innovation, strategic acquisitions, and expanding their distribution networks to capitalize on these market dynamics and maintain a competitive edge.
Packaged Honey Market Company Market Share
This in-depth report offers a panoramic view of the global packaged honey market, dissecting its current composition, intricate trends, and robust future potential. Spanning from 2019 to 2033, with a base year of 2025 and an extensive forecast period from 2025 to 2033, this analysis delves into every facet of this dynamic industry. We meticulously examine market share distribution, innovation catalysts, regulatory landscapes, substitute products, and end-user profiles, providing stakeholders with critical insights into market concentration and M&A activities valued in the millions. The report addresses the evolving packaged honey market size, packaged honey market growth rate, and the surging demand for premium honey, natural sweeteners, and health-conscious food products.
Packaged Honey Market Market Composition & Trends
The packaged honey market exhibits a moderately concentrated landscape, characterized by a blend of established multinational corporations and agile regional players. Innovation acts as a significant catalyst, driven by evolving consumer preferences for organic honey, specialty honey varieties, and sustainable packaging solutions. The regulatory landscape plays a crucial role, with stringent quality control measures and labeling requirements impacting market entry and product development. Substitute products, such as artificial sweeteners and other natural syrups, present a constant competitive challenge. End-user profiles are diverse, ranging from health-conscious individuals seeking natural remedies to culinary enthusiasts exploring diverse flavor profiles. Mergers and acquisitions (M&A) are strategic moves to gain market share and expand product portfolios. For instance, recent M&A activities in the broader food ingredients sector have involved deals valued in the tens of millions, signaling consolidation and strategic expansion within the sweeteners market. The global packaged honey market share is influenced by these strategic maneuvers, with dominant players continuously vying for a larger slice of this expanding pie.
- Market Concentration: Moderate to high in developed regions, with a mix of global brands and private labels.
- Innovation Catalysts: Demand for unique varietals (e.g., Manuka, Buckwheat), functional honey, and eco-friendly packaging.
- Regulatory Landscapes: Food safety standards (FDA, EFSA), origin labeling, and organic certifications are paramount.
- Substitute Products: Artificial sweeteners, agave nectar, maple syrup, and other natural syrups.
- End-User Profiles: Health-conscious consumers, families, food manufacturers, and the foodservice industry.
- M&A Activities: Strategic acquisitions to enhance product offerings, geographic reach, and R&D capabilities. Notable M&A deals in the broader food sector have reached hundreds of millions, indicating significant investment potential in related markets.
Packaged Honey Market Industry Evolution
The packaged honey industry has undergone a significant transformation over the historical period of 2019–2024, driven by a confluence of factors including shifting consumer preferences, advancements in processing and packaging technologies, and a growing global awareness of health and wellness. The market growth trajectory has been consistently upward, fueled by the perception of honey as a natural, healthy alternative to refined sugars. Early in the study period, the market was largely dominated by conventional honey, but a discernible shift towards organic honey and specialty honey has gained momentum. Technological advancements in beekeeping practices, extraction methods, and sophisticated packaging solutions have not only improved product quality and shelf-life but also enhanced consumer convenience and appeal. For instance, advancements in high-speed filling and sealing machines for glass jars and pet bottles have significantly boosted production efficiency, allowing for greater market penetration.
Consumer demand has evolved from basic sweetness provision to a desire for authentic, traceable, and sustainably sourced products. This evolution is evident in the rising popularity of single-origin honeys, those with specific floral sources, and honey purported to have medicinal or functional benefits. The adoption metrics for organic certification have seen a substantial increase, with consumers willing to pay a premium for assurance of purity and environmental responsibility. Furthermore, the surge in online retail and direct-to-consumer (DTC) models has democratized access to a wider array of honey products, breaking down geographical barriers. The packaged honey market size in 2025 is estimated to be in the billions, with a projected Compound Annual Growth Rate (CAGR) of over XX% during the forecast period. This growth is underpinned by increasing disposable incomes in emerging economies and a sustained focus on healthy eating habits worldwide. The development of innovative packaging, such as squeezable bottles and single-serve sachets, has also contributed to convenience and expanded usage occasions, further propelling the industry's evolution.
Leading Regions, Countries, or Segments in Packaged Honey Market
The global packaged honey market is characterized by regional dominance and segment leadership driven by distinct consumption patterns and production capabilities. North America and Europe currently hold significant market shares, attributed to a well-established demand for natural sweeteners and a strong presence of premium honey brands. The conventional honey segment continues to be the largest contributor to the overall market value, owing to its affordability and widespread availability. However, the organic honey segment is experiencing robust growth, driven by increasing consumer consciousness regarding health, sustainability, and product purity. This surge is particularly evident in developed nations where consumers are willing to invest more in organic and ethically sourced products.
In terms of packaging, glass jars remain a preferred choice for premium honey products, offering an aesthetically pleasing and perceived healthier option, especially for organic and specialty varietals. Conversely, pet bottles are gaining traction due to their durability, lightweight nature, and cost-effectiveness, making them ideal for everyday consumption and larger pack sizes, particularly in mass-market distribution channels. The other packaging types, which include pouches, tubes, and single-serve sachets, are witnessing increasing adoption for convenience applications in the foodservice sector and for on-the-go consumption. Key drivers for segment dominance include:
- Investment Trends: Significant investments in beekeeping infrastructure, processing facilities, and branding initiatives in regions like the Americas and Western Europe.
- Regulatory Support: Favorable regulations and certification bodies that promote organic farming and fair trade practices encourage the growth of the organic honey segment.
- Consumer Awareness: Growing consumer awareness about the health benefits of honey and the demand for transparent sourcing fuels the growth of premium and organic varieties.
- Distribution Networks: Extensive retail penetration and the rise of e-commerce platforms ensure wide availability of packaged honey across diverse packaging formats.
In Asia-Pacific, the market is experiencing rapid expansion, driven by a rising middle class, increasing health consciousness, and the traditional use of honey in Ayurvedic medicine and culinary applications. Countries like India and China are significant contributors to this growth, with a strong preference for both conventional and increasingly, organic honey. The packaged honey market forecast indicates continued strong performance in these regions.
Packaged Honey Market Product Innovations
Product innovation within the packaged honey market is a key differentiator, moving beyond basic sweetness to offer enhanced functional benefits and unique sensory experiences. Companies are actively developing specialized honey varieties, such as antioxidant-rich honeys, probiotic-infused honeys, and honey blends with added ingredients like ginger or turmeric for enhanced health properties. Applications are expanding from traditional culinary uses to skincare, natural remedies, and innovative food product formulations. Performance metrics are often tied to the unique floral sources, such as the high MGO (methylglyoxal) content in Manuka honey, which dictates its premium pricing and perceived medicinal value. Technological advancements in honey processing and extraction are ensuring the preservation of natural enzymes and beneficial compounds, further enhancing the appeal of these innovative products.
Propelling Factors for Packaged Honey Market Growth
Several key factors are propelling the packaged honey market growth. The increasing consumer demand for natural and healthy food products is a primary driver, positioning honey as a preferred alternative to artificial sweeteners. The rising awareness of honey's purported health benefits, including its antibacterial and antioxidant properties, further fuels consumption. Technological advancements in beekeeping and extraction methods are improving product quality and efficiency, leading to increased supply and accessibility. Furthermore, the growing popularity of organic and specialty honey varieties, catering to niche consumer preferences for unique flavors and ethical sourcing, contributes significantly to market expansion. Supportive government initiatives promoting sustainable agriculture and beekeeping also play a crucial role in bolstering growth.
Obstacles in the Packaged Honey Market Market
Despite its growth, the packaged honey market faces several obstacles. Regulatory challenges, including varying food safety standards across different countries and complex certification processes for organic claims, can hinder market entry and expansion. Supply chain disruptions, such as climate change impacting bee populations and adverse weather conditions affecting honey production, pose a significant risk to consistent supply and price stability. Intense competitive pressures from other natural sweeteners like maple syrup and agave nectar, as well as from honey adulteration, which erodes consumer trust, present ongoing challenges. The fluctuating raw material costs associated with beekeeping and processing also impact profit margins. Quantifiable impacts include potential price increases of up to 15% due to supply shortages and a decrease in consumer confidence by up to 20% due to adulteration incidents.
Future Opportunities in Packaged Honey Market
The packaged honey market is ripe with future opportunities. The burgeoning demand for functional foods presents a significant avenue for innovation, with opportunities in developing honey formulations with added health benefits, such as prebiotics or vitamins. The expansion of e-commerce and direct-to-consumer (DTC) channels offers direct access to a global customer base, enabling brands to bypass traditional retail limitations and build stronger customer relationships. Emerging markets in Asia, Africa, and Latin America, with their growing middle class and increasing health consciousness, represent untapped potential for market penetration. Furthermore, the development of sustainable and eco-friendly packaging solutions, aligning with global environmental concerns, can further enhance brand appeal and capture a larger market share.
Major Players in the Packaged Honey Market Ecosystem
- Dabur India Ltd
- Sweet Harvest Foods
- Sioux Honey Association Co-op
- Barkman Honey LLC
- Hive & Wellness Australia Pty Ltd
- Patanjali Ayurved Limited
- Bright Food Group co Ltd
- McCormick & Company Inc
- The J M Smucker Company
- Apis Group
Key Developments in Packaged Honey Market Industry
- January 2024: Dabur, a prominent player in the Ayurvedic and personal care sector, invested approximately INR 135 crore in expanding its manufacturing facility in South India. This strategic expansion aims to bolster the production capacity of its key products, including Dabur Honey, underscoring its commitment to meeting growing demand.
- January 2024: APIS Honey launched Apis Organic Honey, sourced from the pristine region of Kashmir. This launch, featuring products in attractive glass bottles, signifies an expansion into the premium organic segment and targets various retail channels across India, reflecting a growing trend towards organic offerings.
- December 2023: Better Foodie, in collaboration with California-based start-up MeliBio, introduced its award-winning 'Vegan H*ney' to approximately 200 UK retailers. This development highlights the increasing innovation in alternative sweetener categories and the exploration of plant-based options within the broader honey market.
Strategic Packaged Honey Market Market Forecast
The strategic packaged honey market forecast indicates a sustained period of robust growth, driven by an expanding global consumer base prioritizing natural and healthy dietary choices. Key growth catalysts include the escalating demand for organic and specialty honey varieties, directly influenced by heightened health consciousness and a desire for transparent sourcing. The ongoing innovation in product development, particularly in functional honey and unique flavor profiles, will continue to attract premium market segments. Furthermore, the increasing adoption of sustainable packaging solutions and the expansion of e-commerce platforms will facilitate wider market reach and accessibility, especially in emerging economies. The future of the packaged honey market is projected to be characterized by a strong emphasis on product differentiation, ethical sourcing, and meeting evolving consumer demands for premium, health-beneficial, and environmentally responsible food products, with a projected market valuation in the billions.
Packaged Honey Market Segmentation
-
1. Product Category
- 1.1. Conventional
- 1.2. Organic
-
2. Packaging Type
- 2.1. Pet Bottles
- 2.2. Glass Jars
- 2.3. Other Packaging Types
Packaged Honey Market Segmentation By Geography
-
1. North America
- 1.1. United States
- 1.2. Canada
- 1.3. Mexico
- 1.4. Rest of North America
-
2. Europe
- 2.1. Germany
- 2.2. France
- 2.3. Russia
- 2.4. Spain
- 2.5. United Kingdom
- 2.6. Italy
- 2.7. Rest of Europe
-
3. Asia Pacific
- 3.1. India
- 3.2. China
- 3.3. Japan
- 3.4. Australia
- 3.5. Rest of Asia pacific
-
4. South America
- 4.1. Brazil
- 4.2. Argentina
- 4.3. Rest of South America
-
5. Middle East and Africa
- 5.1. United Arab Emirates
- 5.2. South Africa
- 5.3. Rest of Middle East
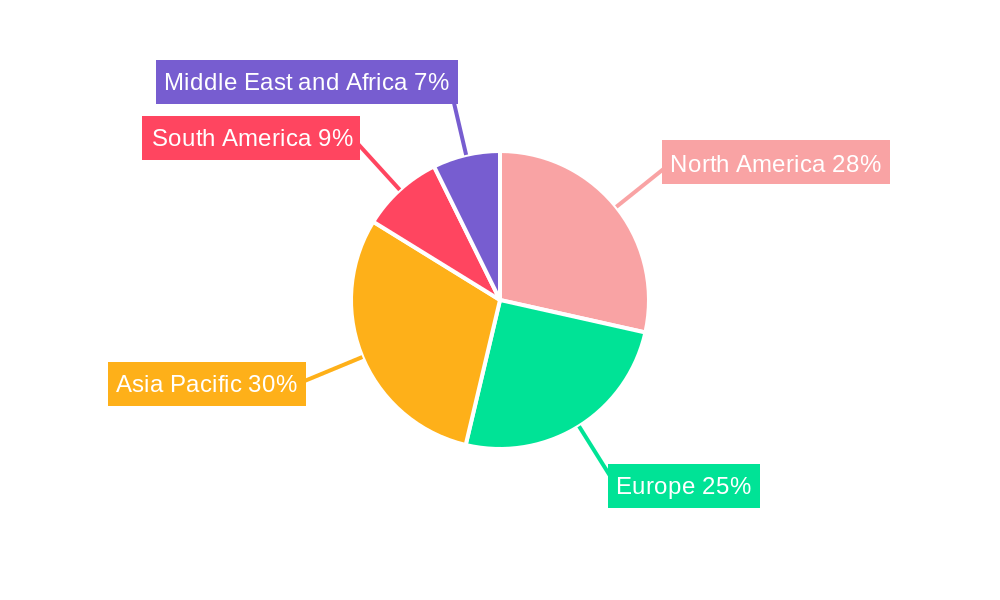
Packaged Honey Market Regional Market Share
Geographic Coverage of Packaged Honey Market
Packaged Honey Market REPORT HIGHLIGHTS
| Aspects | Details |
|---|---|
| Study Period | 2020-2034 |
| Base Year | 2025 |
| Estimated Year | 2026 |
| Forecast Period | 2026-2034 |
| Historical Period | 2020-2025 |
| Growth Rate | CAGR of 6.43% from 2020-2034 |
| Segmentation |
|
Table of Contents
- 1. Introduction
- 1.1. Research Scope
- 1.2. Market Segmentation
- 1.3. Research Objective
- 1.4. Definitions and Assumptions
- 2. Executive Summary
- 2.1. Market Snapshot
- 3. Market Dynamics
- 3.1. Market Drivers
- 3.2. Market Restrains
- 3.3. Market Trends
- 3.4. Market Opportunities
- 4. Market Factor Analysis
- 4.1. Porters Five Forces
- 4.1.1. Bargaining Power of Suppliers
- 4.1.2. Bargaining Power of Buyers
- 4.1.3. Threat of New Entrants
- 4.1.4. Threat of Substitutes
- 4.1.5. Competitive Rivalry
- 4.2. PESTEL analysis
- 4.3. BCG Analysis
- 4.3.1. Stars (High Growth, High Market Share)
- 4.3.2. Cash Cows (Low Growth, High Market Share)
- 4.3.3. Question Mark (High Growth, Low Market Share)
- 4.3.4. Dogs (Low Growth, Low Market Share)
- 4.4. Ansoff Matrix Analysis
- 4.5. Supply Chain Analysis
- 4.6. Regulatory Landscape
- 4.7. Current Market Potential and Opportunity Assessment (TAM–SAM–SOM Framework)
- 4.8. DMV Analyst Note
- 4.1. Porters Five Forces
- 5. Market Analysis, Insights and Forecast 2021-2033
- 5.1. Market Analysis, Insights and Forecast - by Product Category
- 5.1.1. Conventional
- 5.1.2. Organic
- 5.2. Market Analysis, Insights and Forecast - by Packaging Type
- 5.2.1. Pet Bottles
- 5.2.2. Glass Jars
- 5.2.3. Other Packaging Types
- 5.3. Market Analysis, Insights and Forecast - by Region
- 5.3.1. North America
- 5.3.2. Europe
- 5.3.3. Asia Pacific
- 5.3.4. South America
- 5.3.5. Middle East and Africa
- 5.1. Market Analysis, Insights and Forecast - by Product Category
- 6. Global Packaged Honey Market Analysis, Insights and Forecast, 2021-2033
- 6.1. Market Analysis, Insights and Forecast - by Product Category
- 6.1.1. Conventional
- 6.1.2. Organic
- 6.2. Market Analysis, Insights and Forecast - by Packaging Type
- 6.2.1. Pet Bottles
- 6.2.2. Glass Jars
- 6.2.3. Other Packaging Types
- 6.1. Market Analysis, Insights and Forecast - by Product Category
- 7. North America Packaged Honey Market Analysis, Insights and Forecast, 2020-2032
- 7.1. Market Analysis, Insights and Forecast - by Product Category
- 7.1.1. Conventional
- 7.1.2. Organic
- 7.2. Market Analysis, Insights and Forecast - by Packaging Type
- 7.2.1. Pet Bottles
- 7.2.2. Glass Jars
- 7.2.3. Other Packaging Types
- 7.1. Market Analysis, Insights and Forecast - by Product Category
- 8. Europe Packaged Honey Market Analysis, Insights and Forecast, 2020-2032
- 8.1. Market Analysis, Insights and Forecast - by Product Category
- 8.1.1. Conventional
- 8.1.2. Organic
- 8.2. Market Analysis, Insights and Forecast - by Packaging Type
- 8.2.1. Pet Bottles
- 8.2.2. Glass Jars
- 8.2.3. Other Packaging Types
- 8.1. Market Analysis, Insights and Forecast - by Product Category
- 9. Asia Pacific Packaged Honey Market Analysis, Insights and Forecast, 2020-2032
- 9.1. Market Analysis, Insights and Forecast - by Product Category
- 9.1.1. Conventional
- 9.1.2. Organic
- 9.2. Market Analysis, Insights and Forecast - by Packaging Type
- 9.2.1. Pet Bottles
- 9.2.2. Glass Jars
- 9.2.3. Other Packaging Types
- 9.1. Market Analysis, Insights and Forecast - by Product Category
- 10. South America Packaged Honey Market Analysis, Insights and Forecast, 2020-2032
- 10.1. Market Analysis, Insights and Forecast - by Product Category
- 10.1.1. Conventional
- 10.1.2. Organic
- 10.2. Market Analysis, Insights and Forecast - by Packaging Type
- 10.2.1. Pet Bottles
- 10.2.2. Glass Jars
- 10.2.3. Other Packaging Types
- 10.1. Market Analysis, Insights and Forecast - by Product Category
- 11. Middle East and Africa Packaged Honey Market Analysis, Insights and Forecast, 2020-2032
- 11.1. Market Analysis, Insights and Forecast - by Product Category
- 11.1.1. Conventional
- 11.1.2. Organic
- 11.2. Market Analysis, Insights and Forecast - by Packaging Type
- 11.2.1. Pet Bottles
- 11.2.2. Glass Jars
- 11.2.3. Other Packaging Types
- 11.1. Market Analysis, Insights and Forecast - by Product Category
- 12. Competitive Analysis
- 12.1. Company Profiles
- 12.1.1 Dabur India Ltd
- 12.1.1.1. Company Overview
- 12.1.1.2. Products
- 12.1.1.3. Company Financials
- 12.1.1.4. SWOT Analysis
- 12.1.2 Sweet Harvest Foods
- 12.1.2.1. Company Overview
- 12.1.2.2. Products
- 12.1.2.3. Company Financials
- 12.1.2.4. SWOT Analysis
- 12.1.3 Sioux Honey Association Co-op
- 12.1.3.1. Company Overview
- 12.1.3.2. Products
- 12.1.3.3. Company Financials
- 12.1.3.4. SWOT Analysis
- 12.1.4 Barkman Honey LLC
- 12.1.4.1. Company Overview
- 12.1.4.2. Products
- 12.1.4.3. Company Financials
- 12.1.4.4. SWOT Analysis
- 12.1.5 Hive & Wellness Australia Pty Ltd
- 12.1.5.1. Company Overview
- 12.1.5.2. Products
- 12.1.5.3. Company Financials
- 12.1.5.4. SWOT Analysis
- 12.1.6 Patanjali Ayurved Limited
- 12.1.6.1. Company Overview
- 12.1.6.2. Products
- 12.1.6.3. Company Financials
- 12.1.6.4. SWOT Analysis
- 12.1.7 Bright Food Group co Ltd
- 12.1.7.1. Company Overview
- 12.1.7.2. Products
- 12.1.7.3. Company Financials
- 12.1.7.4. SWOT Analysis
- 12.1.8 Mccormick & Company Inc
- 12.1.8.1. Company Overview
- 12.1.8.2. Products
- 12.1.8.3. Company Financials
- 12.1.8.4. SWOT Analysis
- 12.1.9 The J M Smucker Company
- 12.1.9.1. Company Overview
- 12.1.9.2. Products
- 12.1.9.3. Company Financials
- 12.1.9.4. SWOT Analysis
- 12.1.10 Apis Group*List Not Exhaustive
- 12.1.10.1. Company Overview
- 12.1.10.2. Products
- 12.1.10.3. Company Financials
- 12.1.10.4. SWOT Analysis
- 12.1.1 Dabur India Ltd
- 12.2. Market Entropy
- 12.2.1 Company's Key Areas Served
- 12.2.2 Recent Developments
- 12.3. Company Market Share Analysis 2025
- 12.3.1 Top 5 Companies Market Share Analysis
- 12.3.2 Top 3 Companies Market Share Analysis
- 12.4. List of Potential Customers
- 13. Research Methodology
List of Figures
- Figure 1: Global Packaged Honey Market Revenue Breakdown (Million, %) by Region 2025 & 2033
- Figure 2: Global Packaged Honey Market Volume Breakdown (Billion, %) by Region 2025 & 2033
- Figure 3: North America Packaged Honey Market Revenue (Million), by Product Category 2025 & 2033
- Figure 4: North America Packaged Honey Market Volume (Billion), by Product Category 2025 & 2033
- Figure 5: North America Packaged Honey Market Revenue Share (%), by Product Category 2025 & 2033
- Figure 6: North America Packaged Honey Market Volume Share (%), by Product Category 2025 & 2033
- Figure 7: North America Packaged Honey Market Revenue (Million), by Packaging Type 2025 & 2033
- Figure 8: North America Packaged Honey Market Volume (Billion), by Packaging Type 2025 & 2033
- Figure 9: North America Packaged Honey Market Revenue Share (%), by Packaging Type 2025 & 2033
- Figure 10: North America Packaged Honey Market Volume Share (%), by Packaging Type 2025 & 2033
- Figure 11: North America Packaged Honey Market Revenue (Million), by Country 2025 & 2033
- Figure 12: North America Packaged Honey Market Volume (Billion), by Country 2025 & 2033
- Figure 13: North America Packaged Honey Market Revenue Share (%), by Country 2025 & 2033
- Figure 14: North America Packaged Honey Market Volume Share (%), by Country 2025 & 2033
- Figure 15: Europe Packaged Honey Market Revenue (Million), by Product Category 2025 & 2033
- Figure 16: Europe Packaged Honey Market Volume (Billion), by Product Category 2025 & 2033
- Figure 17: Europe Packaged Honey Market Revenue Share (%), by Product Category 2025 & 2033
- Figure 18: Europe Packaged Honey Market Volume Share (%), by Product Category 2025 & 2033
- Figure 19: Europe Packaged Honey Market Revenue (Million), by Packaging Type 2025 & 2033
- Figure 20: Europe Packaged Honey Market Volume (Billion), by Packaging Type 2025 & 2033
- Figure 21: Europe Packaged Honey Market Revenue Share (%), by Packaging Type 2025 & 2033
- Figure 22: Europe Packaged Honey Market Volume Share (%), by Packaging Type 2025 & 2033
- Figure 23: Europe Packaged Honey Market Revenue (Million), by Country 2025 & 2033
- Figure 24: Europe Packaged Honey Market Volume (Billion), by Country 2025 & 2033
- Figure 25: Europe Packaged Honey Market Revenue Share (%), by Country 2025 & 2033
- Figure 26: Europe Packaged Honey Market Volume Share (%), by Country 2025 & 2033
- Figure 27: Asia Pacific Packaged Honey Market Revenue (Million), by Product Category 2025 & 2033
- Figure 28: Asia Pacific Packaged Honey Market Volume (Billion), by Product Category 2025 & 2033
- Figure 29: Asia Pacific Packaged Honey Market Revenue Share (%), by Product Category 2025 & 2033
- Figure 30: Asia Pacific Packaged Honey Market Volume Share (%), by Product Category 2025 & 2033
- Figure 31: Asia Pacific Packaged Honey Market Revenue (Million), by Packaging Type 2025 & 2033
- Figure 32: Asia Pacific Packaged Honey Market Volume (Billion), by Packaging Type 2025 & 2033
- Figure 33: Asia Pacific Packaged Honey Market Revenue Share (%), by Packaging Type 2025 & 2033
- Figure 34: Asia Pacific Packaged Honey Market Volume Share (%), by Packaging Type 2025 & 2033
- Figure 35: Asia Pacific Packaged Honey Market Revenue (Million), by Country 2025 & 2033
- Figure 36: Asia Pacific Packaged Honey Market Volume (Billion), by Country 2025 & 2033
- Figure 37: Asia Pacific Packaged Honey Market Revenue Share (%), by Country 2025 & 2033
- Figure 38: Asia Pacific Packaged Honey Market Volume Share (%), by Country 2025 & 2033
- Figure 39: South America Packaged Honey Market Revenue (Million), by Product Category 2025 & 2033
- Figure 40: South America Packaged Honey Market Volume (Billion), by Product Category 2025 & 2033
- Figure 41: South America Packaged Honey Market Revenue Share (%), by Product Category 2025 & 2033
- Figure 42: South America Packaged Honey Market Volume Share (%), by Product Category 2025 & 2033
- Figure 43: South America Packaged Honey Market Revenue (Million), by Packaging Type 2025 & 2033
- Figure 44: South America Packaged Honey Market Volume (Billion), by Packaging Type 2025 & 2033
- Figure 45: South America Packaged Honey Market Revenue Share (%), by Packaging Type 2025 & 2033
- Figure 46: South America Packaged Honey Market Volume Share (%), by Packaging Type 2025 & 2033
- Figure 47: South America Packaged Honey Market Revenue (Million), by Country 2025 & 2033
- Figure 48: South America Packaged Honey Market Volume (Billion), by Country 2025 & 2033
- Figure 49: South America Packaged Honey Market Revenue Share (%), by Country 2025 & 2033
- Figure 50: South America Packaged Honey Market Volume Share (%), by Country 2025 & 2033
- Figure 51: Middle East and Africa Packaged Honey Market Revenue (Million), by Product Category 2025 & 2033
- Figure 52: Middle East and Africa Packaged Honey Market Volume (Billion), by Product Category 2025 & 2033
- Figure 53: Middle East and Africa Packaged Honey Market Revenue Share (%), by Product Category 2025 & 2033
- Figure 54: Middle East and Africa Packaged Honey Market Volume Share (%), by Product Category 2025 & 2033
- Figure 55: Middle East and Africa Packaged Honey Market Revenue (Million), by Packaging Type 2025 & 2033
- Figure 56: Middle East and Africa Packaged Honey Market Volume (Billion), by Packaging Type 2025 & 2033
- Figure 57: Middle East and Africa Packaged Honey Market Revenue Share (%), by Packaging Type 2025 & 2033
- Figure 58: Middle East and Africa Packaged Honey Market Volume Share (%), by Packaging Type 2025 & 2033
- Figure 59: Middle East and Africa Packaged Honey Market Revenue (Million), by Country 2025 & 2033
- Figure 60: Middle East and Africa Packaged Honey Market Volume (Billion), by Country 2025 & 2033
- Figure 61: Middle East and Africa Packaged Honey Market Revenue Share (%), by Country 2025 & 2033
- Figure 62: Middle East and Africa Packaged Honey Market Volume Share (%), by Country 2025 & 2033
List of Tables
- Table 1: Global Packaged Honey Market Revenue Million Forecast, by Product Category 2020 & 2033
- Table 2: Global Packaged Honey Market Volume Billion Forecast, by Product Category 2020 & 2033
- Table 3: Global Packaged Honey Market Revenue Million Forecast, by Packaging Type 2020 & 2033
- Table 4: Global Packaged Honey Market Volume Billion Forecast, by Packaging Type 2020 & 2033
- Table 5: Global Packaged Honey Market Revenue Million Forecast, by Region 2020 & 2033
- Table 6: Global Packaged Honey Market Volume Billion Forecast, by Region 2020 & 2033
- Table 7: Global Packaged Honey Market Revenue Million Forecast, by Product Category 2020 & 2033
- Table 8: Global Packaged Honey Market Volume Billion Forecast, by Product Category 2020 & 2033
- Table 9: Global Packaged Honey Market Revenue Million Forecast, by Packaging Type 2020 & 2033
- Table 10: Global Packaged Honey Market Volume Billion Forecast, by Packaging Type 2020 & 2033
- Table 11: Global Packaged Honey Market Revenue Million Forecast, by Country 2020 & 2033
- Table 12: Global Packaged Honey Market Volume Billion Forecast, by Country 2020 & 2033
- Table 13: United States Packaged Honey Market Revenue (Million) Forecast, by Application 2020 & 2033
- Table 14: United States Packaged Honey Market Volume (Billion) Forecast, by Application 2020 & 2033
- Table 15: Canada Packaged Honey Market Revenue (Million) Forecast, by Application 2020 & 2033
- Table 16: Canada Packaged Honey Market Volume (Billion) Forecast, by Application 2020 & 2033
- Table 17: Mexico Packaged Honey Market Revenue (Million) Forecast, by Application 2020 & 2033
- Table 18: Mexico Packaged Honey Market Volume (Billion) Forecast, by Application 2020 & 2033
- Table 19: Rest of North America Packaged Honey Market Revenue (Million) Forecast, by Application 2020 & 2033
- Table 20: Rest of North America Packaged Honey Market Volume (Billion) Forecast, by Application 2020 & 2033
- Table 21: Global Packaged Honey Market Revenue Million Forecast, by Product Category 2020 & 2033
- Table 22: Global Packaged Honey Market Volume Billion Forecast, by Product Category 2020 & 2033
- Table 23: Global Packaged Honey Market Revenue Million Forecast, by Packaging Type 2020 & 2033
- Table 24: Global Packaged Honey Market Volume Billion Forecast, by Packaging Type 2020 & 2033
- Table 25: Global Packaged Honey Market Revenue Million Forecast, by Country 2020 & 2033
- Table 26: Global Packaged Honey Market Volume Billion Forecast, by Country 2020 & 2033
- Table 27: Germany Packaged Honey Market Revenue (Million) Forecast, by Application 2020 & 2033
- Table 28: Germany Packaged Honey Market Volume (Billion) Forecast, by Application 2020 & 2033
- Table 29: France Packaged Honey Market Revenue (Million) Forecast, by Application 2020 & 2033
- Table 30: France Packaged Honey Market Volume (Billion) Forecast, by Application 2020 & 2033
- Table 31: Russia Packaged Honey Market Revenue (Million) Forecast, by Application 2020 & 2033
- Table 32: Russia Packaged Honey Market Volume (Billion) Forecast, by Application 2020 & 2033
- Table 33: Spain Packaged Honey Market Revenue (Million) Forecast, by Application 2020 & 2033
- Table 34: Spain Packaged Honey Market Volume (Billion) Forecast, by Application 2020 & 2033
- Table 35: United Kingdom Packaged Honey Market Revenue (Million) Forecast, by Application 2020 & 2033
- Table 36: United Kingdom Packaged Honey Market Volume (Billion) Forecast, by Application 2020 & 2033
- Table 37: Italy Packaged Honey Market Revenue (Million) Forecast, by Application 2020 & 2033
- Table 38: Italy Packaged Honey Market Volume (Billion) Forecast, by Application 2020 & 2033
- Table 39: Rest of Europe Packaged Honey Market Revenue (Million) Forecast, by Application 2020 & 2033
- Table 40: Rest of Europe Packaged Honey Market Volume (Billion) Forecast, by Application 2020 & 2033
- Table 41: Global Packaged Honey Market Revenue Million Forecast, by Product Category 2020 & 2033
- Table 42: Global Packaged Honey Market Volume Billion Forecast, by Product Category 2020 & 2033
- Table 43: Global Packaged Honey Market Revenue Million Forecast, by Packaging Type 2020 & 2033
- Table 44: Global Packaged Honey Market Volume Billion Forecast, by Packaging Type 2020 & 2033
- Table 45: Global Packaged Honey Market Revenue Million Forecast, by Country 2020 & 2033
- Table 46: Global Packaged Honey Market Volume Billion Forecast, by Country 2020 & 2033
- Table 47: India Packaged Honey Market Revenue (Million) Forecast, by Application 2020 & 2033
- Table 48: India Packaged Honey Market Volume (Billion) Forecast, by Application 2020 & 2033
- Table 49: China Packaged Honey Market Revenue (Million) Forecast, by Application 2020 & 2033
- Table 50: China Packaged Honey Market Volume (Billion) Forecast, by Application 2020 & 2033
- Table 51: Japan Packaged Honey Market Revenue (Million) Forecast, by Application 2020 & 2033
- Table 52: Japan Packaged Honey Market Volume (Billion) Forecast, by Application 2020 & 2033
- Table 53: Australia Packaged Honey Market Revenue (Million) Forecast, by Application 2020 & 2033
- Table 54: Australia Packaged Honey Market Volume (Billion) Forecast, by Application 2020 & 2033
- Table 55: Rest of Asia pacific Packaged Honey Market Revenue (Million) Forecast, by Application 2020 & 2033
- Table 56: Rest of Asia pacific Packaged Honey Market Volume (Billion) Forecast, by Application 2020 & 2033
- Table 57: Global Packaged Honey Market Revenue Million Forecast, by Product Category 2020 & 2033
- Table 58: Global Packaged Honey Market Volume Billion Forecast, by Product Category 2020 & 2033
- Table 59: Global Packaged Honey Market Revenue Million Forecast, by Packaging Type 2020 & 2033
- Table 60: Global Packaged Honey Market Volume Billion Forecast, by Packaging Type 2020 & 2033
- Table 61: Global Packaged Honey Market Revenue Million Forecast, by Country 2020 & 2033
- Table 62: Global Packaged Honey Market Volume Billion Forecast, by Country 2020 & 2033
- Table 63: Brazil Packaged Honey Market Revenue (Million) Forecast, by Application 2020 & 2033
- Table 64: Brazil Packaged Honey Market Volume (Billion) Forecast, by Application 2020 & 2033
- Table 65: Argentina Packaged Honey Market Revenue (Million) Forecast, by Application 2020 & 2033
- Table 66: Argentina Packaged Honey Market Volume (Billion) Forecast, by Application 2020 & 2033
- Table 67: Rest of South America Packaged Honey Market Revenue (Million) Forecast, by Application 2020 & 2033
- Table 68: Rest of South America Packaged Honey Market Volume (Billion) Forecast, by Application 2020 & 2033
- Table 69: Global Packaged Honey Market Revenue Million Forecast, by Product Category 2020 & 2033
- Table 70: Global Packaged Honey Market Volume Billion Forecast, by Product Category 2020 & 2033
- Table 71: Global Packaged Honey Market Revenue Million Forecast, by Packaging Type 2020 & 2033
- Table 72: Global Packaged Honey Market Volume Billion Forecast, by Packaging Type 2020 & 2033
- Table 73: Global Packaged Honey Market Revenue Million Forecast, by Country 2020 & 2033
- Table 74: Global Packaged Honey Market Volume Billion Forecast, by Country 2020 & 2033
- Table 75: United Arab Emirates Packaged Honey Market Revenue (Million) Forecast, by Application 2020 & 2033
- Table 76: United Arab Emirates Packaged Honey Market Volume (Billion) Forecast, by Application 2020 & 2033
- Table 77: South Africa Packaged Honey Market Revenue (Million) Forecast, by Application 2020 & 2033
- Table 78: South Africa Packaged Honey Market Volume (Billion) Forecast, by Application 2020 & 2033
- Table 79: Rest of Middle East Packaged Honey Market Revenue (Million) Forecast, by Application 2020 & 2033
- Table 80: Rest of Middle East Packaged Honey Market Volume (Billion) Forecast, by Application 2020 & 2033
Frequently Asked Questions
1. What is the projected Compound Annual Growth Rate (CAGR) of the Packaged Honey Market?
The projected CAGR is approximately 6.43%.
2. Which companies are prominent players in the Packaged Honey Market?
Key companies in the market include Dabur India Ltd, Sweet Harvest Foods, Sioux Honey Association Co-op, Barkman Honey LLC, Hive & Wellness Australia Pty Ltd, Patanjali Ayurved Limited, Bright Food Group co Ltd, Mccormick & Company Inc, The J M Smucker Company, Apis Group*List Not Exhaustive.
3. What are the main segments of the Packaged Honey Market?
The market segments include Product Category, Packaging Type.
4. Can you provide details about the market size?
The market size is estimated to be USD 10.92 Million as of 2022.
5. What are some drivers contributing to market growth?
Increasing Demand for Natural Sweeteners; Government Initiatives Boost Honey Production and Beekeeping.
6. What are the notable trends driving market growth?
Conventional Honey Is Consumed Globally.
7. Are there any restraints impacting market growth?
Increasing Demand for Natural Sweeteners; Government Initiatives Boost Honey Production and Beekeeping.
8. Can you provide examples of recent developments in the market?
January 2024: Dabur, one of the leading firms in the Ayurvedic and personal care space, recently invested approximately INR 135 crore in expanding its manufacturing facility in South India. This move is geared toward bolstering the production capacity of its flagship products, including Dabur Honey, Dabur Red Paste, and Odonil air fresheners.
9. What pricing options are available for accessing the report?
Pricing options include single-user, multi-user, and enterprise licenses priced at USD 4750, USD 5250, and USD 8750 respectively.
10. Is the market size provided in terms of value or volume?
The market size is provided in terms of value, measured in Million and volume, measured in Billion.
11. Are there any specific market keywords associated with the report?
Yes, the market keyword associated with the report is "Packaged Honey Market," which aids in identifying and referencing the specific market segment covered.
12. How do I determine which pricing option suits my needs best?
The pricing options vary based on user requirements and access needs. Individual users may opt for single-user licenses, while businesses requiring broader access may choose multi-user or enterprise licenses for cost-effective access to the report.
13. Are there any additional resources or data provided in the Packaged Honey Market report?
While the report offers comprehensive insights, it's advisable to review the specific contents or supplementary materials provided to ascertain if additional resources or data are available.
14. How can I stay updated on further developments or reports in the Packaged Honey Market?
To stay informed about further developments, trends, and reports in the Packaged Honey Market, consider subscribing to industry newsletters, following relevant companies and organizations, or regularly checking reputable industry news sources and publications.
Methodology
Step 1 - Identification of Relevant Samples Size from Population Database


Step 2 - Approaches for Defining Global Market Size (Value, Volume* & Price*)

Note*: In applicable scenarios
Step 3 - Data Sources
Primary Research
- Web Analytics
- Survey Reports
- Research Institute
- Latest Research Reports
- Opinion Leaders
Secondary Research
- Annual Reports
- White Paper
- Latest Press Release
- Industry Association
- Paid Database
- Investor Presentations

Step 4 - Data Triangulation
Involves using different sources of information in order to increase the validity of a study
These sources are likely to be stakeholders in a program - participants, other researchers, program staff, other community members, and so on.
Then we put all data in single framework & apply various statistical tools to find out the dynamic on the market.
During the analysis stage, feedback from the stakeholder groups would be compared to determine areas of agreement as well as areas of divergence