

Key Insights
The Japanese Food Service Industry is projected for significant expansion, with an estimated Compound Annual Growth Rate (CAGR) of 12.7%. This robust growth, driven by evolving consumer preferences and a dynamic culinary scene, is expected to propel the market size to $256.5 billion by the base year: 2024. Key growth catalysts include escalating demand for convenient and varied dining solutions, the rising popularity of international flavors, and continuous innovation in quick-service (QSR) and full-service restaurants (FSR). The emergence of cloud kitchens and a growing emphasis on premium, experiential dining further shape market dynamics. Consumers are actively seeking unique culinary journeys, boosting demand for specialized offerings in segments such as artisan coffee and tea establishments and diverse FSR categories.
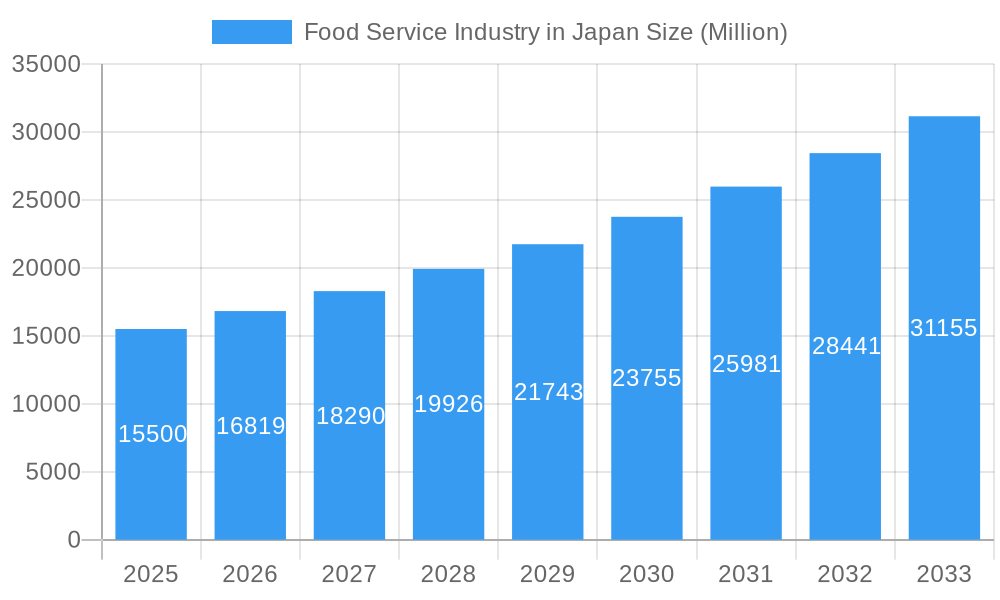
Food Service Industry in Japan Market Size (In Billion)
While the growth outlook is strong, the industry encounters challenges including escalating operational expenditures, particularly for labor and raw materials, and intense market competition demanding continuous adaptation and technological investment. Global economic fluctuations and evolving regulatory frameworks also present hurdles for operators. Nevertheless, the sector's inherent resilience, strong consumer inclination for dining out, substantial foreign investment, and the presence of leading global and local enterprises point to a promising future. The industry's diverse segmentation, from widespread chain establishments to niche independent venues, caters to a broad spectrum of consumer needs across leisure, retail, and travel environments.
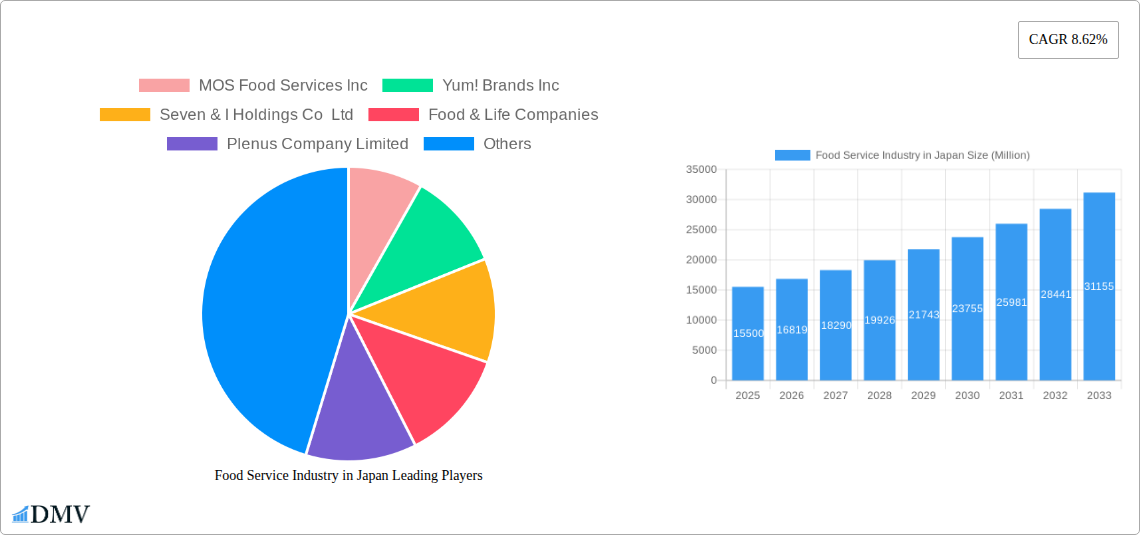
Food Service Industry in Japan Company Market Share
Food Service Industry in Japan Market Composition & Trends
This comprehensive report offers an in-depth analysis of the Japanese food service industry, examining its intricate market composition and dynamic trends from 2019 to 2033. With a base year of 2025, the study forecasts significant evolution driven by technological advancements and shifting consumer preferences. The market is characterized by a dynamic interplay between major players like Seven & I Holdings Co Ltd, McDonald's Corporation, Yoshinoya Holdings Co Ltd, and Zensho Holding, who hold substantial market share. Innovation catalysts are evident in the increasing adoption of cloud kitchens and the strategic expansion of quick service restaurants (QSRs) and cafes. Regulatory landscapes, while generally stable, present opportunities for adaptation in areas like food safety and sustainability. Substitute products, particularly from the convenience store sector and home meal kits, continue to exert competitive pressure. End-user profiles reveal a growing demand for convenience, health-conscious options, and experiential dining. M&A activities are anticipated to shape market concentration, with potential deals valued in the Million range. The report dissects market share distribution, highlighting the dominance of chained outlets and the resilience of independent establishments.
- Market Concentration: Dominated by large conglomerates with a significant share held by key players.
- Innovation Catalysts: Rise of cloud kitchens, technological integration, and novel menu offerings.
- Regulatory Landscapes: Emphasis on food safety standards and evolving health regulations.
- Substitute Products: Competition from convenience stores, home delivery, and prepared meal services.
- End-User Profiles: Diverse demands from busy urban professionals to family-oriented consumers.
- M&A Activities: Expected to drive consolidation and strategic partnerships, with potential deal values in the Million range.
- Market Share Distribution: Analysis of contributions from QSRs, FSRs, and Cafes & Bars.
- M&A Deal Values: Projections for significant investments and acquisitions within the sector.
Food Service Industry in Japan Industry Evolution
The Japanese food service industry has undergone a remarkable evolution, consistently demonstrating robust growth trajectories and a remarkable ability to adapt to changing economic climates and consumer behaviors. From 2019 to 2024, the historical period showcases a resilient market, with key segments like Quick Service Restaurants (QSRs) and Cafes & Bars exhibiting steady upward trends. The estimated year of 2025 marks a pivotal point, with projections indicating accelerated growth driven by technological integration and evolving consumer demands for convenience and unique dining experiences. Throughout the forecast period (2025-2033), the industry is expected to witness sustained expansion, with an estimated compound annual growth rate (CAGR) of approximately XX%. This growth is underpinned by significant technological advancements, including the widespread adoption of online ordering platforms, advanced kitchen automation, and data analytics to personalize customer experiences. Shifting consumer demands are a paramount factor, with a noticeable surge in the preference for healthier, sustainably sourced ingredients, plant-based options, and a growing appreciation for specialized culinary offerings such as artisanal coffee and international cuisines. The proliferation of chained outlets, exemplified by the strategic expansion of brands like MOS Food Services Inc. and Yum! Brands Inc., alongside the innovative approaches of independent businesses, contributes to a vibrant and competitive landscape. The integration of food delivery services has become a critical component, boosting accessibility and reaching new customer demographics. Furthermore, the industry's capacity for rapid product innovation, as seen in the introduction of novel menu items and experiential dining concepts by companies like Food & Life Companies and Kura Sushi Inc., ensures continued consumer engagement and market dynamism.
Leading Regions, Countries, or Segments in Food Service Industry in Japan
The Japanese food service industry is a complex ecosystem, with distinct regional strengths and segment dominance shaping its overall trajectory. While a singular "leading country" is not applicable within Japan, the Kanto region, encompassing Tokyo and its surrounding prefectures, consistently emerges as the dominant market due to its high population density, concentration of businesses, and status as a global tourist hub. Within this dynamic region, Quick Service Restaurants (QSRs), particularly the Burger and Pizza sub-segments, command a significant market share. Their success is driven by the fast-paced lifestyle of urban dwellers, the convenience offered by efficient service, and aggressive marketing campaigns by giants like McDonald's Corporation and Domino’s Pizza Enterprises Ltd.. Chained outlets overwhelmingly dominate this segment, benefiting from economies of scale and standardized operational procedures.
Beyond QSRs, Cafes & Bars, specifically Specialist Coffee & Tea Shops, have witnessed phenomenal growth. Starbucks Corporation and local competitors like Komeda Holdings Co Ltd have capitalized on the demand for "third spaces" – environments offering respite and social interaction beyond home and work. This segment thrives in Retail locations and Standalone establishments, catering to a broad demographic seeking quality beverages and a comfortable ambiance. The appeal lies in the experiential aspect, with seasonal offerings and unique store designs playing a crucial role.
Full Service Restaurants (FSRs), particularly those specializing in Asian cuisines, including traditional Japanese fare, also hold a considerable share. Brands like Skylark Holdings Co Ltd and Yoshinoya Holdings Co Ltd have successfully adapted to evolving tastes while maintaining their core offerings. The dominance here is influenced by the appreciation for authentic culinary experiences and the growing interest in diversified global cuisines. While Cloud Kitchens are an emerging and rapidly growing segment, their current market penetration, though increasing, is still lower than established segments. Their strength lies in their operational efficiency and ability to cater to the burgeoning food delivery market, often situated in strategically advantageous locations for logistics.
- Dominant Region: Kanto Region (Tokyo Metropolitan Area).
- Key Drivers: High population density, economic hub, significant tourism influx.
- Impact: Highest concentration of food service outlets and consumer spending.
- Leading Segment: Quick Service Restaurants (QSRs).
- Dominant Sub-segments: Burger, Pizza.
- Outlet Type: Primarily Chained Outlets.
- Location Influence: High presence in Retail and Standalone locations, catering to convenience.
- Growth Factors: Speed of service, affordability, effective brand marketing.
- High-Growth Segment: Cafes & Bars (Specialist Coffee & Tea Shops).
- Leading Players: Starbucks Corporation, Komeda Holdings Co Ltd.
- Location Influence: Prominent in Retail, Travel, and Standalone environments.
- Demand Drivers: Experiential consumption, social gathering spaces, premium beverage offerings.
- Significant Segment: Full Service Restaurants (FSRs) – Asian Cuisine.
- Key Players: Skylark Holdings Co Ltd, Yoshinoya Holdings Co Ltd.
- Consumer Preference: Appreciation for authentic and diverse culinary experiences.
- Emerging Segment: Cloud Kitchens.
- Key Impact: Facilitating the growth of food delivery services and expanding reach.
- Strategic Advantage: Operational efficiency and lower overheads.
Food Service Industry in Japan Product Innovations
Product innovation in the Japanese food service industry is a continuous pursuit, focusing on enhanced convenience, unique flavor profiles, and health-conscious offerings. Companies are actively developing novel menu items that cater to evolving consumer tastes, such as the recent introduction of innovative coffee beverages like Starbucks' Oleato™ by Starbucks Corporation, which combines arabica coffee with extra virgin olive oil, offering a unique textural and flavor experience. Quick service restaurants are also pushing boundaries; for instance, McDonald's Corporation’s collaboration with the popular anime franchise One Piece for a themed Chicken Tatsuta Burger highlights a trend towards experiential marketing and appealing to niche fan bases. Similarly, KFC's nationwide launch of hash brown burgers demonstrates a fusion of popular comfort food elements. These innovations often leverage advancements in food technology for improved taste, texture, and shelf-life, aiming for higher customer satisfaction and increased sales.
Propelling Factors for Food Service Industry in Japan Growth
Several key factors are propelling the growth of the Japanese food service industry. Technologically, the widespread adoption of online ordering platforms, mobile payment systems, and advanced kitchen automation is enhancing operational efficiency and customer convenience. Economically, a rising disposable income among a significant portion of the population, coupled with a strong tourism sector, fuels consumer spending on dining out and convenience foods. Regulatory support, while focused on safety and quality, has also fostered an environment where innovation can flourish. Furthermore, shifting consumer demands towards healthier options, plant-based diets, and unique culinary experiences create new market opportunities, driving demand for diversified and specialized offerings.
Obstacles in the Food Service Industry in Japan Market
Despite robust growth, the Japanese food service industry faces several obstacles. Regulatory challenges, though generally supportive, can sometimes lead to increased operational costs due to stringent food safety and labor laws. Supply chain disruptions, exacerbated by global events, can impact the availability and cost of key ingredients, affecting profitability. Fierce competitive pressures from both domestic and international players, including the burgeoning convenience store sector and home delivery services, constantly challenge market share. Labor shortages, a persistent issue in Japan's aging society, also strain operations, leading to increased labor costs and potential service quality compromises.
Future Opportunities in Food Service Industry in Japan
The future of the Japanese food service industry is ripe with opportunities. The burgeoning demand for plant-based and sustainable food options presents a significant avenue for menu diversification and product development. The continued growth of the food delivery market, fueled by technological advancements and evolving consumer lifestyles, offers immense potential for cloud kitchens and third-party delivery services. Emerging markets within Japan, such as catering to the growing elderly population with specialized nutritional offerings, also represent untapped potential. Furthermore, the increasing popularity of international cuisines and fusion food concepts opens doors for niche restaurants and innovative culinary ventures, supported by ongoing inbound tourism.
Major Players in the Food Service Industry in Japan Ecosystem
- MOS Food Services Inc.
- Yum! Brands Inc.
- Seven & I Holdings Co Ltd
- Food & Life Companies
- Plenus Company Limited
- Kura Sushi Inc.
- Toridoll Holdings Corporation
- Skylark Holdings Co Ltd
- Lotteria Co Ltd
- Komeda Holdings Co Ltd
- Domino’s Pizza Enterprises Ltd
- Starbucks Corporation
- Colowide Co Ltd
- Yoshinoya Holdings Co Ltd
- McDonald's Corporation
- Zensho Holding
Key Developments in Food Service Industry in Japan Industry
- April 2023: McDonald's Corporation partnered with One Piece, a Japanese anime franchise, to launch a newer version of the burger, i.e., the Chicken Tatsuta Burger. The packaging has been themed with One Piece imagery.
- April 2023: KFC launched a range of hash brown burgers available nationwide, including Karihoku Hash Filet Burger, Karihoku Hash Filet BBQ Burger, and Karihoku Hash Filet Spicy Burger.
- April 2023: In Japan, Starbucks introduced a new type of coffee drink called Oleato™, consisting of arabica coffee and Partanna® extra virgin olive oil.
Strategic Food Service Industry in Japan Market Forecast
The strategic outlook for the Japanese food service industry is characterized by sustained growth, driven by technological integration and a dynamic response to evolving consumer preferences. The forecast period (2025-2033) anticipates continued expansion, with a particular emphasis on the QSR and Cafes & Bars segments. Key growth catalysts include the ongoing digitalization of ordering and delivery systems, the increasing demand for health-conscious and plant-based alternatives, and the leveraging of unique cultural trends for product innovation, as seen in collaborations with popular media. Investment in cloud kitchens and optimized supply chains will further enhance market reach and efficiency, ensuring the industry's continued dynamism and profitability.
Food Service Industry in Japan Segmentation
-
1. Foodservice Type
-
1.1. Cafes & Bars
-
1.1.1. By Cuisine
- 1.1.1.1. Bars & Pubs
- 1.1.1.2. Juice/Smoothie/Desserts Bars
- 1.1.1.3. Specialist Coffee & Tea Shops
-
1.1.1. By Cuisine
- 1.2. Cloud Kitchen
-
1.3. Full Service Restaurants
- 1.3.1. Asian
- 1.3.2. European
- 1.3.3. Latin American
- 1.3.4. Middle Eastern
- 1.3.5. North American
- 1.3.6. Other FSR Cuisines
-
1.4. Quick Service Restaurants
- 1.4.1. Bakeries
- 1.4.2. Burger
- 1.4.3. Ice Cream
- 1.4.4. Meat-based Cuisines
- 1.4.5. Pizza
- 1.4.6. Other QSR Cuisines
-
1.1. Cafes & Bars
-
2. Outlet
- 2.1. Chained Outlets
- 2.2. Independent Outlets
-
3. Location
- 3.1. Leisure
- 3.2. Lodging
- 3.3. Retail
- 3.4. Standalone
- 3.5. Travel
Food Service Industry in Japan Segmentation By Geography
-
1. North America
- 1.1. United States
- 1.2. Canada
- 1.3. Mexico
-
2. South America
- 2.1. Brazil
- 2.2. Argentina
- 2.3. Rest of South America
-
3. Europe
- 3.1. United Kingdom
- 3.2. Germany
- 3.3. France
- 3.4. Italy
- 3.5. Spain
- 3.6. Russia
- 3.7. Benelux
- 3.8. Nordics
- 3.9. Rest of Europe
-
4. Middle East & Africa
- 4.1. Turkey
- 4.2. Israel
- 4.3. GCC
- 4.4. North Africa
- 4.5. South Africa
- 4.6. Rest of Middle East & Africa
-
5. Asia Pacific
- 5.1. China
- 5.2. India
- 5.3. Japan
- 5.4. South Korea
- 5.5. ASEAN
- 5.6. Oceania
- 5.7. Rest of Asia Pacific
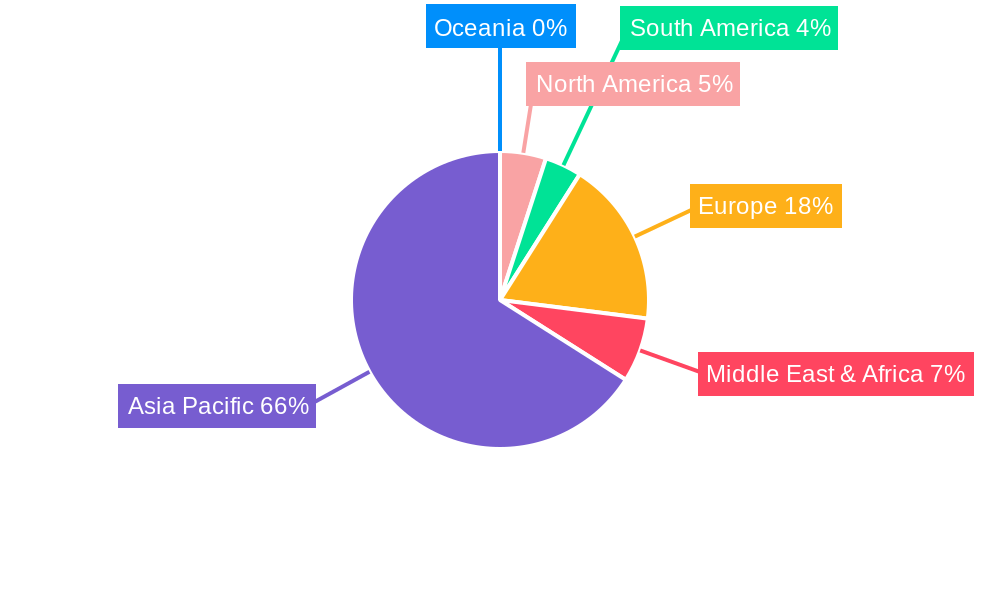
Food Service Industry in Japan Regional Market Share
Geographic Coverage of Food Service Industry in Japan
Food Service Industry in Japan REPORT HIGHLIGHTS
| Aspects | Details |
|---|---|
| Study Period | 2020-2034 |
| Base Year | 2025 |
| Estimated Year | 2026 |
| Forecast Period | 2026-2034 |
| Historical Period | 2020-2025 |
| Growth Rate | CAGR of 12.7% from 2020-2034 |
| Segmentation |
|
Table of Contents
- 1. Introduction
- 1.1. Research Scope
- 1.2. Market Segmentation
- 1.3. Research Objective
- 1.4. Definitions and Assumptions
- 2. Executive Summary
- 2.1. Market Snapshot
- 3. Market Dynamics
- 3.1. Market Drivers
- 3.2. Market Restrains
- 3.3. Market Trends
- 3.4. Market Opportunities
- 4. Market Factor Analysis
- 4.1. Porters Five Forces
- 4.1.1. Bargaining Power of Suppliers
- 4.1.2. Bargaining Power of Buyers
- 4.1.3. Threat of New Entrants
- 4.1.4. Threat of Substitutes
- 4.1.5. Competitive Rivalry
- 4.2. PESTEL analysis
- 4.3. BCG Analysis
- 4.3.1. Stars (High Growth, High Market Share)
- 4.3.2. Cash Cows (Low Growth, High Market Share)
- 4.3.3. Question Mark (High Growth, Low Market Share)
- 4.3.4. Dogs (Low Growth, Low Market Share)
- 4.4. Ansoff Matrix Analysis
- 4.5. Supply Chain Analysis
- 4.6. Regulatory Landscape
- 4.7. Current Market Potential and Opportunity Assessment (TAM–SAM–SOM Framework)
- 4.8. DMV Analyst Note
- 4.1. Porters Five Forces
- 5. Market Analysis, Insights and Forecast 2021-2033
- 5.1. Market Analysis, Insights and Forecast - by Foodservice Type
- 5.1.1. Cafes & Bars
- 5.1.1.1. By Cuisine
- 5.1.1.1.1. Bars & Pubs
- 5.1.1.1.2. Juice/Smoothie/Desserts Bars
- 5.1.1.1.3. Specialist Coffee & Tea Shops
- 5.1.1.1. By Cuisine
- 5.1.2. Cloud Kitchen
- 5.1.3. Full Service Restaurants
- 5.1.3.1. Asian
- 5.1.3.2. European
- 5.1.3.3. Latin American
- 5.1.3.4. Middle Eastern
- 5.1.3.5. North American
- 5.1.3.6. Other FSR Cuisines
- 5.1.4. Quick Service Restaurants
- 5.1.4.1. Bakeries
- 5.1.4.2. Burger
- 5.1.4.3. Ice Cream
- 5.1.4.4. Meat-based Cuisines
- 5.1.4.5. Pizza
- 5.1.4.6. Other QSR Cuisines
- 5.1.1. Cafes & Bars
- 5.2. Market Analysis, Insights and Forecast - by Outlet
- 5.2.1. Chained Outlets
- 5.2.2. Independent Outlets
- 5.3. Market Analysis, Insights and Forecast - by Location
- 5.3.1. Leisure
- 5.3.2. Lodging
- 5.3.3. Retail
- 5.3.4. Standalone
- 5.3.5. Travel
- 5.4. Market Analysis, Insights and Forecast - by Region
- 5.4.1. North America
- 5.4.2. South America
- 5.4.3. Europe
- 5.4.4. Middle East & Africa
- 5.4.5. Asia Pacific
- 5.1. Market Analysis, Insights and Forecast - by Foodservice Type
- 6. Global Food Service Industry in Japan Analysis, Insights and Forecast, 2021-2033
- 6.1. Market Analysis, Insights and Forecast - by Foodservice Type
- 6.1.1. Cafes & Bars
- 6.1.1.1. By Cuisine
- 6.1.1.1.1. Bars & Pubs
- 6.1.1.1.2. Juice/Smoothie/Desserts Bars
- 6.1.1.1.3. Specialist Coffee & Tea Shops
- 6.1.1.1. By Cuisine
- 6.1.2. Cloud Kitchen
- 6.1.3. Full Service Restaurants
- 6.1.3.1. Asian
- 6.1.3.2. European
- 6.1.3.3. Latin American
- 6.1.3.4. Middle Eastern
- 6.1.3.5. North American
- 6.1.3.6. Other FSR Cuisines
- 6.1.4. Quick Service Restaurants
- 6.1.4.1. Bakeries
- 6.1.4.2. Burger
- 6.1.4.3. Ice Cream
- 6.1.4.4. Meat-based Cuisines
- 6.1.4.5. Pizza
- 6.1.4.6. Other QSR Cuisines
- 6.1.1. Cafes & Bars
- 6.2. Market Analysis, Insights and Forecast - by Outlet
- 6.2.1. Chained Outlets
- 6.2.2. Independent Outlets
- 6.3. Market Analysis, Insights and Forecast - by Location
- 6.3.1. Leisure
- 6.3.2. Lodging
- 6.3.3. Retail
- 6.3.4. Standalone
- 6.3.5. Travel
- 6.1. Market Analysis, Insights and Forecast - by Foodservice Type
- 7. North America Food Service Industry in Japan Analysis, Insights and Forecast, 2020-2032
- 7.1. Market Analysis, Insights and Forecast - by Foodservice Type
- 7.1.1. Cafes & Bars
- 7.1.1.1. By Cuisine
- 7.1.1.1.1. Bars & Pubs
- 7.1.1.1.2. Juice/Smoothie/Desserts Bars
- 7.1.1.1.3. Specialist Coffee & Tea Shops
- 7.1.1.1. By Cuisine
- 7.1.2. Cloud Kitchen
- 7.1.3. Full Service Restaurants
- 7.1.3.1. Asian
- 7.1.3.2. European
- 7.1.3.3. Latin American
- 7.1.3.4. Middle Eastern
- 7.1.3.5. North American
- 7.1.3.6. Other FSR Cuisines
- 7.1.4. Quick Service Restaurants
- 7.1.4.1. Bakeries
- 7.1.4.2. Burger
- 7.1.4.3. Ice Cream
- 7.1.4.4. Meat-based Cuisines
- 7.1.4.5. Pizza
- 7.1.4.6. Other QSR Cuisines
- 7.1.1. Cafes & Bars
- 7.2. Market Analysis, Insights and Forecast - by Outlet
- 7.2.1. Chained Outlets
- 7.2.2. Independent Outlets
- 7.3. Market Analysis, Insights and Forecast - by Location
- 7.3.1. Leisure
- 7.3.2. Lodging
- 7.3.3. Retail
- 7.3.4. Standalone
- 7.3.5. Travel
- 7.1. Market Analysis, Insights and Forecast - by Foodservice Type
- 8. South America Food Service Industry in Japan Analysis, Insights and Forecast, 2020-2032
- 8.1. Market Analysis, Insights and Forecast - by Foodservice Type
- 8.1.1. Cafes & Bars
- 8.1.1.1. By Cuisine
- 8.1.1.1.1. Bars & Pubs
- 8.1.1.1.2. Juice/Smoothie/Desserts Bars
- 8.1.1.1.3. Specialist Coffee & Tea Shops
- 8.1.1.1. By Cuisine
- 8.1.2. Cloud Kitchen
- 8.1.3. Full Service Restaurants
- 8.1.3.1. Asian
- 8.1.3.2. European
- 8.1.3.3. Latin American
- 8.1.3.4. Middle Eastern
- 8.1.3.5. North American
- 8.1.3.6. Other FSR Cuisines
- 8.1.4. Quick Service Restaurants
- 8.1.4.1. Bakeries
- 8.1.4.2. Burger
- 8.1.4.3. Ice Cream
- 8.1.4.4. Meat-based Cuisines
- 8.1.4.5. Pizza
- 8.1.4.6. Other QSR Cuisines
- 8.1.1. Cafes & Bars
- 8.2. Market Analysis, Insights and Forecast - by Outlet
- 8.2.1. Chained Outlets
- 8.2.2. Independent Outlets
- 8.3. Market Analysis, Insights and Forecast - by Location
- 8.3.1. Leisure
- 8.3.2. Lodging
- 8.3.3. Retail
- 8.3.4. Standalone
- 8.3.5. Travel
- 8.1. Market Analysis, Insights and Forecast - by Foodservice Type
- 9. Europe Food Service Industry in Japan Analysis, Insights and Forecast, 2020-2032
- 9.1. Market Analysis, Insights and Forecast - by Foodservice Type
- 9.1.1. Cafes & Bars
- 9.1.1.1. By Cuisine
- 9.1.1.1.1. Bars & Pubs
- 9.1.1.1.2. Juice/Smoothie/Desserts Bars
- 9.1.1.1.3. Specialist Coffee & Tea Shops
- 9.1.1.1. By Cuisine
- 9.1.2. Cloud Kitchen
- 9.1.3. Full Service Restaurants
- 9.1.3.1. Asian
- 9.1.3.2. European
- 9.1.3.3. Latin American
- 9.1.3.4. Middle Eastern
- 9.1.3.5. North American
- 9.1.3.6. Other FSR Cuisines
- 9.1.4. Quick Service Restaurants
- 9.1.4.1. Bakeries
- 9.1.4.2. Burger
- 9.1.4.3. Ice Cream
- 9.1.4.4. Meat-based Cuisines
- 9.1.4.5. Pizza
- 9.1.4.6. Other QSR Cuisines
- 9.1.1. Cafes & Bars
- 9.2. Market Analysis, Insights and Forecast - by Outlet
- 9.2.1. Chained Outlets
- 9.2.2. Independent Outlets
- 9.3. Market Analysis, Insights and Forecast - by Location
- 9.3.1. Leisure
- 9.3.2. Lodging
- 9.3.3. Retail
- 9.3.4. Standalone
- 9.3.5. Travel
- 9.1. Market Analysis, Insights and Forecast - by Foodservice Type
- 10. Middle East & Africa Food Service Industry in Japan Analysis, Insights and Forecast, 2020-2032
- 10.1. Market Analysis, Insights and Forecast - by Foodservice Type
- 10.1.1. Cafes & Bars
- 10.1.1.1. By Cuisine
- 10.1.1.1.1. Bars & Pubs
- 10.1.1.1.2. Juice/Smoothie/Desserts Bars
- 10.1.1.1.3. Specialist Coffee & Tea Shops
- 10.1.1.1. By Cuisine
- 10.1.2. Cloud Kitchen
- 10.1.3. Full Service Restaurants
- 10.1.3.1. Asian
- 10.1.3.2. European
- 10.1.3.3. Latin American
- 10.1.3.4. Middle Eastern
- 10.1.3.5. North American
- 10.1.3.6. Other FSR Cuisines
- 10.1.4. Quick Service Restaurants
- 10.1.4.1. Bakeries
- 10.1.4.2. Burger
- 10.1.4.3. Ice Cream
- 10.1.4.4. Meat-based Cuisines
- 10.1.4.5. Pizza
- 10.1.4.6. Other QSR Cuisines
- 10.1.1. Cafes & Bars
- 10.2. Market Analysis, Insights and Forecast - by Outlet
- 10.2.1. Chained Outlets
- 10.2.2. Independent Outlets
- 10.3. Market Analysis, Insights and Forecast - by Location
- 10.3.1. Leisure
- 10.3.2. Lodging
- 10.3.3. Retail
- 10.3.4. Standalone
- 10.3.5. Travel
- 10.1. Market Analysis, Insights and Forecast - by Foodservice Type
- 11. Asia Pacific Food Service Industry in Japan Analysis, Insights and Forecast, 2020-2032
- 11.1. Market Analysis, Insights and Forecast - by Foodservice Type
- 11.1.1. Cafes & Bars
- 11.1.1.1. By Cuisine
- 11.1.1.1.1. Bars & Pubs
- 11.1.1.1.2. Juice/Smoothie/Desserts Bars
- 11.1.1.1.3. Specialist Coffee & Tea Shops
- 11.1.1.1. By Cuisine
- 11.1.2. Cloud Kitchen
- 11.1.3. Full Service Restaurants
- 11.1.3.1. Asian
- 11.1.3.2. European
- 11.1.3.3. Latin American
- 11.1.3.4. Middle Eastern
- 11.1.3.5. North American
- 11.1.3.6. Other FSR Cuisines
- 11.1.4. Quick Service Restaurants
- 11.1.4.1. Bakeries
- 11.1.4.2. Burger
- 11.1.4.3. Ice Cream
- 11.1.4.4. Meat-based Cuisines
- 11.1.4.5. Pizza
- 11.1.4.6. Other QSR Cuisines
- 11.1.1. Cafes & Bars
- 11.2. Market Analysis, Insights and Forecast - by Outlet
- 11.2.1. Chained Outlets
- 11.2.2. Independent Outlets
- 11.3. Market Analysis, Insights and Forecast - by Location
- 11.3.1. Leisure
- 11.3.2. Lodging
- 11.3.3. Retail
- 11.3.4. Standalone
- 11.3.5. Travel
- 11.1. Market Analysis, Insights and Forecast - by Foodservice Type
- 12. Competitive Analysis
- 12.1. Company Profiles
- 12.1.1 MOS Food Services Inc
- 12.1.1.1. Company Overview
- 12.1.1.2. Products
- 12.1.1.3. Company Financials
- 12.1.1.4. SWOT Analysis
- 12.1.2 Yum! Brands Inc
- 12.1.2.1. Company Overview
- 12.1.2.2. Products
- 12.1.2.3. Company Financials
- 12.1.2.4. SWOT Analysis
- 12.1.3 Seven & I Holdings Co Ltd
- 12.1.3.1. Company Overview
- 12.1.3.2. Products
- 12.1.3.3. Company Financials
- 12.1.3.4. SWOT Analysis
- 12.1.4 Food & Life Companies
- 12.1.4.1. Company Overview
- 12.1.4.2. Products
- 12.1.4.3. Company Financials
- 12.1.4.4. SWOT Analysis
- 12.1.5 Plenus Company Limited
- 12.1.5.1. Company Overview
- 12.1.5.2. Products
- 12.1.5.3. Company Financials
- 12.1.5.4. SWOT Analysis
- 12.1.6 Kura Sushi Inc
- 12.1.6.1. Company Overview
- 12.1.6.2. Products
- 12.1.6.3. Company Financials
- 12.1.6.4. SWOT Analysis
- 12.1.7 Toridoll Holdings Corporation
- 12.1.7.1. Company Overview
- 12.1.7.2. Products
- 12.1.7.3. Company Financials
- 12.1.7.4. SWOT Analysis
- 12.1.8 Skylark Holdings Co Ltd
- 12.1.8.1. Company Overview
- 12.1.8.2. Products
- 12.1.8.3. Company Financials
- 12.1.8.4. SWOT Analysis
- 12.1.9 Lotteria Co Ltd
- 12.1.9.1. Company Overview
- 12.1.9.2. Products
- 12.1.9.3. Company Financials
- 12.1.9.4. SWOT Analysis
- 12.1.10 Komeda Holdings Co Ltd
- 12.1.10.1. Company Overview
- 12.1.10.2. Products
- 12.1.10.3. Company Financials
- 12.1.10.4. SWOT Analysis
- 12.1.11 Domino’s Pizza Enterprises Ltd
- 12.1.11.1. Company Overview
- 12.1.11.2. Products
- 12.1.11.3. Company Financials
- 12.1.11.4. SWOT Analysis
- 12.1.12 Starbucks Corporation
- 12.1.12.1. Company Overview
- 12.1.12.2. Products
- 12.1.12.3. Company Financials
- 12.1.12.4. SWOT Analysis
- 12.1.13 Colowide Co Ltd
- 12.1.13.1. Company Overview
- 12.1.13.2. Products
- 12.1.13.3. Company Financials
- 12.1.13.4. SWOT Analysis
- 12.1.14 Yoshinoya Holdings Co Ltd
- 12.1.14.1. Company Overview
- 12.1.14.2. Products
- 12.1.14.3. Company Financials
- 12.1.14.4. SWOT Analysis
- 12.1.15 McDonald's Corporation
- 12.1.15.1. Company Overview
- 12.1.15.2. Products
- 12.1.15.3. Company Financials
- 12.1.15.4. SWOT Analysis
- 12.1.16 Zensho Holding
- 12.1.16.1. Company Overview
- 12.1.16.2. Products
- 12.1.16.3. Company Financials
- 12.1.16.4. SWOT Analysis
- 12.1.1 MOS Food Services Inc
- 12.2. Market Entropy
- 12.2.1 Company's Key Areas Served
- 12.2.2 Recent Developments
- 12.3. Company Market Share Analysis 2025
- 12.3.1 Top 5 Companies Market Share Analysis
- 12.3.2 Top 3 Companies Market Share Analysis
- 12.4. List of Potential Customers
- 13. Research Methodology
List of Figures
- Figure 1: Global Food Service Industry in Japan Revenue Breakdown (billion, %) by Region 2025 & 2033
- Figure 2: North America Food Service Industry in Japan Revenue (billion), by Foodservice Type 2025 & 2033
- Figure 3: North America Food Service Industry in Japan Revenue Share (%), by Foodservice Type 2025 & 2033
- Figure 4: North America Food Service Industry in Japan Revenue (billion), by Outlet 2025 & 2033
- Figure 5: North America Food Service Industry in Japan Revenue Share (%), by Outlet 2025 & 2033
- Figure 6: North America Food Service Industry in Japan Revenue (billion), by Location 2025 & 2033
- Figure 7: North America Food Service Industry in Japan Revenue Share (%), by Location 2025 & 2033
- Figure 8: North America Food Service Industry in Japan Revenue (billion), by Country 2025 & 2033
- Figure 9: North America Food Service Industry in Japan Revenue Share (%), by Country 2025 & 2033
- Figure 10: South America Food Service Industry in Japan Revenue (billion), by Foodservice Type 2025 & 2033
- Figure 11: South America Food Service Industry in Japan Revenue Share (%), by Foodservice Type 2025 & 2033
- Figure 12: South America Food Service Industry in Japan Revenue (billion), by Outlet 2025 & 2033
- Figure 13: South America Food Service Industry in Japan Revenue Share (%), by Outlet 2025 & 2033
- Figure 14: South America Food Service Industry in Japan Revenue (billion), by Location 2025 & 2033
- Figure 15: South America Food Service Industry in Japan Revenue Share (%), by Location 2025 & 2033
- Figure 16: South America Food Service Industry in Japan Revenue (billion), by Country 2025 & 2033
- Figure 17: South America Food Service Industry in Japan Revenue Share (%), by Country 2025 & 2033
- Figure 18: Europe Food Service Industry in Japan Revenue (billion), by Foodservice Type 2025 & 2033
- Figure 19: Europe Food Service Industry in Japan Revenue Share (%), by Foodservice Type 2025 & 2033
- Figure 20: Europe Food Service Industry in Japan Revenue (billion), by Outlet 2025 & 2033
- Figure 21: Europe Food Service Industry in Japan Revenue Share (%), by Outlet 2025 & 2033
- Figure 22: Europe Food Service Industry in Japan Revenue (billion), by Location 2025 & 2033
- Figure 23: Europe Food Service Industry in Japan Revenue Share (%), by Location 2025 & 2033
- Figure 24: Europe Food Service Industry in Japan Revenue (billion), by Country 2025 & 2033
- Figure 25: Europe Food Service Industry in Japan Revenue Share (%), by Country 2025 & 2033
- Figure 26: Middle East & Africa Food Service Industry in Japan Revenue (billion), by Foodservice Type 2025 & 2033
- Figure 27: Middle East & Africa Food Service Industry in Japan Revenue Share (%), by Foodservice Type 2025 & 2033
- Figure 28: Middle East & Africa Food Service Industry in Japan Revenue (billion), by Outlet 2025 & 2033
- Figure 29: Middle East & Africa Food Service Industry in Japan Revenue Share (%), by Outlet 2025 & 2033
- Figure 30: Middle East & Africa Food Service Industry in Japan Revenue (billion), by Location 2025 & 2033
- Figure 31: Middle East & Africa Food Service Industry in Japan Revenue Share (%), by Location 2025 & 2033
- Figure 32: Middle East & Africa Food Service Industry in Japan Revenue (billion), by Country 2025 & 2033
- Figure 33: Middle East & Africa Food Service Industry in Japan Revenue Share (%), by Country 2025 & 2033
- Figure 34: Asia Pacific Food Service Industry in Japan Revenue (billion), by Foodservice Type 2025 & 2033
- Figure 35: Asia Pacific Food Service Industry in Japan Revenue Share (%), by Foodservice Type 2025 & 2033
- Figure 36: Asia Pacific Food Service Industry in Japan Revenue (billion), by Outlet 2025 & 2033
- Figure 37: Asia Pacific Food Service Industry in Japan Revenue Share (%), by Outlet 2025 & 2033
- Figure 38: Asia Pacific Food Service Industry in Japan Revenue (billion), by Location 2025 & 2033
- Figure 39: Asia Pacific Food Service Industry in Japan Revenue Share (%), by Location 2025 & 2033
- Figure 40: Asia Pacific Food Service Industry in Japan Revenue (billion), by Country 2025 & 2033
- Figure 41: Asia Pacific Food Service Industry in Japan Revenue Share (%), by Country 2025 & 2033
List of Tables
- Table 1: Global Food Service Industry in Japan Revenue billion Forecast, by Foodservice Type 2020 & 2033
- Table 2: Global Food Service Industry in Japan Revenue billion Forecast, by Outlet 2020 & 2033
- Table 3: Global Food Service Industry in Japan Revenue billion Forecast, by Location 2020 & 2033
- Table 4: Global Food Service Industry in Japan Revenue billion Forecast, by Region 2020 & 2033
- Table 5: Global Food Service Industry in Japan Revenue billion Forecast, by Foodservice Type 2020 & 2033
- Table 6: Global Food Service Industry in Japan Revenue billion Forecast, by Outlet 2020 & 2033
- Table 7: Global Food Service Industry in Japan Revenue billion Forecast, by Location 2020 & 2033
- Table 8: Global Food Service Industry in Japan Revenue billion Forecast, by Country 2020 & 2033
- Table 9: United States Food Service Industry in Japan Revenue (billion) Forecast, by Application 2020 & 2033
- Table 10: Canada Food Service Industry in Japan Revenue (billion) Forecast, by Application 2020 & 2033
- Table 11: Mexico Food Service Industry in Japan Revenue (billion) Forecast, by Application 2020 & 2033
- Table 12: Global Food Service Industry in Japan Revenue billion Forecast, by Foodservice Type 2020 & 2033
- Table 13: Global Food Service Industry in Japan Revenue billion Forecast, by Outlet 2020 & 2033
- Table 14: Global Food Service Industry in Japan Revenue billion Forecast, by Location 2020 & 2033
- Table 15: Global Food Service Industry in Japan Revenue billion Forecast, by Country 2020 & 2033
- Table 16: Brazil Food Service Industry in Japan Revenue (billion) Forecast, by Application 2020 & 2033
- Table 17: Argentina Food Service Industry in Japan Revenue (billion) Forecast, by Application 2020 & 2033
- Table 18: Rest of South America Food Service Industry in Japan Revenue (billion) Forecast, by Application 2020 & 2033
- Table 19: Global Food Service Industry in Japan Revenue billion Forecast, by Foodservice Type 2020 & 2033
- Table 20: Global Food Service Industry in Japan Revenue billion Forecast, by Outlet 2020 & 2033
- Table 21: Global Food Service Industry in Japan Revenue billion Forecast, by Location 2020 & 2033
- Table 22: Global Food Service Industry in Japan Revenue billion Forecast, by Country 2020 & 2033
- Table 23: United Kingdom Food Service Industry in Japan Revenue (billion) Forecast, by Application 2020 & 2033
- Table 24: Germany Food Service Industry in Japan Revenue (billion) Forecast, by Application 2020 & 2033
- Table 25: France Food Service Industry in Japan Revenue (billion) Forecast, by Application 2020 & 2033
- Table 26: Italy Food Service Industry in Japan Revenue (billion) Forecast, by Application 2020 & 2033
- Table 27: Spain Food Service Industry in Japan Revenue (billion) Forecast, by Application 2020 & 2033
- Table 28: Russia Food Service Industry in Japan Revenue (billion) Forecast, by Application 2020 & 2033
- Table 29: Benelux Food Service Industry in Japan Revenue (billion) Forecast, by Application 2020 & 2033
- Table 30: Nordics Food Service Industry in Japan Revenue (billion) Forecast, by Application 2020 & 2033
- Table 31: Rest of Europe Food Service Industry in Japan Revenue (billion) Forecast, by Application 2020 & 2033
- Table 32: Global Food Service Industry in Japan Revenue billion Forecast, by Foodservice Type 2020 & 2033
- Table 33: Global Food Service Industry in Japan Revenue billion Forecast, by Outlet 2020 & 2033
- Table 34: Global Food Service Industry in Japan Revenue billion Forecast, by Location 2020 & 2033
- Table 35: Global Food Service Industry in Japan Revenue billion Forecast, by Country 2020 & 2033
- Table 36: Turkey Food Service Industry in Japan Revenue (billion) Forecast, by Application 2020 & 2033
- Table 37: Israel Food Service Industry in Japan Revenue (billion) Forecast, by Application 2020 & 2033
- Table 38: GCC Food Service Industry in Japan Revenue (billion) Forecast, by Application 2020 & 2033
- Table 39: North Africa Food Service Industry in Japan Revenue (billion) Forecast, by Application 2020 & 2033
- Table 40: South Africa Food Service Industry in Japan Revenue (billion) Forecast, by Application 2020 & 2033
- Table 41: Rest of Middle East & Africa Food Service Industry in Japan Revenue (billion) Forecast, by Application 2020 & 2033
- Table 42: Global Food Service Industry in Japan Revenue billion Forecast, by Foodservice Type 2020 & 2033
- Table 43: Global Food Service Industry in Japan Revenue billion Forecast, by Outlet 2020 & 2033
- Table 44: Global Food Service Industry in Japan Revenue billion Forecast, by Location 2020 & 2033
- Table 45: Global Food Service Industry in Japan Revenue billion Forecast, by Country 2020 & 2033
- Table 46: China Food Service Industry in Japan Revenue (billion) Forecast, by Application 2020 & 2033
- Table 47: India Food Service Industry in Japan Revenue (billion) Forecast, by Application 2020 & 2033
- Table 48: Japan Food Service Industry in Japan Revenue (billion) Forecast, by Application 2020 & 2033
- Table 49: South Korea Food Service Industry in Japan Revenue (billion) Forecast, by Application 2020 & 2033
- Table 50: ASEAN Food Service Industry in Japan Revenue (billion) Forecast, by Application 2020 & 2033
- Table 51: Oceania Food Service Industry in Japan Revenue (billion) Forecast, by Application 2020 & 2033
- Table 52: Rest of Asia Pacific Food Service Industry in Japan Revenue (billion) Forecast, by Application 2020 & 2033
Frequently Asked Questions
1. What is the projected Compound Annual Growth Rate (CAGR) of the Food Service Industry in Japan?
The projected CAGR is approximately 12.7%.
2. Which companies are prominent players in the Food Service Industry in Japan?
Key companies in the market include MOS Food Services Inc, Yum! Brands Inc, Seven & I Holdings Co Ltd, Food & Life Companies, Plenus Company Limited, Kura Sushi Inc, Toridoll Holdings Corporation, Skylark Holdings Co Ltd, Lotteria Co Ltd, Komeda Holdings Co Ltd, Domino’s Pizza Enterprises Ltd, Starbucks Corporation, Colowide Co Ltd, Yoshinoya Holdings Co Ltd, McDonald's Corporation, Zensho Holding.
3. What are the main segments of the Food Service Industry in Japan?
The market segments include Foodservice Type, Outlet, Location.
4. Can you provide details about the market size?
The market size is estimated to be USD 256.5 billion as of 2022.
5. What are some drivers contributing to market growth?
Rising Health Consciousness among consumer.
6. What are the notable trends driving market growth?
Quick service restaurants held the major share in the market due to the constant launch of new products.
7. Are there any restraints impacting market growth?
High Cost of natural Ingredients.
8. Can you provide examples of recent developments in the market?
April 2023: McDonald's Corporation partnered with One Piece, a Japanese anime franchise, to launch a newer version of the burger, i.e., the Chicken Tatsuta Burger. The packaging has been themed with One Piece imagery.April 2023: KFC launched a range of hash brown burgers available nationwide, including Karihoku Hash Filet Burger, Karihoku Hash Filet BBQ Burger, and Karihoku Hash Filet Spicy Burger.April 2023: In Japan, Starbucks introduced a new type of coffee drink called Oleato™, consisting of arabica coffee and Partanna® extra virgin olive oil.
9. What pricing options are available for accessing the report?
Pricing options include single-user, multi-user, and enterprise licenses priced at USD 3800, USD 4500, and USD 5800 respectively.
10. Is the market size provided in terms of value or volume?
The market size is provided in terms of value, measured in billion.
11. Are there any specific market keywords associated with the report?
Yes, the market keyword associated with the report is "Food Service Industry in Japan," which aids in identifying and referencing the specific market segment covered.
12. How do I determine which pricing option suits my needs best?
The pricing options vary based on user requirements and access needs. Individual users may opt for single-user licenses, while businesses requiring broader access may choose multi-user or enterprise licenses for cost-effective access to the report.
13. Are there any additional resources or data provided in the Food Service Industry in Japan report?
While the report offers comprehensive insights, it's advisable to review the specific contents or supplementary materials provided to ascertain if additional resources or data are available.
14. How can I stay updated on further developments or reports in the Food Service Industry in Japan?
To stay informed about further developments, trends, and reports in the Food Service Industry in Japan, consider subscribing to industry newsletters, following relevant companies and organizations, or regularly checking reputable industry news sources and publications.
Methodology
Step 1 - Identification of Relevant Samples Size from Population Database


Step 2 - Approaches for Defining Global Market Size (Value, Volume* & Price*)

Note*: In applicable scenarios
Step 3 - Data Sources
Primary Research
- Web Analytics
- Survey Reports
- Research Institute
- Latest Research Reports
- Opinion Leaders
Secondary Research
- Annual Reports
- White Paper
- Latest Press Release
- Industry Association
- Paid Database
- Investor Presentations

Step 4 - Data Triangulation
Involves using different sources of information in order to increase the validity of a study
These sources are likely to be stakeholders in a program - participants, other researchers, program staff, other community members, and so on.
Then we put all data in single framework & apply various statistical tools to find out the dynamic on the market.
During the analysis stage, feedback from the stakeholder groups would be compared to determine areas of agreement as well as areas of divergence