

Key Insights
The Spanish energy bar market is projected to reach a market size of $6.27 billion by 2025, expanding at a robust CAGR of 16.34% through 2033. This growth is driven by heightened consumer emphasis on health and wellness, the demand for convenient nutritional solutions, and increased engagement in sports and fitness. Organic energy bars are gaining significant traction, reflecting a consumer preference for natural ingredients and perceived health benefits, creating opportunities for product innovation.
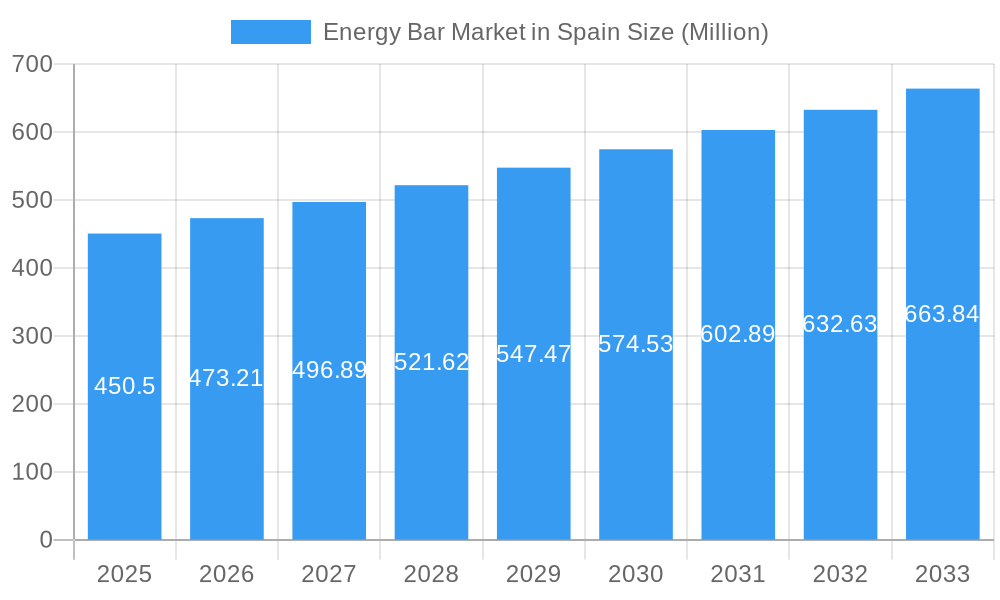
Energy Bar Market in Spain Market Size (In Billion)
Distribution channels are evolving, with online sales experiencing a notable surge alongside traditional supermarket and hypermarket presence. Specialist retailers are also crucial for catering to niche fitness and health segments. Key market restraints include raw material price volatility, intense competition, and the necessity for ongoing product innovation to sustain consumer engagement.
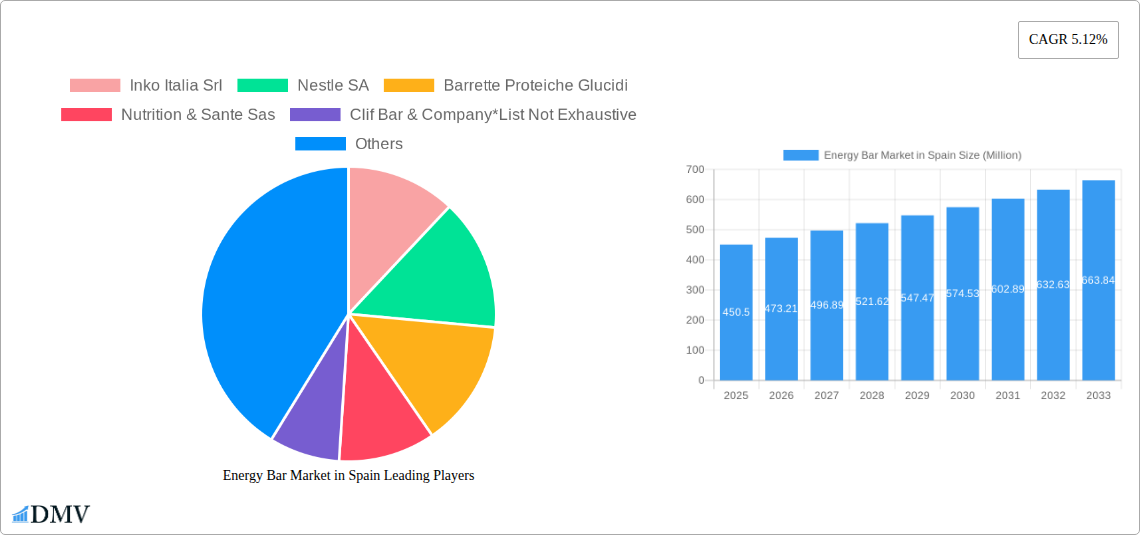
Energy Bar Market in Spain Company Market Share
Unlocking the Spanish Energy Bar Market: A Comprehensive Growth & Innovation Report
This in-depth report provides an authoritative analysis of the Energy Bar Market in Spain, meticulously examining market dynamics, competitive landscapes, and future growth trajectories from 2019 to 2033. We delve into the intricate composition, evolving trends, and key drivers shaping this vibrant sector, offering actionable insights for stakeholders seeking to capitalize on emerging opportunities. With a base year of 2025 and a forecast period extending to 2033, this study is an indispensable resource for understanding the strategic landscape of Spain's energy bar industry.
Energy Bar Market in Spain Market Composition & Trends
The Spanish energy bar market exhibits a moderate to high level of concentration, with key players like Nestlé SA, Abbott, and Enervit holding significant market share. The market is characterized by continuous innovation, driven by evolving consumer preferences for healthier, more functional, and sustainably sourced products. Regulatory landscapes, while generally supportive of food and beverage industries, present specific requirements for labeling and ingredient claims that companies must navigate. Substitute products, including energy drinks, gels, and other portable snack options, pose a consistent competitive threat, necessitating product differentiation. End-user profiles are diverse, ranging from athletes and fitness enthusiasts to busy professionals and individuals seeking convenient, on-the-go nutrition. Mergers and acquisitions (M&A) activity has been present, though often focused on smaller, specialized brands or ingredient suppliers to enhance product portfolios and market reach. Expected M&A deal values are in the range of 5 Million to 15 Million as niche players are acquired for their innovative offerings or loyal customer bases.
- Market Share Distribution (Estimated):
- Nestlé SA: XX%
- Abbott: XX%
- Enervit: XX%
- Other Key Players: XX%
- Innovation Catalysts:
- Demand for natural and organic ingredients.
- Increased focus on functional benefits (e.g., protein, electrolytes, adaptogens).
- Sustainable sourcing and packaging initiatives.
- Regulatory Landscape:
- EU food safety regulations.
- Spanish labeling requirements.
- Health claims substantiation.
- Substitute Products:
- Energy drinks.
- Sports gels.
- Fruits and nuts.
- Other convenience snacks.
Energy Bar Market in Spain Industry Evolution
The energy bar market in Spain has witnessed a dynamic evolution, marked by consistent growth and a strategic shift towards healthier and more specialized offerings. Over the historical period (2019-2024), the market experienced an average annual growth rate of approximately 6.5%, fueled by a growing health-conscious population and an increasing participation in sports and fitness activities. Technological advancements in food processing and ingredient formulation have enabled manufacturers to create a wider array of products catering to specific dietary needs and performance goals. The base year, 2025, sees the market valued at an estimated 500 Million, with a projected compound annual growth rate (CAGR) of 7.2% during the forecast period (2025-2033). This upward trajectory is underpinned by evolving consumer demands for transparency in ingredients, functional benefits beyond basic energy replenishment, and sustainable production practices. The adoption of online retail channels has significantly accelerated, allowing for broader market reach and personalized consumer engagement. Furthermore, the integration of novel ingredients such as plant-based proteins, adaptogens, and prebiotics is becoming a hallmark of product development, aligning with a holistic approach to wellness. The industry's ability to adapt to these shifting preferences, coupled with a robust distribution network and increasing disposable incomes, positions the Spanish energy bar sector for sustained expansion and innovation.
Leading Regions, Countries, or Segments in Energy Bar Market in Spain
Within the Energy Bar Market in Spain, the Organic segment is demonstrating particularly robust growth, driven by a discerning consumer base that prioritizes health, environmental sustainability, and transparent ingredient sourcing. While Conventional energy bars continue to hold a significant market share, the premium placed on natural and certified organic products is translating into higher sales volumes and increased product development within this niche. This trend is further amplified by evolving consumer awareness regarding the potential impact of pesticides and artificial additives on health and well-being.
Supermarkets/Hypermarkets remain the dominant distribution channel, offering convenience and a wide product selection to a broad demographic. However, the influence of Online Retail is rapidly expanding, providing direct-to-consumer access, personalized marketing opportunities, and a platform for smaller, specialized brands to reach their target audience. Specialist retailers, particularly those focusing on sports nutrition and health foods, also play a crucial role in catering to dedicated consumer segments.
- Dominant Segment by Type:
- Organic: Growing at an estimated CAGR of 8.5% from 2025-2033, reflecting increasing consumer preference for natural and sustainable options.
- Conventional: Expected to grow at a CAGR of 6.0%, maintaining a strong presence due to wider availability and price accessibility.
- Dominant Distribution Channel:
- Supermarkets/Hypermarkets: Account for an estimated 45% of market share in 2025, benefiting from high foot traffic and established brand presence.
- Online Retail: Projected to witness the fastest growth, with an estimated CAGR of 12% from 2025-2033, driven by convenience and the expansion of e-commerce platforms.
- Key Drivers for Organic Segment Dominance:
- Investment Trends: Increased investment by major players in developing organic product lines and sourcing certified ingredients.
- Regulatory Support: Favorable regulations and certifications for organic products enhance consumer trust.
- Consumer Demand: Growing awareness and willingness to pay a premium for health and sustainability.
- Factors Contributing to Online Retail Growth:
- Technological Advancements: Enhanced user experience on e-commerce platforms and improved logistics.
- Consumer Behavior: Shift towards online shopping for groceries and specialized food items.
- Targeted Marketing: Ability for brands to engage directly with specific consumer segments.
Energy Bar Market in Spain Product Innovations
Product innovation in the Spanish energy bar market is a continuous cycle, focusing on enhanced nutritional profiles, diverse flavors, and convenient formats. Companies are increasingly developing bars with specific functional benefits, such as sustained energy release, muscle recovery support, or cognitive enhancement, often incorporating ingredients like MCT oils, adaptogens, and specialized protein blends. The rise of plant-based and allergen-free options, including gluten-free and dairy-free formulations, is a significant trend, catering to a wider range of dietary requirements and preferences. Unique selling propositions often revolve around natural ingredient sourcing, low sugar content, and the absence of artificial additives. Technological advancements in processing allow for improved texture, shelf life, and ingredient dispersion, ensuring a superior consumer experience. The application of these innovations is broad, from performance-oriented bars for athletes to convenient and healthy snacks for everyday consumption, driving market growth and consumer engagement.
Propelling Factors for Energy Bar Market in Spain Growth
Several key factors are propelling the growth of the Energy Bar Market in Spain. A significant driver is the increasing health consciousness among the Spanish population, leading to a greater demand for convenient and nutritious snack options. The rising popularity of sports and fitness activities further fuels the need for performance-enhancing and recovery-focused energy bars. Technological advancements in food formulation and ingredient innovation allow for the creation of specialized bars catering to diverse dietary needs and preferences. Additionally, favorable economic conditions, including rising disposable incomes, enable consumers to invest in premium and functional food products. The expansion of online retail channels also plays a crucial role, improving accessibility and convenience for consumers across the country.
Obstacles in the Energy Bar Market in Spain Market
Despite robust growth, the Energy Bar Market in Spain faces certain obstacles. Intense competition from a multitude of brands, both established and emerging, can lead to price pressures and challenges in market differentiation. Regulatory hurdles related to health claims and ingredient labeling require careful navigation by manufacturers. Supply chain disruptions, particularly those impacting the availability and cost of specialized ingredients, can affect production and profitability. Furthermore, consumer perception can be a barrier, with some still viewing energy bars as primarily for athletes rather than a mainstream healthy snack. Economic downturns or shifts in consumer spending habits could also temper demand for premium products.
Future Opportunities in Energy Bar Market in Spain
The Energy Bar Market in Spain presents exciting future opportunities. The burgeoning demand for plant-based and vegan energy bars offers a significant avenue for growth. Innovations in functional ingredients, such as probiotics, prebiotics, and adaptogens, catering to overall wellness beyond just physical energy, will attract a broader consumer base. The increasing focus on sustainability, from ingredient sourcing to packaging, presents an opportunity for brands to build loyalty and differentiate themselves. Expanding into niche markets, such as bars tailored for specific age groups or dietary conditions, can unlock new revenue streams. Further development of personalized nutrition through online platforms and subscription models also holds considerable promise.
Major Players in the Energy Bar Market in Spain Ecosystem
- Inko Italia Srl
- Nestle SA
- Barrette Proteiche Glucidi
- Nutrition & Sante Sas
- Clif Bar & Company
- Enervit
- Abbott
Key Developments in Energy Bar Market in Spain Industry
- 2023/05: Launch of a new line of organic, plant-based energy bars by a leading Spanish manufacturer, catering to the growing vegan and health-conscious consumer segment.
- 2023/10: Nestlé SA announces strategic investment in a Spanish clean-label ingredient supplier to enhance its portfolio of natural and functional energy bars.
- 2024/02: Enervit introduces innovative energy bars formulated with adaptogens for enhanced mental focus and stress management, targeting busy professionals.
- 2024/07: Abbott expands its sports nutrition range with a new series of high-protein energy bars designed for post-workout recovery, further solidifying its presence in the performance segment.
Strategic Energy Bar Market in Spain Market Forecast
The strategic forecast for the Energy Bar Market in Spain is exceptionally positive, driven by a confluence of evolving consumer health consciousness, an expanding sports and fitness culture, and continuous product innovation. The anticipated growth is further bolstered by the increasing adoption of online retail channels, enhancing accessibility and facilitating personalized consumer engagement. As manufacturers continue to prioritize natural ingredients, functional benefits, and sustainable practices, the market is poised for sustained expansion. Emerging opportunities in plant-based alternatives and specialized functional ingredients will broaden appeal, solidifying the energy bar's position as a staple in the Spanish diet for wellness and performance. The market is projected to reach an estimated 1 Billion by 2033.
Energy Bar Market in Spain Segmentation
-
1. Type
- 1.1. Organic
- 1.2. Conventional
-
2. Distribution Channel
- 2.1. Supermarkets/Hypermarkets
- 2.2. Convenience Stores
- 2.3. Specialist Retailers
- 2.4. Online Retail
- 2.5. Other Distribution Channels
Energy Bar Market in Spain Segmentation By Geography
-
1. North America
- 1.1. United States
- 1.2. Canada
- 1.3. Mexico
-
2. South America
- 2.1. Brazil
- 2.2. Argentina
- 2.3. Rest of South America
-
3. Europe
- 3.1. United Kingdom
- 3.2. Germany
- 3.3. France
- 3.4. Italy
- 3.5. Spain
- 3.6. Russia
- 3.7. Benelux
- 3.8. Nordics
- 3.9. Rest of Europe
-
4. Middle East & Africa
- 4.1. Turkey
- 4.2. Israel
- 4.3. GCC
- 4.4. North Africa
- 4.5. South Africa
- 4.6. Rest of Middle East & Africa
-
5. Asia Pacific
- 5.1. China
- 5.2. India
- 5.3. Japan
- 5.4. South Korea
- 5.5. ASEAN
- 5.6. Oceania
- 5.7. Rest of Asia Pacific
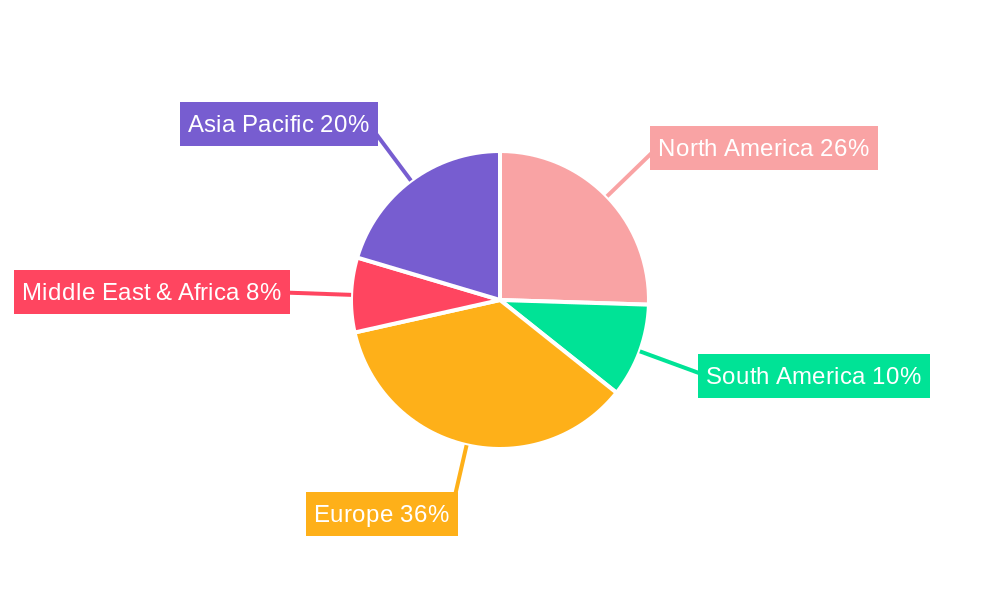
Energy Bar Market in Spain Regional Market Share
Geographic Coverage of Energy Bar Market in Spain
Energy Bar Market in Spain REPORT HIGHLIGHTS
| Aspects | Details |
|---|---|
| Study Period | 2020-2034 |
| Base Year | 2025 |
| Estimated Year | 2026 |
| Forecast Period | 2026-2034 |
| Historical Period | 2020-2025 |
| Growth Rate | CAGR of 16.34% from 2020-2034 |
| Segmentation |
|
Table of Contents
- 1. Introduction
- 1.1. Research Scope
- 1.2. Market Segmentation
- 1.3. Research Objective
- 1.4. Definitions and Assumptions
- 2. Executive Summary
- 2.1. Market Snapshot
- 3. Market Dynamics
- 3.1. Market Drivers
- 3.2. Market Restrains
- 3.3. Market Trends
- 3.4. Market Opportunities
- 4. Market Factor Analysis
- 4.1. Porters Five Forces
- 4.1.1. Bargaining Power of Suppliers
- 4.1.2. Bargaining Power of Buyers
- 4.1.3. Threat of New Entrants
- 4.1.4. Threat of Substitutes
- 4.1.5. Competitive Rivalry
- 4.2. PESTEL analysis
- 4.3. BCG Analysis
- 4.3.1. Stars (High Growth, High Market Share)
- 4.3.2. Cash Cows (Low Growth, High Market Share)
- 4.3.3. Question Mark (High Growth, Low Market Share)
- 4.3.4. Dogs (Low Growth, Low Market Share)
- 4.4. Ansoff Matrix Analysis
- 4.5. Supply Chain Analysis
- 4.6. Regulatory Landscape
- 4.7. Current Market Potential and Opportunity Assessment (TAM–SAM–SOM Framework)
- 4.8. DMV Analyst Note
- 4.1. Porters Five Forces
- 5. Market Analysis, Insights and Forecast 2021-2033
- 5.1. Market Analysis, Insights and Forecast - by Type
- 5.1.1. Organic
- 5.1.2. Conventional
- 5.2. Market Analysis, Insights and Forecast - by Distribution Channel
- 5.2.1. Supermarkets/Hypermarkets
- 5.2.2. Convenience Stores
- 5.2.3. Specialist Retailers
- 5.2.4. Online Retail
- 5.2.5. Other Distribution Channels
- 5.3. Market Analysis, Insights and Forecast - by Region
- 5.3.1. North America
- 5.3.2. South America
- 5.3.3. Europe
- 5.3.4. Middle East & Africa
- 5.3.5. Asia Pacific
- 5.1. Market Analysis, Insights and Forecast - by Type
- 6. Global Energy Bar Market in Spain Analysis, Insights and Forecast, 2021-2033
- 6.1. Market Analysis, Insights and Forecast - by Type
- 6.1.1. Organic
- 6.1.2. Conventional
- 6.2. Market Analysis, Insights and Forecast - by Distribution Channel
- 6.2.1. Supermarkets/Hypermarkets
- 6.2.2. Convenience Stores
- 6.2.3. Specialist Retailers
- 6.2.4. Online Retail
- 6.2.5. Other Distribution Channels
- 6.1. Market Analysis, Insights and Forecast - by Type
- 7. North America Energy Bar Market in Spain Analysis, Insights and Forecast, 2020-2032
- 7.1. Market Analysis, Insights and Forecast - by Type
- 7.1.1. Organic
- 7.1.2. Conventional
- 7.2. Market Analysis, Insights and Forecast - by Distribution Channel
- 7.2.1. Supermarkets/Hypermarkets
- 7.2.2. Convenience Stores
- 7.2.3. Specialist Retailers
- 7.2.4. Online Retail
- 7.2.5. Other Distribution Channels
- 7.1. Market Analysis, Insights and Forecast - by Type
- 8. South America Energy Bar Market in Spain Analysis, Insights and Forecast, 2020-2032
- 8.1. Market Analysis, Insights and Forecast - by Type
- 8.1.1. Organic
- 8.1.2. Conventional
- 8.2. Market Analysis, Insights and Forecast - by Distribution Channel
- 8.2.1. Supermarkets/Hypermarkets
- 8.2.2. Convenience Stores
- 8.2.3. Specialist Retailers
- 8.2.4. Online Retail
- 8.2.5. Other Distribution Channels
- 8.1. Market Analysis, Insights and Forecast - by Type
- 9. Europe Energy Bar Market in Spain Analysis, Insights and Forecast, 2020-2032
- 9.1. Market Analysis, Insights and Forecast - by Type
- 9.1.1. Organic
- 9.1.2. Conventional
- 9.2. Market Analysis, Insights and Forecast - by Distribution Channel
- 9.2.1. Supermarkets/Hypermarkets
- 9.2.2. Convenience Stores
- 9.2.3. Specialist Retailers
- 9.2.4. Online Retail
- 9.2.5. Other Distribution Channels
- 9.1. Market Analysis, Insights and Forecast - by Type
- 10. Middle East & Africa Energy Bar Market in Spain Analysis, Insights and Forecast, 2020-2032
- 10.1. Market Analysis, Insights and Forecast - by Type
- 10.1.1. Organic
- 10.1.2. Conventional
- 10.2. Market Analysis, Insights and Forecast - by Distribution Channel
- 10.2.1. Supermarkets/Hypermarkets
- 10.2.2. Convenience Stores
- 10.2.3. Specialist Retailers
- 10.2.4. Online Retail
- 10.2.5. Other Distribution Channels
- 10.1. Market Analysis, Insights and Forecast - by Type
- 11. Asia Pacific Energy Bar Market in Spain Analysis, Insights and Forecast, 2020-2032
- 11.1. Market Analysis, Insights and Forecast - by Type
- 11.1.1. Organic
- 11.1.2. Conventional
- 11.2. Market Analysis, Insights and Forecast - by Distribution Channel
- 11.2.1. Supermarkets/Hypermarkets
- 11.2.2. Convenience Stores
- 11.2.3. Specialist Retailers
- 11.2.4. Online Retail
- 11.2.5. Other Distribution Channels
- 11.1. Market Analysis, Insights and Forecast - by Type
- 12. Competitive Analysis
- 12.1. Company Profiles
- 12.1.1 Inko Italia Srl
- 12.1.1.1. Company Overview
- 12.1.1.2. Products
- 12.1.1.3. Company Financials
- 12.1.1.4. SWOT Analysis
- 12.1.2 Nestle SA
- 12.1.2.1. Company Overview
- 12.1.2.2. Products
- 12.1.2.3. Company Financials
- 12.1.2.4. SWOT Analysis
- 12.1.3 Barrette Proteiche Glucidi
- 12.1.3.1. Company Overview
- 12.1.3.2. Products
- 12.1.3.3. Company Financials
- 12.1.3.4. SWOT Analysis
- 12.1.4 Nutrition & Sante Sas
- 12.1.4.1. Company Overview
- 12.1.4.2. Products
- 12.1.4.3. Company Financials
- 12.1.4.4. SWOT Analysis
- 12.1.5 Clif Bar & Company*List Not Exhaustive
- 12.1.5.1. Company Overview
- 12.1.5.2. Products
- 12.1.5.3. Company Financials
- 12.1.5.4. SWOT Analysis
- 12.1.6 Enervit
- 12.1.6.1. Company Overview
- 12.1.6.2. Products
- 12.1.6.3. Company Financials
- 12.1.6.4. SWOT Analysis
- 12.1.7 Abbott
- 12.1.7.1. Company Overview
- 12.1.7.2. Products
- 12.1.7.3. Company Financials
- 12.1.7.4. SWOT Analysis
- 12.1.1 Inko Italia Srl
- 12.2. Market Entropy
- 12.2.1 Company's Key Areas Served
- 12.2.2 Recent Developments
- 12.3. Company Market Share Analysis 2025
- 12.3.1 Top 5 Companies Market Share Analysis
- 12.3.2 Top 3 Companies Market Share Analysis
- 12.4. List of Potential Customers
- 13. Research Methodology
List of Figures
- Figure 1: Global Energy Bar Market in Spain Revenue Breakdown (billion, %) by Region 2025 & 2033
- Figure 2: North America Energy Bar Market in Spain Revenue (billion), by Type 2025 & 2033
- Figure 3: North America Energy Bar Market in Spain Revenue Share (%), by Type 2025 & 2033
- Figure 4: North America Energy Bar Market in Spain Revenue (billion), by Distribution Channel 2025 & 2033
- Figure 5: North America Energy Bar Market in Spain Revenue Share (%), by Distribution Channel 2025 & 2033
- Figure 6: North America Energy Bar Market in Spain Revenue (billion), by Country 2025 & 2033
- Figure 7: North America Energy Bar Market in Spain Revenue Share (%), by Country 2025 & 2033
- Figure 8: South America Energy Bar Market in Spain Revenue (billion), by Type 2025 & 2033
- Figure 9: South America Energy Bar Market in Spain Revenue Share (%), by Type 2025 & 2033
- Figure 10: South America Energy Bar Market in Spain Revenue (billion), by Distribution Channel 2025 & 2033
- Figure 11: South America Energy Bar Market in Spain Revenue Share (%), by Distribution Channel 2025 & 2033
- Figure 12: South America Energy Bar Market in Spain Revenue (billion), by Country 2025 & 2033
- Figure 13: South America Energy Bar Market in Spain Revenue Share (%), by Country 2025 & 2033
- Figure 14: Europe Energy Bar Market in Spain Revenue (billion), by Type 2025 & 2033
- Figure 15: Europe Energy Bar Market in Spain Revenue Share (%), by Type 2025 & 2033
- Figure 16: Europe Energy Bar Market in Spain Revenue (billion), by Distribution Channel 2025 & 2033
- Figure 17: Europe Energy Bar Market in Spain Revenue Share (%), by Distribution Channel 2025 & 2033
- Figure 18: Europe Energy Bar Market in Spain Revenue (billion), by Country 2025 & 2033
- Figure 19: Europe Energy Bar Market in Spain Revenue Share (%), by Country 2025 & 2033
- Figure 20: Middle East & Africa Energy Bar Market in Spain Revenue (billion), by Type 2025 & 2033
- Figure 21: Middle East & Africa Energy Bar Market in Spain Revenue Share (%), by Type 2025 & 2033
- Figure 22: Middle East & Africa Energy Bar Market in Spain Revenue (billion), by Distribution Channel 2025 & 2033
- Figure 23: Middle East & Africa Energy Bar Market in Spain Revenue Share (%), by Distribution Channel 2025 & 2033
- Figure 24: Middle East & Africa Energy Bar Market in Spain Revenue (billion), by Country 2025 & 2033
- Figure 25: Middle East & Africa Energy Bar Market in Spain Revenue Share (%), by Country 2025 & 2033
- Figure 26: Asia Pacific Energy Bar Market in Spain Revenue (billion), by Type 2025 & 2033
- Figure 27: Asia Pacific Energy Bar Market in Spain Revenue Share (%), by Type 2025 & 2033
- Figure 28: Asia Pacific Energy Bar Market in Spain Revenue (billion), by Distribution Channel 2025 & 2033
- Figure 29: Asia Pacific Energy Bar Market in Spain Revenue Share (%), by Distribution Channel 2025 & 2033
- Figure 30: Asia Pacific Energy Bar Market in Spain Revenue (billion), by Country 2025 & 2033
- Figure 31: Asia Pacific Energy Bar Market in Spain Revenue Share (%), by Country 2025 & 2033
List of Tables
- Table 1: Global Energy Bar Market in Spain Revenue billion Forecast, by Type 2020 & 2033
- Table 2: Global Energy Bar Market in Spain Revenue billion Forecast, by Distribution Channel 2020 & 2033
- Table 3: Global Energy Bar Market in Spain Revenue billion Forecast, by Region 2020 & 2033
- Table 4: Global Energy Bar Market in Spain Revenue billion Forecast, by Type 2020 & 2033
- Table 5: Global Energy Bar Market in Spain Revenue billion Forecast, by Distribution Channel 2020 & 2033
- Table 6: Global Energy Bar Market in Spain Revenue billion Forecast, by Country 2020 & 2033
- Table 7: United States Energy Bar Market in Spain Revenue (billion) Forecast, by Application 2020 & 2033
- Table 8: Canada Energy Bar Market in Spain Revenue (billion) Forecast, by Application 2020 & 2033
- Table 9: Mexico Energy Bar Market in Spain Revenue (billion) Forecast, by Application 2020 & 2033
- Table 10: Global Energy Bar Market in Spain Revenue billion Forecast, by Type 2020 & 2033
- Table 11: Global Energy Bar Market in Spain Revenue billion Forecast, by Distribution Channel 2020 & 2033
- Table 12: Global Energy Bar Market in Spain Revenue billion Forecast, by Country 2020 & 2033
- Table 13: Brazil Energy Bar Market in Spain Revenue (billion) Forecast, by Application 2020 & 2033
- Table 14: Argentina Energy Bar Market in Spain Revenue (billion) Forecast, by Application 2020 & 2033
- Table 15: Rest of South America Energy Bar Market in Spain Revenue (billion) Forecast, by Application 2020 & 2033
- Table 16: Global Energy Bar Market in Spain Revenue billion Forecast, by Type 2020 & 2033
- Table 17: Global Energy Bar Market in Spain Revenue billion Forecast, by Distribution Channel 2020 & 2033
- Table 18: Global Energy Bar Market in Spain Revenue billion Forecast, by Country 2020 & 2033
- Table 19: United Kingdom Energy Bar Market in Spain Revenue (billion) Forecast, by Application 2020 & 2033
- Table 20: Germany Energy Bar Market in Spain Revenue (billion) Forecast, by Application 2020 & 2033
- Table 21: France Energy Bar Market in Spain Revenue (billion) Forecast, by Application 2020 & 2033
- Table 22: Italy Energy Bar Market in Spain Revenue (billion) Forecast, by Application 2020 & 2033
- Table 23: Spain Energy Bar Market in Spain Revenue (billion) Forecast, by Application 2020 & 2033
- Table 24: Russia Energy Bar Market in Spain Revenue (billion) Forecast, by Application 2020 & 2033
- Table 25: Benelux Energy Bar Market in Spain Revenue (billion) Forecast, by Application 2020 & 2033
- Table 26: Nordics Energy Bar Market in Spain Revenue (billion) Forecast, by Application 2020 & 2033
- Table 27: Rest of Europe Energy Bar Market in Spain Revenue (billion) Forecast, by Application 2020 & 2033
- Table 28: Global Energy Bar Market in Spain Revenue billion Forecast, by Type 2020 & 2033
- Table 29: Global Energy Bar Market in Spain Revenue billion Forecast, by Distribution Channel 2020 & 2033
- Table 30: Global Energy Bar Market in Spain Revenue billion Forecast, by Country 2020 & 2033
- Table 31: Turkey Energy Bar Market in Spain Revenue (billion) Forecast, by Application 2020 & 2033
- Table 32: Israel Energy Bar Market in Spain Revenue (billion) Forecast, by Application 2020 & 2033
- Table 33: GCC Energy Bar Market in Spain Revenue (billion) Forecast, by Application 2020 & 2033
- Table 34: North Africa Energy Bar Market in Spain Revenue (billion) Forecast, by Application 2020 & 2033
- Table 35: South Africa Energy Bar Market in Spain Revenue (billion) Forecast, by Application 2020 & 2033
- Table 36: Rest of Middle East & Africa Energy Bar Market in Spain Revenue (billion) Forecast, by Application 2020 & 2033
- Table 37: Global Energy Bar Market in Spain Revenue billion Forecast, by Type 2020 & 2033
- Table 38: Global Energy Bar Market in Spain Revenue billion Forecast, by Distribution Channel 2020 & 2033
- Table 39: Global Energy Bar Market in Spain Revenue billion Forecast, by Country 2020 & 2033
- Table 40: China Energy Bar Market in Spain Revenue (billion) Forecast, by Application 2020 & 2033
- Table 41: India Energy Bar Market in Spain Revenue (billion) Forecast, by Application 2020 & 2033
- Table 42: Japan Energy Bar Market in Spain Revenue (billion) Forecast, by Application 2020 & 2033
- Table 43: South Korea Energy Bar Market in Spain Revenue (billion) Forecast, by Application 2020 & 2033
- Table 44: ASEAN Energy Bar Market in Spain Revenue (billion) Forecast, by Application 2020 & 2033
- Table 45: Oceania Energy Bar Market in Spain Revenue (billion) Forecast, by Application 2020 & 2033
- Table 46: Rest of Asia Pacific Energy Bar Market in Spain Revenue (billion) Forecast, by Application 2020 & 2033
Frequently Asked Questions
1. What is the projected Compound Annual Growth Rate (CAGR) of the Energy Bar Market in Spain?
The projected CAGR is approximately 16.34%.
2. Which companies are prominent players in the Energy Bar Market in Spain?
Key companies in the market include Inko Italia Srl, Nestle SA, Barrette Proteiche Glucidi, Nutrition & Sante Sas, Clif Bar & Company*List Not Exhaustive, Enervit, Abbott.
3. What are the main segments of the Energy Bar Market in Spain?
The market segments include Type, Distribution Channel.
4. Can you provide details about the market size?
The market size is estimated to be USD 6.27 billion as of 2022.
5. What are some drivers contributing to market growth?
Increasing Consumer Demand for Products with Low Environmental Impacts; Dedicated Policies and Government Efforts to Promote the use of Biotechnology.
6. What are the notable trends driving market growth?
Rising Healthy Snacking Trend.
7. Are there any restraints impacting market growth?
Deteriorating Fertility of Agricultural Lands.
8. Can you provide examples of recent developments in the market?
N/A
9. What pricing options are available for accessing the report?
Pricing options include single-user, multi-user, and enterprise licenses priced at USD 3800, USD 4500, and USD 5800 respectively.
10. Is the market size provided in terms of value or volume?
The market size is provided in terms of value, measured in billion.
11. Are there any specific market keywords associated with the report?
Yes, the market keyword associated with the report is "Energy Bar Market in Spain," which aids in identifying and referencing the specific market segment covered.
12. How do I determine which pricing option suits my needs best?
The pricing options vary based on user requirements and access needs. Individual users may opt for single-user licenses, while businesses requiring broader access may choose multi-user or enterprise licenses for cost-effective access to the report.
13. Are there any additional resources or data provided in the Energy Bar Market in Spain report?
While the report offers comprehensive insights, it's advisable to review the specific contents or supplementary materials provided to ascertain if additional resources or data are available.
14. How can I stay updated on further developments or reports in the Energy Bar Market in Spain?
To stay informed about further developments, trends, and reports in the Energy Bar Market in Spain, consider subscribing to industry newsletters, following relevant companies and organizations, or regularly checking reputable industry news sources and publications.
Methodology
Step 1 - Identification of Relevant Samples Size from Population Database


Step 2 - Approaches for Defining Global Market Size (Value, Volume* & Price*)

Note*: In applicable scenarios
Step 3 - Data Sources
Primary Research
- Web Analytics
- Survey Reports
- Research Institute
- Latest Research Reports
- Opinion Leaders
Secondary Research
- Annual Reports
- White Paper
- Latest Press Release
- Industry Association
- Paid Database
- Investor Presentations

Step 4 - Data Triangulation
Involves using different sources of information in order to increase the validity of a study
These sources are likely to be stakeholders in a program - participants, other researchers, program staff, other community members, and so on.
Then we put all data in single framework & apply various statistical tools to find out the dynamic on the market.
During the analysis stage, feedback from the stakeholder groups would be compared to determine areas of agreement as well as areas of divergence