

Key Insights
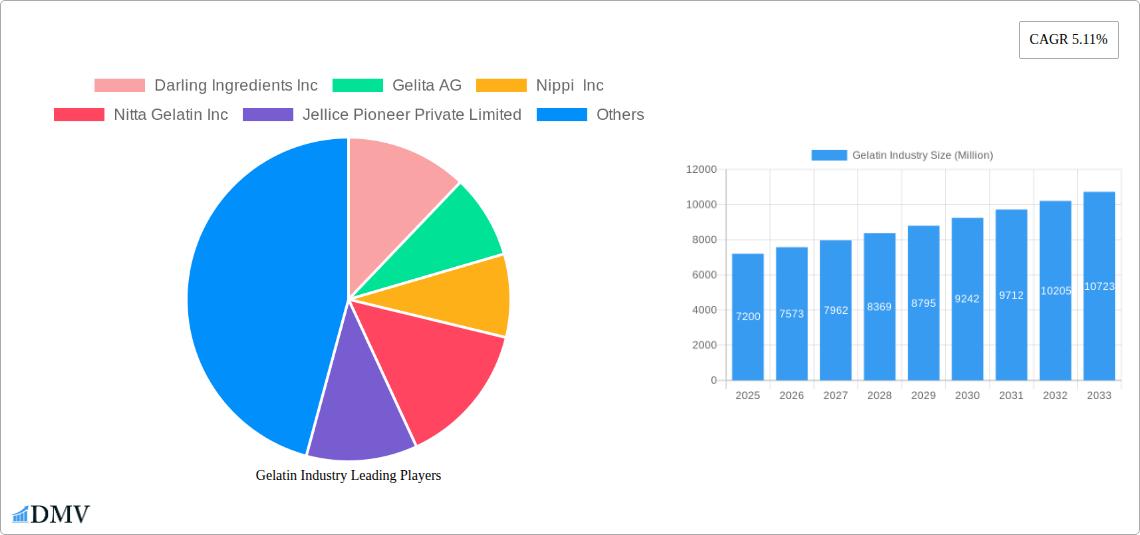
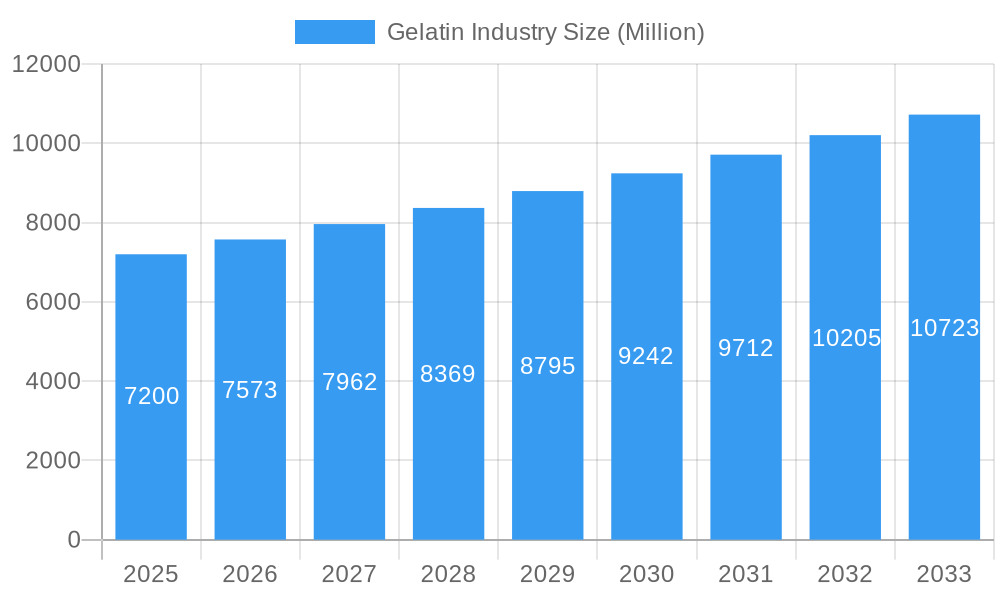
The global gelatin market is poised for robust expansion, projected to reach a significant market size of approximately $7,200 million by 2025, with a compelling Compound Annual Growth Rate (CAGR) of 5.11% through 2033. This growth is fundamentally driven by increasing consumer demand for protein-rich food and beverage products, coupled with the escalating use of gelatin as a functional ingredient in confectionery, bakery, and dairy items. The expanding health and wellness consciousness among consumers is also a key catalyst, leading to a higher adoption of gelatin in dietary supplements and fortified foods. Furthermore, the personal care and cosmetics sector continues to be a vital consumer, leveraging gelatin for its moisturizing and film-forming properties in a wide array of products. The market's dynamism is further fueled by innovations in processing technologies and the development of alternative gelatin sources, enhancing its versatility and appeal across diverse applications.
Gelatin Industry Market Size (In Billion)
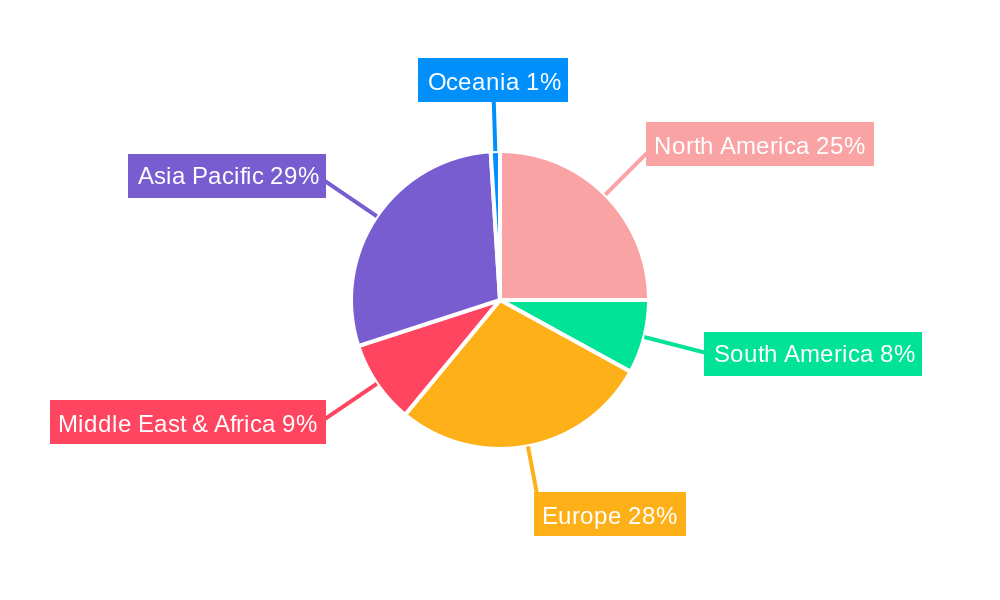
The market segmentation offers a nuanced view of its landscape. Animal-based gelatin, derived primarily from bovine and porcine sources, continues to dominate due to its established applications and cost-effectiveness. However, marine-based gelatin is gaining traction, driven by specific dietary preferences and religious considerations, particularly in regions with a high prevalence of seafood consumption. The food and beverages segment represents the largest end-user category, with sub-segments like bakery, confectionery, and dairy products showcasing significant growth potential. The personal care and cosmetics segment, though smaller, presents a steady demand. Geographically, the Asia Pacific region is emerging as a powerhouse, fueled by a burgeoning middle class, rising disposable incomes, and rapid industrialization, particularly in China and India. North America and Europe remain mature yet significant markets, characterized by a strong consumer preference for high-quality, functional food and cosmetic ingredients. Restraints such as fluctuating raw material prices and stringent regulatory frameworks for animal-derived products are being strategically addressed through technological advancements and the exploration of alternative sourcing.
Gelatin Industry Company Market Share
Gelatin Industry Market Composition & Trends
The global gelatin market is characterized by a moderate concentration, with leading players like Darling Ingredients Inc., Gelita AG, and Nitta Gelatin Inc. holding significant market share, estimated to be around 60% collectively. Innovation is a key driver, with ongoing research focused on enhancing gelatin's functional properties, developing plant-based alternatives, and improving extraction and purification processes. The regulatory landscape, particularly concerning food safety and pharmaceutical applications, plays a crucial role in market dynamics, influencing product development and market entry. While animal-based gelatin dominates, marine-based gelatin is emerging as a niche segment with growing potential. Substitute products, primarily hydrocolloids like pectin and carrageenan, pose a competitive threat, especially in the food industry, but gelatin's unique gelling, emulsifying, and stabilizing properties maintain its stronghold. End-user profiles reveal a strong demand from the food and beverage sector, particularly confectionery, dairy, and bakery, followed by pharmaceuticals and nutraceuticals. Mergers and acquisitions are strategic moves to enhance market presence and expand product portfolios, with recent M&A deals valued in the hundreds of millions of dollars. The market is projected to reach a valuation exceeding $9,000 million by 2033, indicating robust growth opportunities.
Gelatin Industry Industry Evolution
The gelatin industry has witnessed substantial evolution driven by a confluence of technological advancements, shifting consumer preferences, and expanding application areas. Over the historical period (2019-2024), the market demonstrated consistent growth, fueled by increasing demand from the food and beverage sector for its versatile functional properties such as gelling, thickening, and stabilizing. The pharmaceutical and nutraceutical industries have also been significant contributors, utilizing gelatin for capsules, drug delivery systems, and dietary supplements. The market's growth trajectory has been further amplified by innovations in extraction and processing technologies, leading to higher purity gelatin and the development of specialized grades for specific applications.
Technological advancements have been instrumental in shaping the industry. The development of advanced purification techniques has led to the production of highly refined gelatin for pharmaceutical and cosmetic applications, meeting stringent regulatory requirements. Furthermore, research into alternative gelatin sources, including fish and poultry, has broadened the market’s reach and addressed specific dietary needs. The adoption of Good Manufacturing Practices (GMP) and Hazard Analysis and Critical Control Points (HACCP) systems has become standard, ensuring product safety and quality.
Consumer demand has also played a pivotal role in the industry's evolution. A growing awareness of health and wellness has propelled the demand for gelatin in nutraceuticals and dietary supplements. Simultaneously, the "clean label" trend has favored natural ingredients, positioning gelatin favorably. Conversely, the increasing demand for vegetarian and vegan products has spurred research and development into plant-based alternatives, creating a competitive landscape but also pushing the industry to innovate. This dynamic interplay between supply-side innovations and demand-side shifts has sculpted the current state of the gelatin market, paving the way for future growth and diversification. The estimated market size is projected to reach $9,000 million by 2033.
Leading Regions, Countries, or Segments in Gelatin Industry
The Animal Based segment, primarily derived from bovine and porcine sources, unequivocally dominates the global gelatin market, accounting for an estimated 85% of the total market value. This segment's supremacy is driven by its established production infrastructure, cost-effectiveness, and extensive application history across various industries. Within the end-user segments, Food and Beverages remains the largest consumer of animal-based gelatin.
Food and Beverages Dominance:
- Confectionery: This sub-segment represents a significant portion of gelatin consumption due to its crucial role in creating the chewy texture of gummies, marshmallows, and other candies. The global confectionery market's steady growth, particularly in emerging economies, directly fuels gelatin demand.
- Dairy and Dairy Alternative Products: Gelatin acts as a stabilizer and texturizer in yogurts, desserts, and ice creams, enhancing their mouthfeel and shelf-life. The expanding dairy alternative market, driven by lactose intolerance and veganism, is also increasingly incorporating gelatin or its alternatives.
- Bakery: Used in fillings, glazes, and as a stabilizer in mousses and creams, bakery applications contribute substantially to gelatin consumption.
- Condiments/Sauces & RTE/RTC Food Products & Snacks: Gelatin finds utility in improving texture and stability in a variety of sauces, ready-to-eat/ready-to-cook meals, and certain snack products.
Pharmaceutical & Nutraceutical Significance: While smaller than food and beverages, the pharmaceutical and nutraceutical sectors are high-value markets for gelatin. The demand for hard and soft capsules, drug coatings, and dietary supplements continues to rise, propelled by an aging global population and increased health consciousness. Pharmaceutical-grade gelatin, with its stringent purity requirements, commands premium pricing.
Personal Care and Cosmetics: Gelatin is utilized in skincare products for its moisturizing and film-forming properties. While a smaller segment, it contributes to the overall market demand, particularly in premium cosmetic formulations.
The dominance of animal-based gelatin is further solidified by established supply chains and widespread acceptance. However, the Marine Based segment, primarily derived from fish sources, is an emerging area showing promising growth. Driven by religious dietary restrictions, allergies to bovine/porcine products, and increasing consumer interest in sustainable sourcing, marine-based gelatin is gaining traction, particularly in specific geographical regions and niche applications. Key drivers for the overall dominance of animal-based and the growth of marine-based gelatin include significant investment trends in R&D for enhanced functionality and novel applications, coupled with a favorable regulatory framework for its use in food and pharmaceuticals in major economies.
Gelatin Industry Product Innovations
Product innovations in the gelatin industry are primarily focused on enhancing functionality, expanding applications, and catering to evolving consumer demands. Rousselot, under Darling Ingredients Inc., has been at the forefront, launching X-Pure® GelDAT – Gelatin Desaminotyrosine, a purified, pharmaceutical-grade, and modified gelatin with unique properties for advanced applications. Furthermore, the introduction of SiMoGel brand's gummy caps by Rousselot offers a novel delivery format for nutraceutical and pharmaceutical ingredients, combining the benefits of capsules and gummies. Nitta Gelatin India’s introduction of an international-standard fine-grade gelatin under its HoReCa business, produced using Japanese technology and adhering to strict GMP and HACCP standards, highlights a focus on superior quality and specific market needs. These innovations aim to improve solubility, bioavailability, texture, and stability, thereby unlocking new market opportunities in specialized food formulations, advanced drug delivery systems, and enhanced personal care products.
Propelling Factors for Gelatin Industry Growth
Several key factors are propelling the growth of the gelatin industry. The increasing demand for gelatin in the pharmaceutical and nutraceutical sectors, driven by the global rise in health consciousness and the demand for dietary supplements and drug delivery systems, is a primary growth catalyst. Growing consumption of processed foods, particularly in emerging economies, where gelatin is used as a gelling agent, stabilizer, and emulsifier in confectionery, dairy products, and baked goods, also significantly contributes. Furthermore, technological advancements leading to improved production processes and the development of specialized gelatin grades for niche applications are expanding the market's scope. Finally, the increasing preference for natural and clean-label ingredients in food products further bolsters gelatin's position.
Obstacles in the Gelatin Industry Market
Despite its robust growth, the gelatin industry faces several obstacles. Fluctuations in the price and availability of raw materials, primarily animal by-products, can impact production costs and supply chain stability. Stringent regulatory requirements and varying food safety standards across different regions pose compliance challenges for manufacturers. The growing consumer preference for vegan and vegetarian diets has led to increased competition from plant-based alternatives like pectin and agar-agar, which can substitute gelatin in certain applications. Additionally, concerns regarding animal welfare and ethical sourcing can influence consumer choices and brand perception.
Future Opportunities in Gelatin Industry
The gelatin industry is poised for significant future opportunities. The burgeoning demand for collagen peptides, a derivative of gelatin, in the booming beauty-from-within and sports nutrition markets presents a substantial growth avenue. Expansion into emerging economies with rapidly growing food processing and pharmaceutical sectors offers considerable untapped potential. Innovations in marine-based gelatin and alternative protein sources will cater to a wider consumer base, including those with dietary restrictions. Furthermore, advancements in technology for producing highly functional and specialized gelatin grades for advanced pharmaceutical applications and functional foods will create new market niches.
Major Players in the Gelatin Industry Ecosystem
- Darling Ingredients Inc.
- Gelita AG
- Nippi Inc.
- Nitta Gelatin Inc.
- Jellice Pioneer Private Limited
- SAS Gelatines Weishardt
- ASAHI GELATINE INDUSTRIAL Co Ltd
- Italgelatine SpA
Key Developments in Gelatin Industry Industry
- May 2021: Darling Ingredients Inc. announced that its Rousselot brand expanded its range of purified, pharmaceutical-grade, and modified gelatin with the launch of X-Pure® GelDAT – Gelatin Desaminotyrosine, enhancing its offerings for specialized pharmaceutical applications.
- January 2021: Nitta Gelatin India has introduced an international-standard fine-grade gelatin under its Hotel/Restaurant/Catering (HoReCa) business. The superior-grade gelatin is produced using Japanese technology in accordance with Good Manufacturing Practice (GMP) and the Hazard Analysis and Critical Control Point (HACCP) system, in line with the European Regulation hygiene standards (EC). This gelatin is derived from natural sources that contain all essential amino acids except tryptophan, addressing a specific market segment with high-quality standards.
- November 2020: Rousselot launched a new delivery format, the gummy caps, for nutraceutical and pharmaceutical gelatin ingredients offered under its SiMoGel brand, enabling manufacturers to tap into the growing popularity of chews and gummies. Gummy caps combine the benefits of capsules, soft gels, and gummies in a single, innovative format, catering to evolving consumer preferences for convenient and appealing delivery systems.
Strategic Gelatin Industry Market Forecast
The strategic forecast for the gelatin industry indicates sustained and robust growth driven by diverse demand across the food, pharmaceutical, and nutraceutical sectors. The increasing consumer focus on health and wellness, coupled with the rising popularity of dietary supplements and collagen-based products, will continue to be a significant growth catalyst. Advances in extraction and modification technologies will unlock novel applications and enhance the functionality of gelatin, particularly in high-value pharmaceutical and cosmetic segments. Emerging markets, with their expanding middle class and increasing disposable incomes, present considerable opportunities for market penetration and expansion. While competition from plant-based alternatives persists, the inherent functional superiority of gelatin in many core applications ensures its continued relevance and market strength, projecting a healthy market expansion throughout the forecast period of 2025-2033.
Gelatin Industry Segmentation
-
1. Form
- 1.1. Animal Based
- 1.2. Marine Based
-
2. End User
-
2.1. Food and Beverages
-
2.1.1. By Sub End User
- 2.1.1.1. Bakery
- 2.1.1.2. Condiments/Sauces
- 2.1.1.3. Confectionery
- 2.1.1.4. Dairy and Dairy Alternative Products
- 2.1.1.5. RTE/RTC Food Products
- 2.1.1.6. Snacks
-
2.1.1. By Sub End User
- 2.2. Personal Care and Cosmetics
-
2.1. Food and Beverages
Gelatin Industry Segmentation By Geography
-
1. North America
- 1.1. United States
- 1.2. Canada
- 1.3. Mexico
-
2. South America
- 2.1. Brazil
- 2.2. Argentina
- 2.3. Rest of South America
-
3. Europe
- 3.1. United Kingdom
- 3.2. Germany
- 3.3. France
- 3.4. Italy
- 3.5. Spain
- 3.6. Russia
- 3.7. Benelux
- 3.8. Nordics
- 3.9. Rest of Europe
-
4. Middle East & Africa
- 4.1. Turkey
- 4.2. Israel
- 4.3. GCC
- 4.4. North Africa
- 4.5. South Africa
- 4.6. Rest of Middle East & Africa
-
5. Asia Pacific
- 5.1. China
- 5.2. India
- 5.3. Japan
- 5.4. South Korea
- 5.5. ASEAN
- 5.6. Oceania
- 5.7. Rest of Asia Pacific
Gelatin Industry Regional Market Share
Geographic Coverage of Gelatin Industry
Gelatin Industry REPORT HIGHLIGHTS
| Aspects | Details |
|---|---|
| Study Period | 2020-2034 |
| Base Year | 2025 |
| Estimated Year | 2026 |
| Forecast Period | 2026-2034 |
| Historical Period | 2020-2025 |
| Growth Rate | CAGR of 5.11% from 2020-2034 |
| Segmentation |
|
Table of Contents
- 1. Introduction
- 1.1. Research Scope
- 1.2. Market Segmentation
- 1.3. Research Methodology
- 1.4. Definitions and Assumptions
- 2. Executive Summary
- 2.1. Introduction
- 3. Market Dynamics
- 3.1. Introduction
- 3.2. Market Drivers
- 3.2.1. Increasing consumer health conciousness; Growing consumer inclination toward Vegan/Plant-Based Proteins
- 3.3. Market Restrains
- 3.3.1. Stringent government regulation of food labels/claims
- 3.4. Market Trends
- 3.4.1. OTHER KEY INDUSTRY TRENDS COVERED IN THE REPORT
- 4. Market Factor Analysis
- 4.1. Porters Five Forces
- 4.2. Supply/Value Chain
- 4.3. PESTEL analysis
- 4.4. Market Entropy
- 4.5. Patent/Trademark Analysis
- 5. Global Gelatin Industry Analysis, Insights and Forecast, 2020-2032
- 5.1. Market Analysis, Insights and Forecast - by Form
- 5.1.1. Animal Based
- 5.1.2. Marine Based
- 5.2. Market Analysis, Insights and Forecast - by End User
- 5.2.1. Food and Beverages
- 5.2.1.1. By Sub End User
- 5.2.1.1.1. Bakery
- 5.2.1.1.2. Condiments/Sauces
- 5.2.1.1.3. Confectionery
- 5.2.1.1.4. Dairy and Dairy Alternative Products
- 5.2.1.1.5. RTE/RTC Food Products
- 5.2.1.1.6. Snacks
- 5.2.1.1. By Sub End User
- 5.2.2. Personal Care and Cosmetics
- 5.2.1. Food and Beverages
- 5.3. Market Analysis, Insights and Forecast - by Region
- 5.3.1. North America
- 5.3.2. South America
- 5.3.3. Europe
- 5.3.4. Middle East & Africa
- 5.3.5. Asia Pacific
- 5.1. Market Analysis, Insights and Forecast - by Form
- 6. North America Gelatin Industry Analysis, Insights and Forecast, 2020-2032
- 6.1. Market Analysis, Insights and Forecast - by Form
- 6.1.1. Animal Based
- 6.1.2. Marine Based
- 6.2. Market Analysis, Insights and Forecast - by End User
- 6.2.1. Food and Beverages
- 6.2.1.1. By Sub End User
- 6.2.1.1.1. Bakery
- 6.2.1.1.2. Condiments/Sauces
- 6.2.1.1.3. Confectionery
- 6.2.1.1.4. Dairy and Dairy Alternative Products
- 6.2.1.1.5. RTE/RTC Food Products
- 6.2.1.1.6. Snacks
- 6.2.1.1. By Sub End User
- 6.2.2. Personal Care and Cosmetics
- 6.2.1. Food and Beverages
- 6.1. Market Analysis, Insights and Forecast - by Form
- 7. South America Gelatin Industry Analysis, Insights and Forecast, 2020-2032
- 7.1. Market Analysis, Insights and Forecast - by Form
- 7.1.1. Animal Based
- 7.1.2. Marine Based
- 7.2. Market Analysis, Insights and Forecast - by End User
- 7.2.1. Food and Beverages
- 7.2.1.1. By Sub End User
- 7.2.1.1.1. Bakery
- 7.2.1.1.2. Condiments/Sauces
- 7.2.1.1.3. Confectionery
- 7.2.1.1.4. Dairy and Dairy Alternative Products
- 7.2.1.1.5. RTE/RTC Food Products
- 7.2.1.1.6. Snacks
- 7.2.1.1. By Sub End User
- 7.2.2. Personal Care and Cosmetics
- 7.2.1. Food and Beverages
- 7.1. Market Analysis, Insights and Forecast - by Form
- 8. Europe Gelatin Industry Analysis, Insights and Forecast, 2020-2032
- 8.1. Market Analysis, Insights and Forecast - by Form
- 8.1.1. Animal Based
- 8.1.2. Marine Based
- 8.2. Market Analysis, Insights and Forecast - by End User
- 8.2.1. Food and Beverages
- 8.2.1.1. By Sub End User
- 8.2.1.1.1. Bakery
- 8.2.1.1.2. Condiments/Sauces
- 8.2.1.1.3. Confectionery
- 8.2.1.1.4. Dairy and Dairy Alternative Products
- 8.2.1.1.5. RTE/RTC Food Products
- 8.2.1.1.6. Snacks
- 8.2.1.1. By Sub End User
- 8.2.2. Personal Care and Cosmetics
- 8.2.1. Food and Beverages
- 8.1. Market Analysis, Insights and Forecast - by Form
- 9. Middle East & Africa Gelatin Industry Analysis, Insights and Forecast, 2020-2032
- 9.1. Market Analysis, Insights and Forecast - by Form
- 9.1.1. Animal Based
- 9.1.2. Marine Based
- 9.2. Market Analysis, Insights and Forecast - by End User
- 9.2.1. Food and Beverages
- 9.2.1.1. By Sub End User
- 9.2.1.1.1. Bakery
- 9.2.1.1.2. Condiments/Sauces
- 9.2.1.1.3. Confectionery
- 9.2.1.1.4. Dairy and Dairy Alternative Products
- 9.2.1.1.5. RTE/RTC Food Products
- 9.2.1.1.6. Snacks
- 9.2.1.1. By Sub End User
- 9.2.2. Personal Care and Cosmetics
- 9.2.1. Food and Beverages
- 9.1. Market Analysis, Insights and Forecast - by Form
- 10. Asia Pacific Gelatin Industry Analysis, Insights and Forecast, 2020-2032
- 10.1. Market Analysis, Insights and Forecast - by Form
- 10.1.1. Animal Based
- 10.1.2. Marine Based
- 10.2. Market Analysis, Insights and Forecast - by End User
- 10.2.1. Food and Beverages
- 10.2.1.1. By Sub End User
- 10.2.1.1.1. Bakery
- 10.2.1.1.2. Condiments/Sauces
- 10.2.1.1.3. Confectionery
- 10.2.1.1.4. Dairy and Dairy Alternative Products
- 10.2.1.1.5. RTE/RTC Food Products
- 10.2.1.1.6. Snacks
- 10.2.1.1. By Sub End User
- 10.2.2. Personal Care and Cosmetics
- 10.2.1. Food and Beverages
- 10.1. Market Analysis, Insights and Forecast - by Form
- 11. Competitive Analysis
- 11.1. Global Market Share Analysis 2025
- 11.2. Company Profiles
- 11.2.1 Darling Ingredients Inc
- 11.2.1.1. Overview
- 11.2.1.2. Products
- 11.2.1.3. SWOT Analysis
- 11.2.1.4. Recent Developments
- 11.2.1.5. Financials (Based on Availability)
- 11.2.2 Gelita AG
- 11.2.2.1. Overview
- 11.2.2.2. Products
- 11.2.2.3. SWOT Analysis
- 11.2.2.4. Recent Developments
- 11.2.2.5. Financials (Based on Availability)
- 11.2.3 Nippi Inc
- 11.2.3.1. Overview
- 11.2.3.2. Products
- 11.2.3.3. SWOT Analysis
- 11.2.3.4. Recent Developments
- 11.2.3.5. Financials (Based on Availability)
- 11.2.4 Nitta Gelatin Inc
- 11.2.4.1. Overview
- 11.2.4.2. Products
- 11.2.4.3. SWOT Analysis
- 11.2.4.4. Recent Developments
- 11.2.4.5. Financials (Based on Availability)
- 11.2.5 Jellice Pioneer Private Limited
- 11.2.5.1. Overview
- 11.2.5.2. Products
- 11.2.5.3. SWOT Analysis
- 11.2.5.4. Recent Developments
- 11.2.5.5. Financials (Based on Availability)
- 11.2.6 SAS Gelatines Weishard
- 11.2.6.1. Overview
- 11.2.6.2. Products
- 11.2.6.3. SWOT Analysis
- 11.2.6.4. Recent Developments
- 11.2.6.5. Financials (Based on Availability)
- 11.2.7 ASAHI GELATINE INDUSTRIAL Co Ltd
- 11.2.7.1. Overview
- 11.2.7.2. Products
- 11.2.7.3. SWOT Analysis
- 11.2.7.4. Recent Developments
- 11.2.7.5. Financials (Based on Availability)
- 11.2.8 Italgelatine SpA
- 11.2.8.1. Overview
- 11.2.8.2. Products
- 11.2.8.3. SWOT Analysis
- 11.2.8.4. Recent Developments
- 11.2.8.5. Financials (Based on Availability)
- 11.2.1 Darling Ingredients Inc
List of Figures
- Figure 1: Global Gelatin Industry Revenue Breakdown (Million, %) by Region 2025 & 2033
- Figure 2: North America Gelatin Industry Revenue (Million), by Form 2025 & 2033
- Figure 3: North America Gelatin Industry Revenue Share (%), by Form 2025 & 2033
- Figure 4: North America Gelatin Industry Revenue (Million), by End User 2025 & 2033
- Figure 5: North America Gelatin Industry Revenue Share (%), by End User 2025 & 2033
- Figure 6: North America Gelatin Industry Revenue (Million), by Country 2025 & 2033
- Figure 7: North America Gelatin Industry Revenue Share (%), by Country 2025 & 2033
- Figure 8: South America Gelatin Industry Revenue (Million), by Form 2025 & 2033
- Figure 9: South America Gelatin Industry Revenue Share (%), by Form 2025 & 2033
- Figure 10: South America Gelatin Industry Revenue (Million), by End User 2025 & 2033
- Figure 11: South America Gelatin Industry Revenue Share (%), by End User 2025 & 2033
- Figure 12: South America Gelatin Industry Revenue (Million), by Country 2025 & 2033
- Figure 13: South America Gelatin Industry Revenue Share (%), by Country 2025 & 2033
- Figure 14: Europe Gelatin Industry Revenue (Million), by Form 2025 & 2033
- Figure 15: Europe Gelatin Industry Revenue Share (%), by Form 2025 & 2033
- Figure 16: Europe Gelatin Industry Revenue (Million), by End User 2025 & 2033
- Figure 17: Europe Gelatin Industry Revenue Share (%), by End User 2025 & 2033
- Figure 18: Europe Gelatin Industry Revenue (Million), by Country 2025 & 2033
- Figure 19: Europe Gelatin Industry Revenue Share (%), by Country 2025 & 2033
- Figure 20: Middle East & Africa Gelatin Industry Revenue (Million), by Form 2025 & 2033
- Figure 21: Middle East & Africa Gelatin Industry Revenue Share (%), by Form 2025 & 2033
- Figure 22: Middle East & Africa Gelatin Industry Revenue (Million), by End User 2025 & 2033
- Figure 23: Middle East & Africa Gelatin Industry Revenue Share (%), by End User 2025 & 2033
- Figure 24: Middle East & Africa Gelatin Industry Revenue (Million), by Country 2025 & 2033
- Figure 25: Middle East & Africa Gelatin Industry Revenue Share (%), by Country 2025 & 2033
- Figure 26: Asia Pacific Gelatin Industry Revenue (Million), by Form 2025 & 2033
- Figure 27: Asia Pacific Gelatin Industry Revenue Share (%), by Form 2025 & 2033
- Figure 28: Asia Pacific Gelatin Industry Revenue (Million), by End User 2025 & 2033
- Figure 29: Asia Pacific Gelatin Industry Revenue Share (%), by End User 2025 & 2033
- Figure 30: Asia Pacific Gelatin Industry Revenue (Million), by Country 2025 & 2033
- Figure 31: Asia Pacific Gelatin Industry Revenue Share (%), by Country 2025 & 2033
List of Tables
- Table 1: Global Gelatin Industry Revenue Million Forecast, by Form 2020 & 2033
- Table 2: Global Gelatin Industry Revenue Million Forecast, by End User 2020 & 2033
- Table 3: Global Gelatin Industry Revenue Million Forecast, by Region 2020 & 2033
- Table 4: Global Gelatin Industry Revenue Million Forecast, by Form 2020 & 2033
- Table 5: Global Gelatin Industry Revenue Million Forecast, by End User 2020 & 2033
- Table 6: Global Gelatin Industry Revenue Million Forecast, by Country 2020 & 2033
- Table 7: United States Gelatin Industry Revenue (Million) Forecast, by Application 2020 & 2033
- Table 8: Canada Gelatin Industry Revenue (Million) Forecast, by Application 2020 & 2033
- Table 9: Mexico Gelatin Industry Revenue (Million) Forecast, by Application 2020 & 2033
- Table 10: Global Gelatin Industry Revenue Million Forecast, by Form 2020 & 2033
- Table 11: Global Gelatin Industry Revenue Million Forecast, by End User 2020 & 2033
- Table 12: Global Gelatin Industry Revenue Million Forecast, by Country 2020 & 2033
- Table 13: Brazil Gelatin Industry Revenue (Million) Forecast, by Application 2020 & 2033
- Table 14: Argentina Gelatin Industry Revenue (Million) Forecast, by Application 2020 & 2033
- Table 15: Rest of South America Gelatin Industry Revenue (Million) Forecast, by Application 2020 & 2033
- Table 16: Global Gelatin Industry Revenue Million Forecast, by Form 2020 & 2033
- Table 17: Global Gelatin Industry Revenue Million Forecast, by End User 2020 & 2033
- Table 18: Global Gelatin Industry Revenue Million Forecast, by Country 2020 & 2033
- Table 19: United Kingdom Gelatin Industry Revenue (Million) Forecast, by Application 2020 & 2033
- Table 20: Germany Gelatin Industry Revenue (Million) Forecast, by Application 2020 & 2033
- Table 21: France Gelatin Industry Revenue (Million) Forecast, by Application 2020 & 2033
- Table 22: Italy Gelatin Industry Revenue (Million) Forecast, by Application 2020 & 2033
- Table 23: Spain Gelatin Industry Revenue (Million) Forecast, by Application 2020 & 2033
- Table 24: Russia Gelatin Industry Revenue (Million) Forecast, by Application 2020 & 2033
- Table 25: Benelux Gelatin Industry Revenue (Million) Forecast, by Application 2020 & 2033
- Table 26: Nordics Gelatin Industry Revenue (Million) Forecast, by Application 2020 & 2033
- Table 27: Rest of Europe Gelatin Industry Revenue (Million) Forecast, by Application 2020 & 2033
- Table 28: Global Gelatin Industry Revenue Million Forecast, by Form 2020 & 2033
- Table 29: Global Gelatin Industry Revenue Million Forecast, by End User 2020 & 2033
- Table 30: Global Gelatin Industry Revenue Million Forecast, by Country 2020 & 2033
- Table 31: Turkey Gelatin Industry Revenue (Million) Forecast, by Application 2020 & 2033
- Table 32: Israel Gelatin Industry Revenue (Million) Forecast, by Application 2020 & 2033
- Table 33: GCC Gelatin Industry Revenue (Million) Forecast, by Application 2020 & 2033
- Table 34: North Africa Gelatin Industry Revenue (Million) Forecast, by Application 2020 & 2033
- Table 35: South Africa Gelatin Industry Revenue (Million) Forecast, by Application 2020 & 2033
- Table 36: Rest of Middle East & Africa Gelatin Industry Revenue (Million) Forecast, by Application 2020 & 2033
- Table 37: Global Gelatin Industry Revenue Million Forecast, by Form 2020 & 2033
- Table 38: Global Gelatin Industry Revenue Million Forecast, by End User 2020 & 2033
- Table 39: Global Gelatin Industry Revenue Million Forecast, by Country 2020 & 2033
- Table 40: China Gelatin Industry Revenue (Million) Forecast, by Application 2020 & 2033
- Table 41: India Gelatin Industry Revenue (Million) Forecast, by Application 2020 & 2033
- Table 42: Japan Gelatin Industry Revenue (Million) Forecast, by Application 2020 & 2033
- Table 43: South Korea Gelatin Industry Revenue (Million) Forecast, by Application 2020 & 2033
- Table 44: ASEAN Gelatin Industry Revenue (Million) Forecast, by Application 2020 & 2033
- Table 45: Oceania Gelatin Industry Revenue (Million) Forecast, by Application 2020 & 2033
- Table 46: Rest of Asia Pacific Gelatin Industry Revenue (Million) Forecast, by Application 2020 & 2033
Frequently Asked Questions
1. What is the projected Compound Annual Growth Rate (CAGR) of the Gelatin Industry?
The projected CAGR is approximately 5.11%.
2. Which companies are prominent players in the Gelatin Industry?
Key companies in the market include Darling Ingredients Inc, Gelita AG, Nippi Inc, Nitta Gelatin Inc, Jellice Pioneer Private Limited, SAS Gelatines Weishard, ASAHI GELATINE INDUSTRIAL Co Ltd, Italgelatine SpA.
3. What are the main segments of the Gelatin Industry?
The market segments include Form, End User.
4. Can you provide details about the market size?
The market size is estimated to be USD XX Million as of 2022.
5. What are some drivers contributing to market growth?
Increasing consumer health conciousness; Growing consumer inclination toward Vegan/Plant-Based Proteins.
6. What are the notable trends driving market growth?
OTHER KEY INDUSTRY TRENDS COVERED IN THE REPORT.
7. Are there any restraints impacting market growth?
Stringent government regulation of food labels/claims.
8. Can you provide examples of recent developments in the market?
May 2021: Darling Ingredients Inc. announced that its Rousselot brand expanded its range of purified, pharmaceutical-grade, and modified gelatin with the launch of X-Pure® GelDAT – Gelatin Desaminotyrosine.January 2021: Nitta Gelatin India has introduced an international-standard fine-grade gelatin under its Hotel/Restaurant/Catering (HoReCa) business. The superior-grade gelatin is produced using Japanese technology in accordance with Good Manufacturing Practice (GMP) and the Hazard Analysis and Critical Control Point (HACCP) system, in line with the European Regulation hygiene standards (EC). This gelatin is derived from natural sources that contain all essential amino acids except tryptophan.November 2020: Rousselot launched a new delivery format, the gummy caps, for nutraceutical and pharmaceutical gelatin ingredients offered under its SiMoGel brand, enabling manufacturers to tap into the growing popularity of chews and gummies. Gummy caps combine the benefits of capsules, soft gels, and gummies in a singl
9. What pricing options are available for accessing the report?
Pricing options include single-user, multi-user, and enterprise licenses priced at USD 3800, USD 4500, and USD 5800 respectively.
10. Is the market size provided in terms of value or volume?
The market size is provided in terms of value, measured in Million.
11. Are there any specific market keywords associated with the report?
Yes, the market keyword associated with the report is "Gelatin Industry," which aids in identifying and referencing the specific market segment covered.
12. How do I determine which pricing option suits my needs best?
The pricing options vary based on user requirements and access needs. Individual users may opt for single-user licenses, while businesses requiring broader access may choose multi-user or enterprise licenses for cost-effective access to the report.
13. Are there any additional resources or data provided in the Gelatin Industry report?
While the report offers comprehensive insights, it's advisable to review the specific contents or supplementary materials provided to ascertain if additional resources or data are available.
14. How can I stay updated on further developments or reports in the Gelatin Industry?
To stay informed about further developments, trends, and reports in the Gelatin Industry, consider subscribing to industry newsletters, following relevant companies and organizations, or regularly checking reputable industry news sources and publications.
Methodology
Step 1 - Identification of Relevant Samples Size from Population Database


Step 2 - Approaches for Defining Global Market Size (Value, Volume* & Price*)

Note*: In applicable scenarios
Step 3 - Data Sources
Primary Research
- Web Analytics
- Survey Reports
- Research Institute
- Latest Research Reports
- Opinion Leaders
Secondary Research
- Annual Reports
- White Paper
- Latest Press Release
- Industry Association
- Paid Database
- Investor Presentations

Step 4 - Data Triangulation
Involves using different sources of information in order to increase the validity of a study
These sources are likely to be stakeholders in a program - participants, other researchers, program staff, other community members, and so on.
Then we put all data in single framework & apply various statistical tools to find out the dynamic on the market.
During the analysis stage, feedback from the stakeholder groups would be compared to determine areas of agreement as well as areas of divergence