

Key Insights
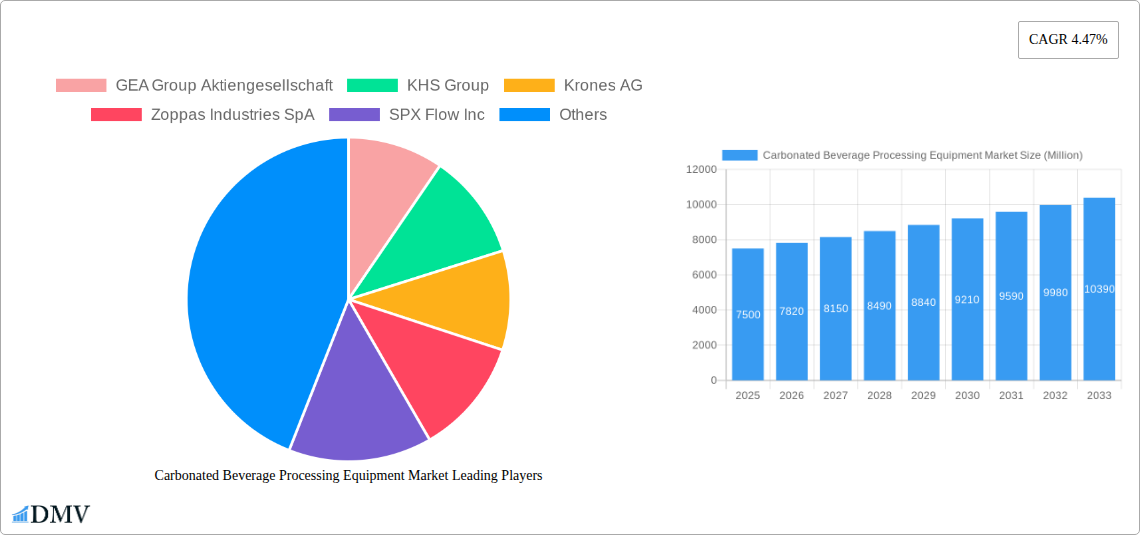
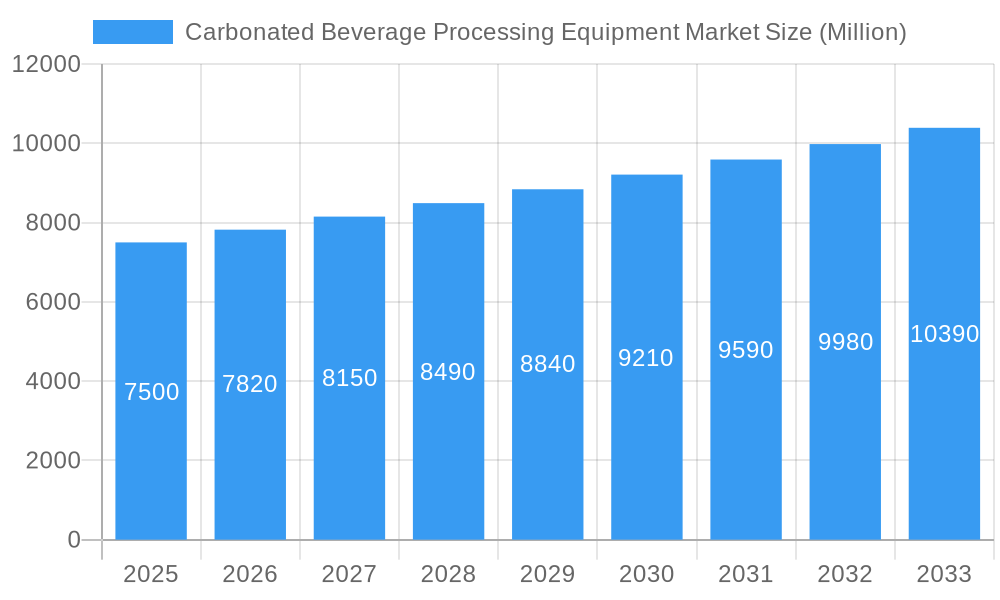
The global Carbonated Beverage Processing Equipment Market is projected for significant expansion, anticipated to reach a substantial valuation by the close of the study period. With a Compound Annual Growth Rate (CAGR) of 5.1%, the market is expected to grow from an estimated market size of $7.28 billion in the base year 2025 to over $10 billion by 2033. This growth is driven by increasing consumer preference for flavored, functional, and sparkling beverages, alongside technological advancements enhancing processing efficiency and customization. Demand for innovative packaging and sophisticated techniques to preserve beverage quality further fuels market expansion. Key industry players are investing in R&D for advanced equipment, including intelligent sugar dissolvers, efficient carbonation systems, and sophisticated blending machinery.
Carbonated Beverage Processing Equipment Market Market Size (In Billion)
Market dynamics are shaped by trends such as the growing emphasis on sustainability and energy efficiency in manufacturing, leading to the adoption of eco-friendly equipment. The "premiumization" of beverages, where consumers seek unique flavors and functional benefits, also boosts demand for specialized processing equipment. However, high initial capital investment and stringent regulatory compliance for food and beverage production present market restraints. Geographically, the Asia Pacific region, particularly China and India, is identified as a high-growth area due to rising disposable incomes and a burgeoning preference for carbonated beverages. North America and Europe maintain significant market share, supported by mature beverage industries and strong demand for premium and functional drinks.
Carbonated Beverage Processing Equipment Market Company Market Share
This comprehensive report provides an in-depth analysis of the global Carbonated Beverage Processing Equipment Market, offering critical insights for stakeholders. Covering a study period from 2019 to 2033, with a base year of 2025, this report delivers actionable intelligence on market trends, technological advancements, regional dynamics, and competitive strategies. Explore essential processing machinery such as sugar dissolvers, carbonation equipment, blenders and mixers, and heat exchangers, and understand the impact of growth in flavored drinks, functional drinks, club soda, and sparkling water segments.
Carbonated Beverage Processing Equipment Market Market Composition & Trends
The Carbonated Beverage Processing Equipment Market is characterized by a moderate level of concentration, with established players like GEA Group Aktiengesellschaft, KHS Group, Krones AG, Zoppas Industries SpA, SPX Flow Inc, Tetra Laval International SA, A DUE SpA, and Alfa Laval AB holding significant market share. Innovation acts as a key catalyst, driven by the demand for energy-efficient, automated, and sustainable processing solutions. The regulatory landscape is evolving, with increasing emphasis on food safety, hygiene standards, and environmental impact, influencing equipment design and manufacturing. Substitute products, while limited in core functionality, may emerge from advanced beverage technologies that bypass traditional carbonation methods. End-user profiles range from large-scale multinational beverage corporations to smaller craft producers, each with distinct needs for capacity, flexibility, and cost-effectiveness. Mergers and acquisitions (M&A) activities are strategic, aimed at expanding product portfolios, gaining market access, and consolidating technological expertise. For instance, a recent M&A deal in the historical period was valued at approximately $500 Million, underscoring the consolidation trend. Key trends include the adoption of Industry 4.0 technologies for enhanced process control and data analytics, and a growing preference for modular and scalable equipment to adapt to fluctuating market demands.
Carbonated Beverage Processing Equipment Market Industry Evolution
The Carbonated Beverage Processing Equipment Market has witnessed a significant evolution driven by evolving consumer preferences and technological innovation. Throughout the historical period (2019–2024), the market saw a steady growth trajectory, fueled by the expanding global demand for carbonated beverages. This period was marked by increasing consumer interest in healthier options, leading to a surge in demand for equipment capable of processing functional drinks and low-sugar variants. The rise of artisanal and craft beverage production also contributed to market expansion, necessitating more flexible and smaller-scale processing solutions. Technological advancements played a pivotal role, with manufacturers investing heavily in research and development to introduce more efficient and automated equipment. This includes the development of advanced carbonation equipment with precise CO2 injection control and enhanced blenders and mixers for uniform ingredient distribution. The adoption of sophisticated heat exchangers improved energy efficiency and product quality, minimizing thermal damage to delicate ingredients. Furthermore, the industry embraced digitalization, with the integration of smart sensors, IoT capabilities, and advanced analytics into processing lines, enabling real-time monitoring, predictive maintenance, and optimized operational performance. The estimated year of 2025 anticipates continued robust growth, with an expected CAGR of approximately 5.5% in the coming years. This growth is further propelled by emerging markets and increased disposable incomes in developing economies, which are driving higher consumption of packaged beverages. The focus on sustainability also influences equipment design, with a trend towards reduced water and energy consumption, and the use of recyclable materials in machinery components. The forecast period (2025–2033) is expected to see a sustained expansion, driven by ongoing innovation in beverage formulations, a growing emphasis on personalized nutrition, and the continued penetration of carbonated beverages across diverse demographics.
Leading Regions, Countries, or Segments in Carbonated Beverage Processing Equipment Market
The Carbonated Beverage Processing Equipment Market exhibits distinct regional and segmental leadership. North America and Europe currently dominate the market, driven by well-established beverage industries, high consumer spending, and a strong preference for carbonated beverages, particularly club soda and sparkling water. The United States leads in terms of market size and technological adoption, owing to significant investments in advanced processing machinery and a thriving functional beverage sector. Asia Pacific is emerging as a high-growth region, fueled by a rapidly expanding middle class, increasing urbanization, and a growing demand for a wide array of carbonated drinks, including novel flavored drinks.
Key drivers for dominance in these regions and segments include:
- Investment Trends: Significant capital expenditure by major beverage manufacturers on upgrading and expanding production facilities.
- Regulatory Support: Favorable government policies promoting food safety standards and investment in manufacturing infrastructure.
- Consumer Demand: High and sustained consumer appetite for carbonated beverages, including functional and health-oriented options.
Within Equipment Type, Carbonation Equipments and Blenders and Mixers represent the largest segments due to their indispensable role in the production of all carbonated beverages. The demand for sophisticated sugar dissolvers is also growing, particularly with the increasing focus on optimizing sweetness profiles and reducing sugar content. Heat Exchangers are crucial for maintaining product quality and safety throughout the processing chain. The Beverage Type segment is led by Flavored Drinks, which encompass a vast and diverse market. However, the rapid growth in demand for Functional Drinks and the consistent popularity of Club Soda and Sparkling Water are significant growth catalysts, driving innovation in specialized processing equipment. The increasing health consciousness among consumers is directly boosting the demand for equipment capable of producing beverages with added vitamins, minerals, and natural ingredients, further solidifying the importance of the functional drinks segment. Furthermore, the shift towards premium and artisanal beverages is also influencing the types of equipment required, with a growing demand for precise control and customization capabilities in processing lines.
Carbonated Beverage Processing Equipment Market Product Innovations
Product innovations in the Carbonated Beverage Processing Equipment Market are largely focused on enhancing efficiency, sustainability, and product quality. Manufacturers are developing advanced carbonation equipment that offers superior CO2 dissolution rates and finer bubble consistency, leading to a more desirable mouthfeel and longer-lasting effervescence. Innovations in blenders and mixers are enabling more precise and uniform incorporation of ingredients, including sensitive flavors and functional additives, while minimizing shear forces that can degrade product integrity. Furthermore, the integration of smart sensors and AI-driven process control systems allows for real-time monitoring and optimization of parameters, ensuring consistent batch quality and reducing waste. Energy-efficient heat exchangers are also being introduced, utilizing advanced designs to reduce energy consumption and operational costs, aligning with industry sustainability goals. These advancements contribute to a superior end-product and more competitive production processes for beverage manufacturers.
Propelling Factors for Carbonated Beverage Processing Equipment Market Growth
Several key factors are propelling the growth of the Carbonated Beverage Processing Equipment Market. The ever-increasing global demand for carbonated beverages, driven by evolving consumer lifestyles and a growing preference for convenient and refreshing drinks, is a primary growth driver. Technological advancements, such as the development of more energy-efficient and automated processing systems, are attracting investment and boosting market expansion. The rising popularity of functional drinks, fortified with vitamins, minerals, and other health-benefiting ingredients, is creating new opportunities for specialized processing equipment. Furthermore, the growing disposable income in emerging economies is leading to increased consumption of packaged beverages, thereby driving the demand for production machinery. The trend towards healthier beverage options, including reduced-sugar and natural ingredient-based carbonated drinks, also necessitates the adoption of advanced blending and carbonation technologies.
Obstacles in the Carbonated Beverage Processing Equipment Market Market
Despite its robust growth, the Carbonated Beverage Processing Equipment Market faces certain obstacles. Stringent regulatory requirements related to food safety, hygiene, and environmental compliance can increase manufacturing costs and necessitate significant investment in equipment upgrades. Fluctuations in raw material prices for equipment manufacturing, such as stainless steel, can impact profitability and pricing strategies. Supply chain disruptions, as witnessed in recent global events, can lead to delays in production and delivery, affecting project timelines for beverage manufacturers. The high initial capital investment required for sophisticated processing equipment can be a barrier for smaller beverage producers or those in emerging markets. Moreover, intense competition among equipment manufacturers, leading to price pressures, also poses a challenge to market profitability.
Future Opportunities in Carbonated Beverage Processing Equipment Market
The Carbonated Beverage Processing Equipment Market is poised for significant future opportunities. The burgeoning demand for plant-based and health-focused functional drinks presents a substantial growth avenue for manufacturers of specialized blending and carbonation equipment. The expansion of the beverage industry in emerging economies, particularly in Asia Pacific and Africa, offers vast untapped markets for processing machinery. The increasing adoption of Industry 4.0 technologies, including AI and IoT, for intelligent processing and data analytics, will drive demand for advanced and connected equipment. Furthermore, the growing trend of personalized beverage consumption creates opportunities for flexible and modular processing solutions that can cater to smaller batch sizes and customized formulations. The development of sustainable and eco-friendly processing equipment, aligning with global environmental initiatives, will also be a key area for future growth.
Major Players in the Carbonated Beverage Processing Equipment Market Ecosystem
- GEA Group Aktiengesellschaft
- KHS Group
- Krones AG
- Zoppas Industries SpA
- SPX Flow Inc
- Tetra Laval International SA
- A DUE SpA
- Alfa Laval AB
Key Developments in Carbonated Beverage Processing Equipment Market Industry
- 2023/08: Launch of a new energy-efficient heat exchanger by Alfa Laval AB, significantly reducing operational costs for beverage processors.
- 2023/04: Krones AG announces a strategic partnership with a leading functional beverage brand to develop customized carbonation solutions.
- 2022/11: SPX Flow Inc. acquires a specialized mixing technology company, expanding its portfolio for complex beverage formulations.
- 2022/07: GEA Group Aktiengesellschaft introduces an advanced automated carbonation system, improving CO2 retention and product consistency.
- 2021/05: Tetra Laval International SA unveils a modular processing line designed for rapid product changeovers, catering to the demand for diverse flavored drinks.
Strategic Carbonated Beverage Processing Equipment Market Market Forecast
The Carbonated Beverage Processing Equipment Market is set for a promising future, driven by sustained demand for carbonated beverages and continuous innovation in processing technology. The forecast indicates a strong upward trajectory, fueled by the expanding global beverage market and increasing consumer focus on health and wellness, leading to a higher demand for functional drinks and specialized equipment. Technological advancements, including the integration of Industry 4.0 capabilities and automation, will enhance operational efficiency and product quality, further stimulating market growth. Emerging economies present significant untapped potential, while established markets will continue to drive demand through product diversification and premiumization trends. Strategic investments in R&D and market expansion will be crucial for stakeholders to capitalize on these burgeoning opportunities and secure a competitive advantage in the evolving landscape of carbonated beverage production.
Carbonated Beverage Processing Equipment Market Segmentation
-
1. Equipment Type
- 1.1. Sugar Dissolvers
- 1.2. Carbonation Equipments
- 1.3. Blenders and Mixers
- 1.4. Heat Exchangers
- 1.5. Other Equipment Types
-
2. Beverage Type
- 2.1. Flavored Drinks
- 2.2. Functional Drinks
- 2.3. Club Soda and Sparkling Water
Carbonated Beverage Processing Equipment Market Segmentation By Geography
-
1. North America
- 1.1. United States
- 1.2. Canada
- 1.3. Mexico
- 1.4. Rest of North America
-
2. Europe
- 2.1. Germany
- 2.2. United Kingdom
- 2.3. France
- 2.4. Russia
- 2.5. Spain
- 2.6. Italy
- 2.7. Rest of Europe
-
3. Asia Pacific
- 3.1. India
- 3.2. China
- 3.3. Japan
- 3.4. Australia
- 3.5. Rest of Asia Pacific
-
4. South America
- 4.1. Brazil
- 4.2. Colombia
- 4.3. Rest of South America
- 5. Middle East
-
6. South Africa
- 6.1. Saudi Arabia
- 6.2. Rest of Middle East
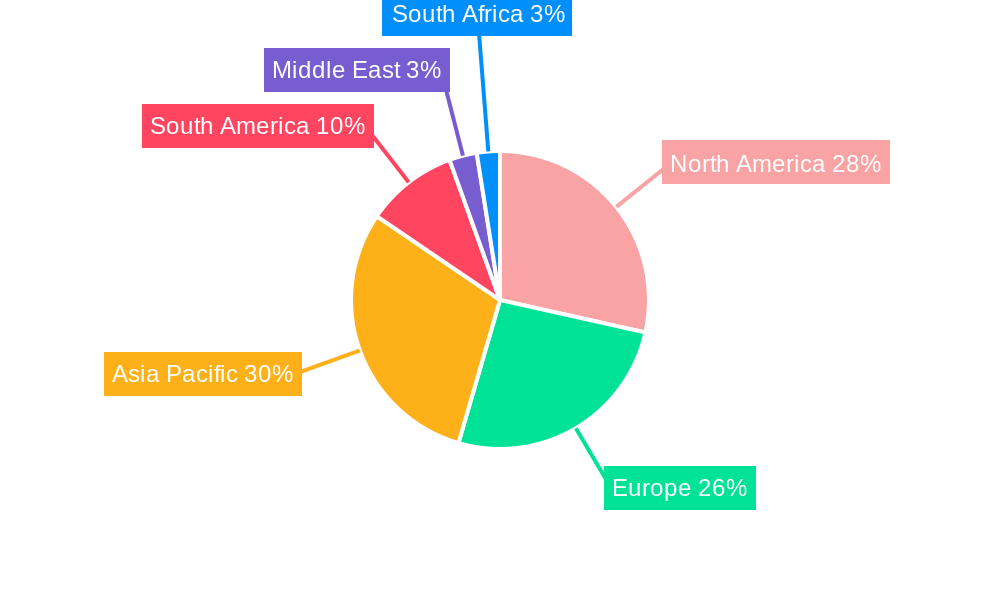
Carbonated Beverage Processing Equipment Market Regional Market Share
Geographic Coverage of Carbonated Beverage Processing Equipment Market
Carbonated Beverage Processing Equipment Market REPORT HIGHLIGHTS
| Aspects | Details |
|---|---|
| Study Period | 2020-2034 |
| Base Year | 2025 |
| Estimated Year | 2026 |
| Forecast Period | 2026-2034 |
| Historical Period | 2020-2025 |
| Growth Rate | CAGR of 5.1% from 2020-2034 |
| Segmentation |
|
Table of Contents
- 1. Introduction
- 1.1. Research Scope
- 1.2. Market Segmentation
- 1.3. Research Objective
- 1.4. Definitions and Assumptions
- 2. Executive Summary
- 2.1. Market Snapshot
- 3. Market Dynamics
- 3.1. Market Drivers
- 3.2. Market Restrains
- 3.3. Market Trends
- 3.4. Market Opportunities
- 4. Market Factor Analysis
- 4.1. Porters Five Forces
- 4.1.1. Bargaining Power of Suppliers
- 4.1.2. Bargaining Power of Buyers
- 4.1.3. Threat of New Entrants
- 4.1.4. Threat of Substitutes
- 4.1.5. Competitive Rivalry
- 4.2. PESTEL analysis
- 4.3. BCG Analysis
- 4.3.1. Stars (High Growth, High Market Share)
- 4.3.2. Cash Cows (Low Growth, High Market Share)
- 4.3.3. Question Mark (High Growth, Low Market Share)
- 4.3.4. Dogs (Low Growth, Low Market Share)
- 4.4. Ansoff Matrix Analysis
- 4.5. Supply Chain Analysis
- 4.6. Regulatory Landscape
- 4.7. Current Market Potential and Opportunity Assessment (TAM–SAM–SOM Framework)
- 4.8. DMV Analyst Note
- 4.1. Porters Five Forces
- 5. Market Analysis, Insights and Forecast 2021-2033
- 5.1. Market Analysis, Insights and Forecast - by Equipment Type
- 5.1.1. Sugar Dissolvers
- 5.1.2. Carbonation Equipments
- 5.1.3. Blenders and Mixers
- 5.1.4. Heat Exchangers
- 5.1.5. Other Equipment Types
- 5.2. Market Analysis, Insights and Forecast - by Beverage Type
- 5.2.1. Flavored Drinks
- 5.2.2. Functional Drinks
- 5.2.3. Club Soda and Sparkling Water
- 5.3. Market Analysis, Insights and Forecast - by Region
- 5.3.1. North America
- 5.3.2. Europe
- 5.3.3. Asia Pacific
- 5.3.4. South America
- 5.3.5. Middle East
- 5.3.6. South Africa
- 5.1. Market Analysis, Insights and Forecast - by Equipment Type
- 6. Global Carbonated Beverage Processing Equipment Market Analysis, Insights and Forecast, 2021-2033
- 6.1. Market Analysis, Insights and Forecast - by Equipment Type
- 6.1.1. Sugar Dissolvers
- 6.1.2. Carbonation Equipments
- 6.1.3. Blenders and Mixers
- 6.1.4. Heat Exchangers
- 6.1.5. Other Equipment Types
- 6.2. Market Analysis, Insights and Forecast - by Beverage Type
- 6.2.1. Flavored Drinks
- 6.2.2. Functional Drinks
- 6.2.3. Club Soda and Sparkling Water
- 6.1. Market Analysis, Insights and Forecast - by Equipment Type
- 7. North America Carbonated Beverage Processing Equipment Market Analysis, Insights and Forecast, 2020-2032
- 7.1. Market Analysis, Insights and Forecast - by Equipment Type
- 7.1.1. Sugar Dissolvers
- 7.1.2. Carbonation Equipments
- 7.1.3. Blenders and Mixers
- 7.1.4. Heat Exchangers
- 7.1.5. Other Equipment Types
- 7.2. Market Analysis, Insights and Forecast - by Beverage Type
- 7.2.1. Flavored Drinks
- 7.2.2. Functional Drinks
- 7.2.3. Club Soda and Sparkling Water
- 7.1. Market Analysis, Insights and Forecast - by Equipment Type
- 8. Europe Carbonated Beverage Processing Equipment Market Analysis, Insights and Forecast, 2020-2032
- 8.1. Market Analysis, Insights and Forecast - by Equipment Type
- 8.1.1. Sugar Dissolvers
- 8.1.2. Carbonation Equipments
- 8.1.3. Blenders and Mixers
- 8.1.4. Heat Exchangers
- 8.1.5. Other Equipment Types
- 8.2. Market Analysis, Insights and Forecast - by Beverage Type
- 8.2.1. Flavored Drinks
- 8.2.2. Functional Drinks
- 8.2.3. Club Soda and Sparkling Water
- 8.1. Market Analysis, Insights and Forecast - by Equipment Type
- 9. Asia Pacific Carbonated Beverage Processing Equipment Market Analysis, Insights and Forecast, 2020-2032
- 9.1. Market Analysis, Insights and Forecast - by Equipment Type
- 9.1.1. Sugar Dissolvers
- 9.1.2. Carbonation Equipments
- 9.1.3. Blenders and Mixers
- 9.1.4. Heat Exchangers
- 9.1.5. Other Equipment Types
- 9.2. Market Analysis, Insights and Forecast - by Beverage Type
- 9.2.1. Flavored Drinks
- 9.2.2. Functional Drinks
- 9.2.3. Club Soda and Sparkling Water
- 9.1. Market Analysis, Insights and Forecast - by Equipment Type
- 10. South America Carbonated Beverage Processing Equipment Market Analysis, Insights and Forecast, 2020-2032
- 10.1. Market Analysis, Insights and Forecast - by Equipment Type
- 10.1.1. Sugar Dissolvers
- 10.1.2. Carbonation Equipments
- 10.1.3. Blenders and Mixers
- 10.1.4. Heat Exchangers
- 10.1.5. Other Equipment Types
- 10.2. Market Analysis, Insights and Forecast - by Beverage Type
- 10.2.1. Flavored Drinks
- 10.2.2. Functional Drinks
- 10.2.3. Club Soda and Sparkling Water
- 10.1. Market Analysis, Insights and Forecast - by Equipment Type
- 11. Middle East Carbonated Beverage Processing Equipment Market Analysis, Insights and Forecast, 2020-2032
- 11.1. Market Analysis, Insights and Forecast - by Equipment Type
- 11.1.1. Sugar Dissolvers
- 11.1.2. Carbonation Equipments
- 11.1.3. Blenders and Mixers
- 11.1.4. Heat Exchangers
- 11.1.5. Other Equipment Types
- 11.2. Market Analysis, Insights and Forecast - by Beverage Type
- 11.2.1. Flavored Drinks
- 11.2.2. Functional Drinks
- 11.2.3. Club Soda and Sparkling Water
- 11.1. Market Analysis, Insights and Forecast - by Equipment Type
- 12. South Africa Carbonated Beverage Processing Equipment Market Analysis, Insights and Forecast, 2020-2032
- 12.1. Market Analysis, Insights and Forecast - by Equipment Type
- 12.1.1. Sugar Dissolvers
- 12.1.2. Carbonation Equipments
- 12.1.3. Blenders and Mixers
- 12.1.4. Heat Exchangers
- 12.1.5. Other Equipment Types
- 12.2. Market Analysis, Insights and Forecast - by Beverage Type
- 12.2.1. Flavored Drinks
- 12.2.2. Functional Drinks
- 12.2.3. Club Soda and Sparkling Water
- 12.1. Market Analysis, Insights and Forecast - by Equipment Type
- 13. Competitive Analysis
- 13.1. Company Profiles
- 13.1.1 GEA Group Aktiengesellschaft
- 13.1.1.1. Company Overview
- 13.1.1.2. Products
- 13.1.1.3. Company Financials
- 13.1.1.4. SWOT Analysis
- 13.1.2 KHS Group
- 13.1.2.1. Company Overview
- 13.1.2.2. Products
- 13.1.2.3. Company Financials
- 13.1.2.4. SWOT Analysis
- 13.1.3 Krones AG
- 13.1.3.1. Company Overview
- 13.1.3.2. Products
- 13.1.3.3. Company Financials
- 13.1.3.4. SWOT Analysis
- 13.1.4 Zoppas Industries SpA
- 13.1.4.1. Company Overview
- 13.1.4.2. Products
- 13.1.4.3. Company Financials
- 13.1.4.4. SWOT Analysis
- 13.1.5 SPX Flow Inc
- 13.1.5.1. Company Overview
- 13.1.5.2. Products
- 13.1.5.3. Company Financials
- 13.1.5.4. SWOT Analysis
- 13.1.6 Tetra Laval International SA
- 13.1.6.1. Company Overview
- 13.1.6.2. Products
- 13.1.6.3. Company Financials
- 13.1.6.4. SWOT Analysis
- 13.1.7 A DUE SpA
- 13.1.7.1. Company Overview
- 13.1.7.2. Products
- 13.1.7.3. Company Financials
- 13.1.7.4. SWOT Analysis
- 13.1.8 Alfa Laval AB
- 13.1.8.1. Company Overview
- 13.1.8.2. Products
- 13.1.8.3. Company Financials
- 13.1.8.4. SWOT Analysis
- 13.1.1 GEA Group Aktiengesellschaft
- 13.2. Market Entropy
- 13.2.1 Company's Key Areas Served
- 13.2.2 Recent Developments
- 13.3. Company Market Share Analysis 2025
- 13.3.1 Top 5 Companies Market Share Analysis
- 13.3.2 Top 3 Companies Market Share Analysis
- 13.4. List of Potential Customers
- 14. Research Methodology
List of Figures
- Figure 1: Global Carbonated Beverage Processing Equipment Market Revenue Breakdown (billion, %) by Region 2025 & 2033
- Figure 2: North America Carbonated Beverage Processing Equipment Market Revenue (billion), by Equipment Type 2025 & 2033
- Figure 3: North America Carbonated Beverage Processing Equipment Market Revenue Share (%), by Equipment Type 2025 & 2033
- Figure 4: North America Carbonated Beverage Processing Equipment Market Revenue (billion), by Beverage Type 2025 & 2033
- Figure 5: North America Carbonated Beverage Processing Equipment Market Revenue Share (%), by Beverage Type 2025 & 2033
- Figure 6: North America Carbonated Beverage Processing Equipment Market Revenue (billion), by Country 2025 & 2033
- Figure 7: North America Carbonated Beverage Processing Equipment Market Revenue Share (%), by Country 2025 & 2033
- Figure 8: Europe Carbonated Beverage Processing Equipment Market Revenue (billion), by Equipment Type 2025 & 2033
- Figure 9: Europe Carbonated Beverage Processing Equipment Market Revenue Share (%), by Equipment Type 2025 & 2033
- Figure 10: Europe Carbonated Beverage Processing Equipment Market Revenue (billion), by Beverage Type 2025 & 2033
- Figure 11: Europe Carbonated Beverage Processing Equipment Market Revenue Share (%), by Beverage Type 2025 & 2033
- Figure 12: Europe Carbonated Beverage Processing Equipment Market Revenue (billion), by Country 2025 & 2033
- Figure 13: Europe Carbonated Beverage Processing Equipment Market Revenue Share (%), by Country 2025 & 2033
- Figure 14: Asia Pacific Carbonated Beverage Processing Equipment Market Revenue (billion), by Equipment Type 2025 & 2033
- Figure 15: Asia Pacific Carbonated Beverage Processing Equipment Market Revenue Share (%), by Equipment Type 2025 & 2033
- Figure 16: Asia Pacific Carbonated Beverage Processing Equipment Market Revenue (billion), by Beverage Type 2025 & 2033
- Figure 17: Asia Pacific Carbonated Beverage Processing Equipment Market Revenue Share (%), by Beverage Type 2025 & 2033
- Figure 18: Asia Pacific Carbonated Beverage Processing Equipment Market Revenue (billion), by Country 2025 & 2033
- Figure 19: Asia Pacific Carbonated Beverage Processing Equipment Market Revenue Share (%), by Country 2025 & 2033
- Figure 20: South America Carbonated Beverage Processing Equipment Market Revenue (billion), by Equipment Type 2025 & 2033
- Figure 21: South America Carbonated Beverage Processing Equipment Market Revenue Share (%), by Equipment Type 2025 & 2033
- Figure 22: South America Carbonated Beverage Processing Equipment Market Revenue (billion), by Beverage Type 2025 & 2033
- Figure 23: South America Carbonated Beverage Processing Equipment Market Revenue Share (%), by Beverage Type 2025 & 2033
- Figure 24: South America Carbonated Beverage Processing Equipment Market Revenue (billion), by Country 2025 & 2033
- Figure 25: South America Carbonated Beverage Processing Equipment Market Revenue Share (%), by Country 2025 & 2033
- Figure 26: Middle East Carbonated Beverage Processing Equipment Market Revenue (billion), by Equipment Type 2025 & 2033
- Figure 27: Middle East Carbonated Beverage Processing Equipment Market Revenue Share (%), by Equipment Type 2025 & 2033
- Figure 28: Middle East Carbonated Beverage Processing Equipment Market Revenue (billion), by Beverage Type 2025 & 2033
- Figure 29: Middle East Carbonated Beverage Processing Equipment Market Revenue Share (%), by Beverage Type 2025 & 2033
- Figure 30: Middle East Carbonated Beverage Processing Equipment Market Revenue (billion), by Country 2025 & 2033
- Figure 31: Middle East Carbonated Beverage Processing Equipment Market Revenue Share (%), by Country 2025 & 2033
- Figure 32: South Africa Carbonated Beverage Processing Equipment Market Revenue (billion), by Equipment Type 2025 & 2033
- Figure 33: South Africa Carbonated Beverage Processing Equipment Market Revenue Share (%), by Equipment Type 2025 & 2033
- Figure 34: South Africa Carbonated Beverage Processing Equipment Market Revenue (billion), by Beverage Type 2025 & 2033
- Figure 35: South Africa Carbonated Beverage Processing Equipment Market Revenue Share (%), by Beverage Type 2025 & 2033
- Figure 36: South Africa Carbonated Beverage Processing Equipment Market Revenue (billion), by Country 2025 & 2033
- Figure 37: South Africa Carbonated Beverage Processing Equipment Market Revenue Share (%), by Country 2025 & 2033
List of Tables
- Table 1: Global Carbonated Beverage Processing Equipment Market Revenue billion Forecast, by Equipment Type 2020 & 2033
- Table 2: Global Carbonated Beverage Processing Equipment Market Revenue billion Forecast, by Beverage Type 2020 & 2033
- Table 3: Global Carbonated Beverage Processing Equipment Market Revenue billion Forecast, by Region 2020 & 2033
- Table 4: Global Carbonated Beverage Processing Equipment Market Revenue billion Forecast, by Equipment Type 2020 & 2033
- Table 5: Global Carbonated Beverage Processing Equipment Market Revenue billion Forecast, by Beverage Type 2020 & 2033
- Table 6: Global Carbonated Beverage Processing Equipment Market Revenue billion Forecast, by Country 2020 & 2033
- Table 7: United States Carbonated Beverage Processing Equipment Market Revenue (billion) Forecast, by Application 2020 & 2033
- Table 8: Canada Carbonated Beverage Processing Equipment Market Revenue (billion) Forecast, by Application 2020 & 2033
- Table 9: Mexico Carbonated Beverage Processing Equipment Market Revenue (billion) Forecast, by Application 2020 & 2033
- Table 10: Rest of North America Carbonated Beverage Processing Equipment Market Revenue (billion) Forecast, by Application 2020 & 2033
- Table 11: Global Carbonated Beverage Processing Equipment Market Revenue billion Forecast, by Equipment Type 2020 & 2033
- Table 12: Global Carbonated Beverage Processing Equipment Market Revenue billion Forecast, by Beverage Type 2020 & 2033
- Table 13: Global Carbonated Beverage Processing Equipment Market Revenue billion Forecast, by Country 2020 & 2033
- Table 14: Germany Carbonated Beverage Processing Equipment Market Revenue (billion) Forecast, by Application 2020 & 2033
- Table 15: United Kingdom Carbonated Beverage Processing Equipment Market Revenue (billion) Forecast, by Application 2020 & 2033
- Table 16: France Carbonated Beverage Processing Equipment Market Revenue (billion) Forecast, by Application 2020 & 2033
- Table 17: Russia Carbonated Beverage Processing Equipment Market Revenue (billion) Forecast, by Application 2020 & 2033
- Table 18: Spain Carbonated Beverage Processing Equipment Market Revenue (billion) Forecast, by Application 2020 & 2033
- Table 19: Italy Carbonated Beverage Processing Equipment Market Revenue (billion) Forecast, by Application 2020 & 2033
- Table 20: Rest of Europe Carbonated Beverage Processing Equipment Market Revenue (billion) Forecast, by Application 2020 & 2033
- Table 21: Global Carbonated Beverage Processing Equipment Market Revenue billion Forecast, by Equipment Type 2020 & 2033
- Table 22: Global Carbonated Beverage Processing Equipment Market Revenue billion Forecast, by Beverage Type 2020 & 2033
- Table 23: Global Carbonated Beverage Processing Equipment Market Revenue billion Forecast, by Country 2020 & 2033
- Table 24: India Carbonated Beverage Processing Equipment Market Revenue (billion) Forecast, by Application 2020 & 2033
- Table 25: China Carbonated Beverage Processing Equipment Market Revenue (billion) Forecast, by Application 2020 & 2033
- Table 26: Japan Carbonated Beverage Processing Equipment Market Revenue (billion) Forecast, by Application 2020 & 2033
- Table 27: Australia Carbonated Beverage Processing Equipment Market Revenue (billion) Forecast, by Application 2020 & 2033
- Table 28: Rest of Asia Pacific Carbonated Beverage Processing Equipment Market Revenue (billion) Forecast, by Application 2020 & 2033
- Table 29: Global Carbonated Beverage Processing Equipment Market Revenue billion Forecast, by Equipment Type 2020 & 2033
- Table 30: Global Carbonated Beverage Processing Equipment Market Revenue billion Forecast, by Beverage Type 2020 & 2033
- Table 31: Global Carbonated Beverage Processing Equipment Market Revenue billion Forecast, by Country 2020 & 2033
- Table 32: Brazil Carbonated Beverage Processing Equipment Market Revenue (billion) Forecast, by Application 2020 & 2033
- Table 33: Colombia Carbonated Beverage Processing Equipment Market Revenue (billion) Forecast, by Application 2020 & 2033
- Table 34: Rest of South America Carbonated Beverage Processing Equipment Market Revenue (billion) Forecast, by Application 2020 & 2033
- Table 35: Global Carbonated Beverage Processing Equipment Market Revenue billion Forecast, by Equipment Type 2020 & 2033
- Table 36: Global Carbonated Beverage Processing Equipment Market Revenue billion Forecast, by Beverage Type 2020 & 2033
- Table 37: Global Carbonated Beverage Processing Equipment Market Revenue billion Forecast, by Country 2020 & 2033
- Table 38: Global Carbonated Beverage Processing Equipment Market Revenue billion Forecast, by Equipment Type 2020 & 2033
- Table 39: Global Carbonated Beverage Processing Equipment Market Revenue billion Forecast, by Beverage Type 2020 & 2033
- Table 40: Global Carbonated Beverage Processing Equipment Market Revenue billion Forecast, by Country 2020 & 2033
- Table 41: Saudi Arabia Carbonated Beverage Processing Equipment Market Revenue (billion) Forecast, by Application 2020 & 2033
- Table 42: Rest of Middle East Carbonated Beverage Processing Equipment Market Revenue (billion) Forecast, by Application 2020 & 2033
Frequently Asked Questions
1. What is the projected Compound Annual Growth Rate (CAGR) of the Carbonated Beverage Processing Equipment Market?
The projected CAGR is approximately 5.1%.
2. Which companies are prominent players in the Carbonated Beverage Processing Equipment Market?
Key companies in the market include GEA Group Aktiengesellschaft, KHS Group, Krones AG, Zoppas Industries SpA, SPX Flow Inc, Tetra Laval International SA, A DUE SpA, Alfa Laval AB.
3. What are the main segments of the Carbonated Beverage Processing Equipment Market?
The market segments include Equipment Type, Beverage Type.
4. Can you provide details about the market size?
The market size is estimated to be USD 7.28 billion as of 2022.
5. What are some drivers contributing to market growth?
Despite the rise in health-consciousness. carbonated beverages remain popular globally. especially in emerging markets. The consistent demand for sodas. sparkling water. and flavored carbonated drinks drives the need for advanced processing equipment..
6. What are the notable trends driving market growth?
The integration of automation and Internet of Things (IoT) technologies into beverage processing equipment is a growing trend. Automated systems enable real-time monitoring. predictive maintenance. and improved operational efficiency. which are increasingly important in modern production facilities..
7. Are there any restraints impacting market growth?
Growing awareness of the health risks associated with excessive sugar consumption is leading to a decline in the consumption of traditional carbonated soft drinks. This shift towards healthier beverages. such as non-carbonated juices. teas. and functional drinks. can restrain the growth of the carbonated beverage processing equipment market..
8. Can you provide examples of recent developments in the market?
N/A
9. What pricing options are available for accessing the report?
Pricing options include single-user, multi-user, and enterprise licenses priced at USD 4750, USD 5250, and USD 8750 respectively.
10. Is the market size provided in terms of value or volume?
The market size is provided in terms of value, measured in billion.
11. Are there any specific market keywords associated with the report?
Yes, the market keyword associated with the report is "Carbonated Beverage Processing Equipment Market," which aids in identifying and referencing the specific market segment covered.
12. How do I determine which pricing option suits my needs best?
The pricing options vary based on user requirements and access needs. Individual users may opt for single-user licenses, while businesses requiring broader access may choose multi-user or enterprise licenses for cost-effective access to the report.
13. Are there any additional resources or data provided in the Carbonated Beverage Processing Equipment Market report?
While the report offers comprehensive insights, it's advisable to review the specific contents or supplementary materials provided to ascertain if additional resources or data are available.
14. How can I stay updated on further developments or reports in the Carbonated Beverage Processing Equipment Market?
To stay informed about further developments, trends, and reports in the Carbonated Beverage Processing Equipment Market, consider subscribing to industry newsletters, following relevant companies and organizations, or regularly checking reputable industry news sources and publications.
Methodology
Step 1 - Identification of Relevant Samples Size from Population Database


Step 2 - Approaches for Defining Global Market Size (Value, Volume* & Price*)

Note*: In applicable scenarios
Step 3 - Data Sources
Primary Research
- Web Analytics
- Survey Reports
- Research Institute
- Latest Research Reports
- Opinion Leaders
Secondary Research
- Annual Reports
- White Paper
- Latest Press Release
- Industry Association
- Paid Database
- Investor Presentations

Step 4 - Data Triangulation
Involves using different sources of information in order to increase the validity of a study
These sources are likely to be stakeholders in a program - participants, other researchers, program staff, other community members, and so on.
Then we put all data in single framework & apply various statistical tools to find out the dynamic on the market.
During the analysis stage, feedback from the stakeholder groups would be compared to determine areas of agreement as well as areas of divergence