

Key Insights
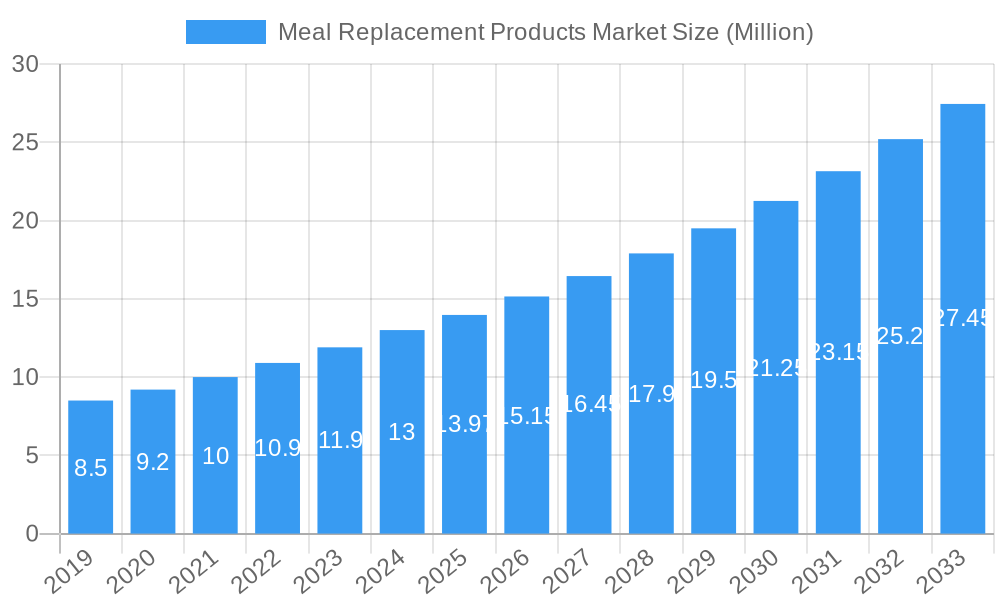
The global Meal Replacement Products market is poised for robust expansion, projected to reach a substantial USD 13.97 billion by 2025, with a compelling Compound Annual Growth Rate (CAGR) of 8.26% expected to propel it further through 2033. This significant growth is fueled by an increasing consumer focus on health and wellness, a desire for convenient and time-saving dietary solutions, and a rising prevalence of lifestyle-related health concerns such as obesity and diabetes. The demand for scientifically formulated and nutritionally balanced meal replacements is intensifying as consumers become more health-conscious and seek effective ways to manage their weight and overall well-being. This trend is further amplified by the growing acceptance of meal replacement shakes and bars as legitimate dietary aids, moving beyond niche markets to gain broader consumer appeal. The market's expansion is also being driven by product innovation, with manufacturers introducing a wider array of flavors, formats, and specialized formulations to cater to diverse dietary needs and preferences, including plant-based options, low-sugar variants, and those fortified with specific vitamins and minerals.
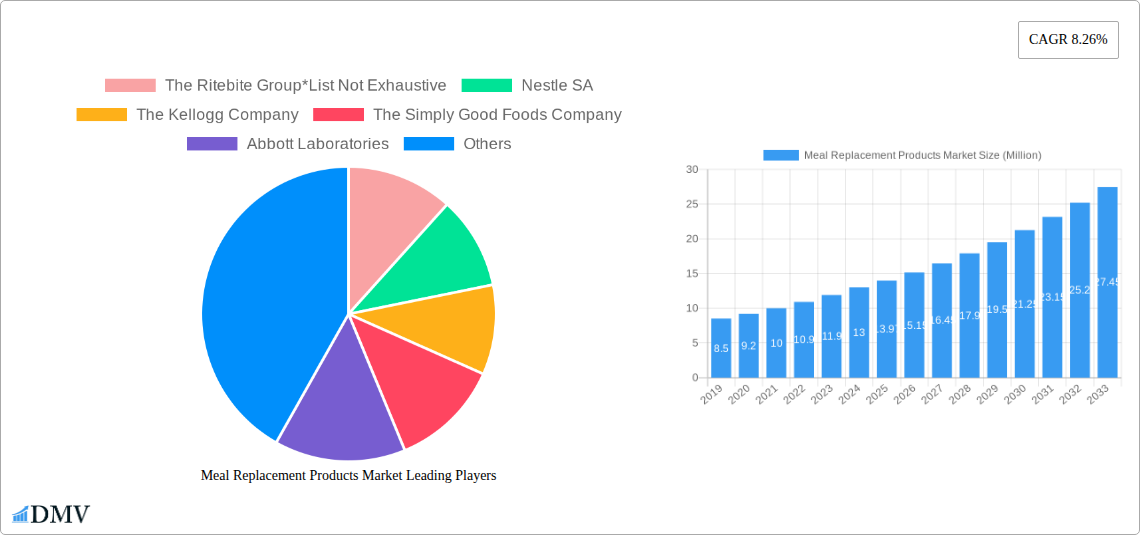
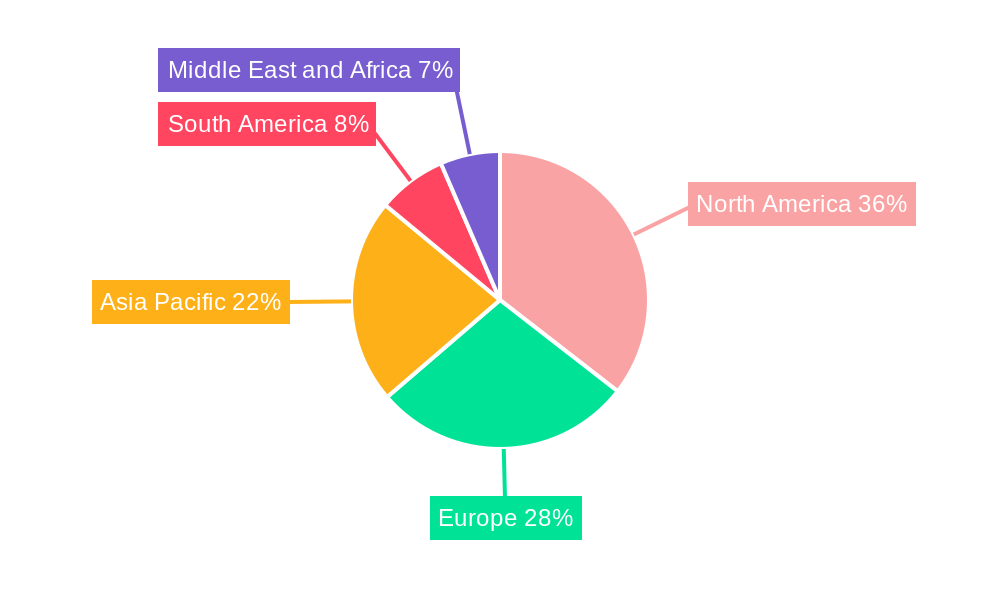
Meal Replacement Products Market Market Size (In Million)
The market's segmentation by product type highlights the dominance of Ready-to-drink Products and Powdered Products, reflecting their convenience and versatility for consumers seeking quick and easy meal solutions. Nutritional Bars also command a significant share, offering portability and a satisfying alternative for on-the-go consumption. Distribution channels are evolving, with Online Retailers emerging as a crucial avenue for reaching a wider customer base, complementing traditional channels like Hypermarkets/Supermarkets and Convenience Stores. Geographically, North America and Europe are leading the market, driven by high disposable incomes, established health and wellness trends, and a strong consumer base for functional foods. However, the Asia Pacific region presents a substantial growth opportunity, with increasing urbanization, rising disposable incomes, and a growing awareness of health and nutrition driving demand. Key players like Nestle SA, The Kellogg Company, and The Ritebite Group are actively investing in research and development, expanding their product portfolios, and strengthening their distribution networks to capitalize on these burgeoning market opportunities and address evolving consumer demands.
Meal Replacement Products Market Company Market Share
Unlock critical insights into the burgeoning meal replacement products market with this in-depth report. Explore market dynamics, key trends, and future opportunities for nutritional bars, powdered meal replacements, and ready-to-drink shakes. Understand the competitive landscape shaped by giants like Nestle SA, The Kellogg Company, and Abbott Laboratories, and identify strategies for growth across convenience stores, hypermarkets/supermarkets, and online retailers. This report, covering the study period 2019–2033 with a base year of 2025, provides a strategic roadmap for stakeholders seeking to capitalize on this expanding sector.
Meal Replacement Products Market Market Composition & Trends
The meal replacement products market exhibits a moderately concentrated structure, with leading players like Nestle SA and The Kellogg Company holding significant market share. Innovation remains a key catalyst, driven by rising consumer demand for convenient, healthy, and personalized nutrition solutions. Regulatory landscapes, particularly concerning health claims and ingredient transparency, are evolving, influencing product development and marketing strategies. Substitute products, ranging from traditional snacks to specialized dietary supplements, pose a competitive challenge, necessitating continuous product differentiation. End-user profiles are diversifying, encompassing busy professionals, fitness enthusiasts, individuals managing weight, and those seeking convenient nutritional alternatives. Mergers and acquisitions are expected to continue shaping the market landscape, with recent M&A deal values projected to reach xx Million, further consolidating market positions and expanding product portfolios. Market share distribution is dynamically influenced by product innovation and effective distribution strategies.
Meal Replacement Products Market Industry Evolution
The meal replacement products market has witnessed remarkable evolution, driven by a confluence of factors including escalating health consciousness, increased adoption of on-the-go lifestyles, and significant technological advancements in food science and formulation. The market growth trajectory has been consistently upward, propelled by a growing consumer base seeking convenient yet nutritionally balanced alternatives to traditional meals. This demand surge is underpinned by a growing awareness of the importance of controlled calorie intake and balanced macronutrient profiles for weight management and overall well-being. Technological advancements have played a pivotal role, enabling the development of more palatable, diverse, and nutrient-dense meal replacement options. Innovations in processing techniques have led to extended shelf-life and improved texture, enhancing consumer appeal. Furthermore, the integration of digital platforms and e-commerce has revolutionized accessibility, allowing brands to reach a wider demographic and offer personalized nutrition plans. The market's growth rate has averaged an impressive xx% annually over the historical period, with projections indicating a sustained expansion of approximately xx% to xx% during the forecast period (2025–2033). Adoption metrics for new product formulations, particularly those emphasizing plant-based ingredients and allergen-free options, have seen a substantial uptick, reflecting shifting consumer preferences towards cleaner labels and sustainable sourcing. The increasing prevalence of chronic diseases and the growing emphasis on preventative healthcare also contribute to the sustained demand for scientifically formulated meal replacements designed to support specific health goals.
Leading Regions, Countries, or Segments in Meal Replacement Products Market
North America currently dominates the meal replacement products market, driven by a highly health-conscious consumer base, a well-established retail infrastructure, and a strong presence of leading manufacturers. The United States, in particular, spearheads this dominance due to high disposable incomes, a robust demand for convenient food solutions, and widespread adoption of weight management programs.
Product Type Dominance:
- Ready-to-drink Products: This segment holds the largest market share, accounting for an estimated xx% of the total market value in 2025. Key drivers include their ultimate convenience, immediate consumption capability, and wide variety of flavors and formulations catering to diverse dietary needs and preferences. Investment trends are heavily skewed towards developing innovative ready-to-drink formulations with enhanced nutritional profiles and appealing taste.
- Nutritional Bars: These represent a significant segment, projected to grow at a CAGR of xx% from 2025 to 2033. Their portability, satisfying texture, and ability to provide sustained energy make them a popular choice for on-the-go consumption. Regulatory support for clear nutritional labeling and health claims further bolsters their appeal.
- Powdered Products: While a mature segment, powdered meal replacements continue to hold a substantial market share due to their cost-effectiveness and versatility, allowing consumers to customize their intake. Growing interest in DIY nutrition and cost-conscious consumers contribute to its sustained demand.
- Other Product Types: This encompasses innovative formats like ready-to-eat meals and meal replacement pouches, which are gaining traction due to their convenience and evolving consumer demand for complete meal solutions.
Distribution Channel Dominance:
- Hypermarkets/Supermarkets: This channel remains a dominant force, contributing approximately xx% to the overall market revenue. Their extensive reach, ability to offer a wide product assortment, and competitive pricing make them a preferred destination for many consumers. Investment in prime shelf placement and promotional activities by manufacturers further solidifies their position.
- Online Retailers: This channel is experiencing the fastest growth, with an anticipated CAGR of xx% during the forecast period. Factors driving this growth include increasing internet penetration, the convenience of home delivery, personalized recommendations, and the ability to access niche and specialized products not readily available in brick-and-mortar stores. Regulatory support for e-commerce and digital marketing initiatives are key drivers.
- Convenience Stores: These cater to immediate consumption needs, offering a convenient option for impulse purchases. Their strategic locations in high-traffic areas ensure consistent sales, particularly for ready-to-drink products.
- Specialty Stores: This segment, though smaller, caters to a niche market seeking specialized dietary products, catering to specific health conditions or dietary restrictions.
Meal Replacement Products Market Product Innovations
Product innovation in the meal replacement products market is a driving force for growth. Companies are increasingly focusing on developing plant-based formulations, utilizing novel protein sources like pea, soy, and algae to cater to vegan and vegetarian consumers. Innovations in flavor profiles are also paramount, moving beyond traditional vanilla and chocolate to offer more sophisticated and appealing tastes. Advanced encapsulation technologies are being employed to enhance nutrient stability and bioavailability, ensuring maximum efficacy. Performance metrics like protein content (ranging from 17 to 24g), calorie count (under 270 calories), and the inclusion of essential vitamins and minerals are crucial selling propositions. The development of allergen-free and gluten-free options further expands the market reach, addressing growing consumer concerns about dietary restrictions and sensitivities.
Propelling Factors for Meal Replacement Products Market Growth
The meal replacement products market is propelled by a synergistic blend of technological, economic, and societal influences. The escalating global health and wellness trend, coupled with a heightened awareness of nutritional needs for weight management and disease prevention, is a primary driver. Economic factors, such as increasing disposable incomes in emerging economies and the demand for time-saving solutions in fast-paced urban lifestyles, contribute significantly. Technological advancements in food science enable the creation of more palatable, diverse, and scientifically formulated meal replacements. Furthermore, the growing popularity of fitness and active lifestyles fuels demand for convenient post-workout nutrition and general dietary support. Regulatory bodies are also increasingly recognizing and supporting the role of scientifically validated nutritional products in public health initiatives.
Obstacles in the Meal Replacement Products Market Market
Despite robust growth, the meal replacement products market faces several obstacles. Stringent regulatory frameworks governing health claims and product labeling can pose challenges for manufacturers seeking to highlight specific benefits. Perceptions of meal replacements as artificial or less natural than whole foods can also deter some consumer segments. Supply chain disruptions, particularly for specialized ingredients, can impact production and cost-effectiveness. Intense competition from both established players and new market entrants necessitates continuous innovation and competitive pricing strategies, potentially squeezing profit margins. The cost of premium ingredients and advanced formulations can also limit affordability for a broader consumer base.
Future Opportunities in Meal Replacement Products Market
The meal replacement products market is brimming with future opportunities. The burgeoning plant-based food trend presents a significant avenue for innovation, with demand for vegan and sustainable meal replacements expected to soar. Personalized nutrition, leveraging AI and consumer data, will allow for tailored meal replacement solutions addressing individual needs and preferences. Emerging markets in Asia and Latin America, with their rapidly growing middle class and increasing health consciousness, offer substantial untapped potential. Furthermore, the integration of meal replacements into broader wellness ecosystems, including fitness apps and wearable technology, will create new avenues for engagement and sales. Technological advancements in sustainable packaging and ingredient sourcing will also appeal to eco-conscious consumers.
Major Players in the Meal Replacement Products Market Ecosystem
The Ritebite Group, Nestle SA, The Kellogg Company, The Simply Good Foods Company, Abbott Laboratories, Amway Corp (Alticor), Glanbia PLC, The Kraft Heinz Company, Herbalife Nutrition, Bob's Red Mill Natural Foods.
Key Developments in Meal Replacement Products Market Industry
- November 2022: Levana Nourishment introduced a line of plant-based meal replacement shakes in vanilla bean, mixed berry, and cocoa-coffee varieties, catering to the growing vegan and health-conscious consumer base.
- March 2022: Southern Charm Nutrition opened its outlet in downtown Fairmont, offering a range of full meal replacement shakes, emphasizing high protein content (17 to 24 g), low calorie count (under 270 calories), and diverse flavor options, highlighting a trend towards specialized retail outlets.
- February 2021: United States-based Veji Holdings released Heal plant-based meal replacements. These products are targeted at patients and athletes and are claimed to be vegan, gluten-free, non-GMO, and developed to meet Health Canada guidelines, showcasing a focus on specialized and health-aligned formulations.
Strategic Meal Replacement Products Market Market Forecast
The meal replacement products market is poised for sustained and robust growth, driven by evolving consumer lifestyles and an increasing emphasis on health and convenience. Key growth catalysts include the persistent demand for on-the-go nutrition solutions, the expanding influence of plant-based diets, and advancements in personalized nutrition technologies. Emerging markets are expected to contribute significantly to this expansion, while established markets will continue to innovate with premium and specialized offerings. The market's potential is further amplified by ongoing research into the health benefits of balanced nutrition and the growing acceptance of meal replacements as a viable component of a healthy diet. Strategic investments in product development, distribution networks, and targeted marketing campaigns will be crucial for capitalizing on the anticipated market expansion.
Meal Replacement Products Market Segmentation
-
1. Product Type
- 1.1. Ready-to-drink Products
- 1.2. Nutritional Bars
- 1.3. Powdered Products
- 1.4. Other Product Types
-
2. Distribution Channel
- 2.1. Convenience Stores
- 2.2. Hypermarkets/Supermarkets
- 2.3. Specialty Stores
- 2.4. Online Retailers
- 2.5. Other Distribution Channels
Meal Replacement Products Market Segmentation By Geography
-
1. North America
- 1.1. United States
- 1.2. Canada
- 1.3. Mexico
- 1.4. Rest of North America
-
2. Europe
- 2.1. Germany
- 2.2. United Kingdom
- 2.3. Italy
- 2.4. Spain
- 2.5. France
- 2.6. Russia
- 2.7. Rest of Europe
-
3. Asia Pacific
- 3.1. China
- 3.2. Japan
- 3.3. India
- 3.4. Australia
- 3.5. Rest of Asia Pacific
-
4. South America
- 4.1. Brazil
- 4.2. Argentina
- 4.3. Rest of South America
-
5. Middle East and Africa
- 5.1. South Africa
- 5.2. United Arab Emirates
- 5.3. Rest of Middle East and Africa
Meal Replacement Products Market Regional Market Share
Geographic Coverage of Meal Replacement Products Market
Meal Replacement Products Market REPORT HIGHLIGHTS
| Aspects | Details |
|---|---|
| Study Period | 2020-2034 |
| Base Year | 2025 |
| Estimated Year | 2026 |
| Forecast Period | 2026-2034 |
| Historical Period | 2020-2025 |
| Growth Rate | CAGR of 8.26% from 2020-2034 |
| Segmentation |
|
Table of Contents
- 1. Introduction
- 1.1. Research Scope
- 1.2. Market Segmentation
- 1.3. Research Objective
- 1.4. Definitions and Assumptions
- 2. Executive Summary
- 2.1. Market Snapshot
- 3. Market Dynamics
- 3.1. Market Drivers
- 3.2. Market Restrains
- 3.3. Market Trends
- 3.4. Market Opportunities
- 4. Market Factor Analysis
- 4.1. Porters Five Forces
- 4.1.1. Bargaining Power of Suppliers
- 4.1.2. Bargaining Power of Buyers
- 4.1.3. Threat of New Entrants
- 4.1.4. Threat of Substitutes
- 4.1.5. Competitive Rivalry
- 4.2. PESTEL analysis
- 4.3. BCG Analysis
- 4.3.1. Stars (High Growth, High Market Share)
- 4.3.2. Cash Cows (Low Growth, High Market Share)
- 4.3.3. Question Mark (High Growth, Low Market Share)
- 4.3.4. Dogs (Low Growth, Low Market Share)
- 4.4. Ansoff Matrix Analysis
- 4.5. Supply Chain Analysis
- 4.6. Regulatory Landscape
- 4.7. Current Market Potential and Opportunity Assessment (TAM–SAM–SOM Framework)
- 4.8. DMV Analyst Note
- 4.1. Porters Five Forces
- 5. Market Analysis, Insights and Forecast 2021-2033
- 5.1. Market Analysis, Insights and Forecast - by Product Type
- 5.1.1. Ready-to-drink Products
- 5.1.2. Nutritional Bars
- 5.1.3. Powdered Products
- 5.1.4. Other Product Types
- 5.2. Market Analysis, Insights and Forecast - by Distribution Channel
- 5.2.1. Convenience Stores
- 5.2.2. Hypermarkets/Supermarkets
- 5.2.3. Specialty Stores
- 5.2.4. Online Retailers
- 5.2.5. Other Distribution Channels
- 5.3. Market Analysis, Insights and Forecast - by Region
- 5.3.1. North America
- 5.3.2. Europe
- 5.3.3. Asia Pacific
- 5.3.4. South America
- 5.3.5. Middle East and Africa
- 5.1. Market Analysis, Insights and Forecast - by Product Type
- 6. Global Meal Replacement Products Market Analysis, Insights and Forecast, 2021-2033
- 6.1. Market Analysis, Insights and Forecast - by Product Type
- 6.1.1. Ready-to-drink Products
- 6.1.2. Nutritional Bars
- 6.1.3. Powdered Products
- 6.1.4. Other Product Types
- 6.2. Market Analysis, Insights and Forecast - by Distribution Channel
- 6.2.1. Convenience Stores
- 6.2.2. Hypermarkets/Supermarkets
- 6.2.3. Specialty Stores
- 6.2.4. Online Retailers
- 6.2.5. Other Distribution Channels
- 6.1. Market Analysis, Insights and Forecast - by Product Type
- 7. North America Meal Replacement Products Market Analysis, Insights and Forecast, 2020-2032
- 7.1. Market Analysis, Insights and Forecast - by Product Type
- 7.1.1. Ready-to-drink Products
- 7.1.2. Nutritional Bars
- 7.1.3. Powdered Products
- 7.1.4. Other Product Types
- 7.2. Market Analysis, Insights and Forecast - by Distribution Channel
- 7.2.1. Convenience Stores
- 7.2.2. Hypermarkets/Supermarkets
- 7.2.3. Specialty Stores
- 7.2.4. Online Retailers
- 7.2.5. Other Distribution Channels
- 7.1. Market Analysis, Insights and Forecast - by Product Type
- 8. Europe Meal Replacement Products Market Analysis, Insights and Forecast, 2020-2032
- 8.1. Market Analysis, Insights and Forecast - by Product Type
- 8.1.1. Ready-to-drink Products
- 8.1.2. Nutritional Bars
- 8.1.3. Powdered Products
- 8.1.4. Other Product Types
- 8.2. Market Analysis, Insights and Forecast - by Distribution Channel
- 8.2.1. Convenience Stores
- 8.2.2. Hypermarkets/Supermarkets
- 8.2.3. Specialty Stores
- 8.2.4. Online Retailers
- 8.2.5. Other Distribution Channels
- 8.1. Market Analysis, Insights and Forecast - by Product Type
- 9. Asia Pacific Meal Replacement Products Market Analysis, Insights and Forecast, 2020-2032
- 9.1. Market Analysis, Insights and Forecast - by Product Type
- 9.1.1. Ready-to-drink Products
- 9.1.2. Nutritional Bars
- 9.1.3. Powdered Products
- 9.1.4. Other Product Types
- 9.2. Market Analysis, Insights and Forecast - by Distribution Channel
- 9.2.1. Convenience Stores
- 9.2.2. Hypermarkets/Supermarkets
- 9.2.3. Specialty Stores
- 9.2.4. Online Retailers
- 9.2.5. Other Distribution Channels
- 9.1. Market Analysis, Insights and Forecast - by Product Type
- 10. South America Meal Replacement Products Market Analysis, Insights and Forecast, 2020-2032
- 10.1. Market Analysis, Insights and Forecast - by Product Type
- 10.1.1. Ready-to-drink Products
- 10.1.2. Nutritional Bars
- 10.1.3. Powdered Products
- 10.1.4. Other Product Types
- 10.2. Market Analysis, Insights and Forecast - by Distribution Channel
- 10.2.1. Convenience Stores
- 10.2.2. Hypermarkets/Supermarkets
- 10.2.3. Specialty Stores
- 10.2.4. Online Retailers
- 10.2.5. Other Distribution Channels
- 10.1. Market Analysis, Insights and Forecast - by Product Type
- 11. Middle East and Africa Meal Replacement Products Market Analysis, Insights and Forecast, 2020-2032
- 11.1. Market Analysis, Insights and Forecast - by Product Type
- 11.1.1. Ready-to-drink Products
- 11.1.2. Nutritional Bars
- 11.1.3. Powdered Products
- 11.1.4. Other Product Types
- 11.2. Market Analysis, Insights and Forecast - by Distribution Channel
- 11.2.1. Convenience Stores
- 11.2.2. Hypermarkets/Supermarkets
- 11.2.3. Specialty Stores
- 11.2.4. Online Retailers
- 11.2.5. Other Distribution Channels
- 11.1. Market Analysis, Insights and Forecast - by Product Type
- 12. Competitive Analysis
- 12.1. Company Profiles
- 12.1.1 The Ritebite Group*List Not Exhaustive
- 12.1.1.1. Company Overview
- 12.1.1.2. Products
- 12.1.1.3. Company Financials
- 12.1.1.4. SWOT Analysis
- 12.1.2 Nestle SA
- 12.1.2.1. Company Overview
- 12.1.2.2. Products
- 12.1.2.3. Company Financials
- 12.1.2.4. SWOT Analysis
- 12.1.3 The Kellogg Company
- 12.1.3.1. Company Overview
- 12.1.3.2. Products
- 12.1.3.3. Company Financials
- 12.1.3.4. SWOT Analysis
- 12.1.4 The Simply Good Foods Company
- 12.1.4.1. Company Overview
- 12.1.4.2. Products
- 12.1.4.3. Company Financials
- 12.1.4.4. SWOT Analysis
- 12.1.5 Abbott Laboratories
- 12.1.5.1. Company Overview
- 12.1.5.2. Products
- 12.1.5.3. Company Financials
- 12.1.5.4. SWOT Analysis
- 12.1.6 Amway Corp (Alticor)
- 12.1.6.1. Company Overview
- 12.1.6.2. Products
- 12.1.6.3. Company Financials
- 12.1.6.4. SWOT Analysis
- 12.1.7 Glanbia PLC
- 12.1.7.1. Company Overview
- 12.1.7.2. Products
- 12.1.7.3. Company Financials
- 12.1.7.4. SWOT Analysis
- 12.1.8 The Kraft Heinz Company
- 12.1.8.1. Company Overview
- 12.1.8.2. Products
- 12.1.8.3. Company Financials
- 12.1.8.4. SWOT Analysis
- 12.1.9 Herbalife Nutrition
- 12.1.9.1. Company Overview
- 12.1.9.2. Products
- 12.1.9.3. Company Financials
- 12.1.9.4. SWOT Analysis
- 12.1.10 Bob's Red Mill Natural Foods
- 12.1.10.1. Company Overview
- 12.1.10.2. Products
- 12.1.10.3. Company Financials
- 12.1.10.4. SWOT Analysis
- 12.1.1 The Ritebite Group*List Not Exhaustive
- 12.2. Market Entropy
- 12.2.1 Company's Key Areas Served
- 12.2.2 Recent Developments
- 12.3. Company Market Share Analysis 2025
- 12.3.1 Top 5 Companies Market Share Analysis
- 12.3.2 Top 3 Companies Market Share Analysis
- 12.4. List of Potential Customers
- 13. Research Methodology
List of Figures
- Figure 1: Global Meal Replacement Products Market Revenue Breakdown (Million, %) by Region 2025 & 2033
- Figure 2: North America Meal Replacement Products Market Revenue (Million), by Product Type 2025 & 2033
- Figure 3: North America Meal Replacement Products Market Revenue Share (%), by Product Type 2025 & 2033
- Figure 4: North America Meal Replacement Products Market Revenue (Million), by Distribution Channel 2025 & 2033
- Figure 5: North America Meal Replacement Products Market Revenue Share (%), by Distribution Channel 2025 & 2033
- Figure 6: North America Meal Replacement Products Market Revenue (Million), by Country 2025 & 2033
- Figure 7: North America Meal Replacement Products Market Revenue Share (%), by Country 2025 & 2033
- Figure 8: Europe Meal Replacement Products Market Revenue (Million), by Product Type 2025 & 2033
- Figure 9: Europe Meal Replacement Products Market Revenue Share (%), by Product Type 2025 & 2033
- Figure 10: Europe Meal Replacement Products Market Revenue (Million), by Distribution Channel 2025 & 2033
- Figure 11: Europe Meal Replacement Products Market Revenue Share (%), by Distribution Channel 2025 & 2033
- Figure 12: Europe Meal Replacement Products Market Revenue (Million), by Country 2025 & 2033
- Figure 13: Europe Meal Replacement Products Market Revenue Share (%), by Country 2025 & 2033
- Figure 14: Asia Pacific Meal Replacement Products Market Revenue (Million), by Product Type 2025 & 2033
- Figure 15: Asia Pacific Meal Replacement Products Market Revenue Share (%), by Product Type 2025 & 2033
- Figure 16: Asia Pacific Meal Replacement Products Market Revenue (Million), by Distribution Channel 2025 & 2033
- Figure 17: Asia Pacific Meal Replacement Products Market Revenue Share (%), by Distribution Channel 2025 & 2033
- Figure 18: Asia Pacific Meal Replacement Products Market Revenue (Million), by Country 2025 & 2033
- Figure 19: Asia Pacific Meal Replacement Products Market Revenue Share (%), by Country 2025 & 2033
- Figure 20: South America Meal Replacement Products Market Revenue (Million), by Product Type 2025 & 2033
- Figure 21: South America Meal Replacement Products Market Revenue Share (%), by Product Type 2025 & 2033
- Figure 22: South America Meal Replacement Products Market Revenue (Million), by Distribution Channel 2025 & 2033
- Figure 23: South America Meal Replacement Products Market Revenue Share (%), by Distribution Channel 2025 & 2033
- Figure 24: South America Meal Replacement Products Market Revenue (Million), by Country 2025 & 2033
- Figure 25: South America Meal Replacement Products Market Revenue Share (%), by Country 2025 & 2033
- Figure 26: Middle East and Africa Meal Replacement Products Market Revenue (Million), by Product Type 2025 & 2033
- Figure 27: Middle East and Africa Meal Replacement Products Market Revenue Share (%), by Product Type 2025 & 2033
- Figure 28: Middle East and Africa Meal Replacement Products Market Revenue (Million), by Distribution Channel 2025 & 2033
- Figure 29: Middle East and Africa Meal Replacement Products Market Revenue Share (%), by Distribution Channel 2025 & 2033
- Figure 30: Middle East and Africa Meal Replacement Products Market Revenue (Million), by Country 2025 & 2033
- Figure 31: Middle East and Africa Meal Replacement Products Market Revenue Share (%), by Country 2025 & 2033
List of Tables
- Table 1: Global Meal Replacement Products Market Revenue Million Forecast, by Product Type 2020 & 2033
- Table 2: Global Meal Replacement Products Market Revenue Million Forecast, by Distribution Channel 2020 & 2033
- Table 3: Global Meal Replacement Products Market Revenue Million Forecast, by Region 2020 & 2033
- Table 4: Global Meal Replacement Products Market Revenue Million Forecast, by Product Type 2020 & 2033
- Table 5: Global Meal Replacement Products Market Revenue Million Forecast, by Distribution Channel 2020 & 2033
- Table 6: Global Meal Replacement Products Market Revenue Million Forecast, by Country 2020 & 2033
- Table 7: United States Meal Replacement Products Market Revenue (Million) Forecast, by Application 2020 & 2033
- Table 8: Canada Meal Replacement Products Market Revenue (Million) Forecast, by Application 2020 & 2033
- Table 9: Mexico Meal Replacement Products Market Revenue (Million) Forecast, by Application 2020 & 2033
- Table 10: Rest of North America Meal Replacement Products Market Revenue (Million) Forecast, by Application 2020 & 2033
- Table 11: Global Meal Replacement Products Market Revenue Million Forecast, by Product Type 2020 & 2033
- Table 12: Global Meal Replacement Products Market Revenue Million Forecast, by Distribution Channel 2020 & 2033
- Table 13: Global Meal Replacement Products Market Revenue Million Forecast, by Country 2020 & 2033
- Table 14: Germany Meal Replacement Products Market Revenue (Million) Forecast, by Application 2020 & 2033
- Table 15: United Kingdom Meal Replacement Products Market Revenue (Million) Forecast, by Application 2020 & 2033
- Table 16: Italy Meal Replacement Products Market Revenue (Million) Forecast, by Application 2020 & 2033
- Table 17: Spain Meal Replacement Products Market Revenue (Million) Forecast, by Application 2020 & 2033
- Table 18: France Meal Replacement Products Market Revenue (Million) Forecast, by Application 2020 & 2033
- Table 19: Russia Meal Replacement Products Market Revenue (Million) Forecast, by Application 2020 & 2033
- Table 20: Rest of Europe Meal Replacement Products Market Revenue (Million) Forecast, by Application 2020 & 2033
- Table 21: Global Meal Replacement Products Market Revenue Million Forecast, by Product Type 2020 & 2033
- Table 22: Global Meal Replacement Products Market Revenue Million Forecast, by Distribution Channel 2020 & 2033
- Table 23: Global Meal Replacement Products Market Revenue Million Forecast, by Country 2020 & 2033
- Table 24: China Meal Replacement Products Market Revenue (Million) Forecast, by Application 2020 & 2033
- Table 25: Japan Meal Replacement Products Market Revenue (Million) Forecast, by Application 2020 & 2033
- Table 26: India Meal Replacement Products Market Revenue (Million) Forecast, by Application 2020 & 2033
- Table 27: Australia Meal Replacement Products Market Revenue (Million) Forecast, by Application 2020 & 2033
- Table 28: Rest of Asia Pacific Meal Replacement Products Market Revenue (Million) Forecast, by Application 2020 & 2033
- Table 29: Global Meal Replacement Products Market Revenue Million Forecast, by Product Type 2020 & 2033
- Table 30: Global Meal Replacement Products Market Revenue Million Forecast, by Distribution Channel 2020 & 2033
- Table 31: Global Meal Replacement Products Market Revenue Million Forecast, by Country 2020 & 2033
- Table 32: Brazil Meal Replacement Products Market Revenue (Million) Forecast, by Application 2020 & 2033
- Table 33: Argentina Meal Replacement Products Market Revenue (Million) Forecast, by Application 2020 & 2033
- Table 34: Rest of South America Meal Replacement Products Market Revenue (Million) Forecast, by Application 2020 & 2033
- Table 35: Global Meal Replacement Products Market Revenue Million Forecast, by Product Type 2020 & 2033
- Table 36: Global Meal Replacement Products Market Revenue Million Forecast, by Distribution Channel 2020 & 2033
- Table 37: Global Meal Replacement Products Market Revenue Million Forecast, by Country 2020 & 2033
- Table 38: South Africa Meal Replacement Products Market Revenue (Million) Forecast, by Application 2020 & 2033
- Table 39: United Arab Emirates Meal Replacement Products Market Revenue (Million) Forecast, by Application 2020 & 2033
- Table 40: Rest of Middle East and Africa Meal Replacement Products Market Revenue (Million) Forecast, by Application 2020 & 2033
Frequently Asked Questions
1. What is the projected Compound Annual Growth Rate (CAGR) of the Meal Replacement Products Market?
The projected CAGR is approximately 8.26%.
2. Which companies are prominent players in the Meal Replacement Products Market?
Key companies in the market include The Ritebite Group*List Not Exhaustive, Nestle SA, The Kellogg Company, The Simply Good Foods Company, Abbott Laboratories, Amway Corp (Alticor), Glanbia PLC, The Kraft Heinz Company, Herbalife Nutrition, Bob's Red Mill Natural Foods.
3. What are the main segments of the Meal Replacement Products Market?
The market segments include Product Type, Distribution Channel.
4. Can you provide details about the market size?
The market size is estimated to be USD 13.97 Million as of 2022.
5. What are some drivers contributing to market growth?
Increasing demand for healthy alternative food products; Advancements in vitamin infusion into food products.
6. What are the notable trends driving market growth?
Rising Demand for Convenient and Small-portion Food.
7. Are there any restraints impacting market growth?
Expensive pricing of vitamin-infused food products.
8. Can you provide examples of recent developments in the market?
November 2022: Levana Nourishment introduced a line of plant-based meal replacement shakes in vanilla bean, mixed berry, and cocoa-coffee varieties.
9. What pricing options are available for accessing the report?
Pricing options include single-user, multi-user, and enterprise licenses priced at USD 4750, USD 5250, and USD 8750 respectively.
10. Is the market size provided in terms of value or volume?
The market size is provided in terms of value, measured in Million.
11. Are there any specific market keywords associated with the report?
Yes, the market keyword associated with the report is "Meal Replacement Products Market," which aids in identifying and referencing the specific market segment covered.
12. How do I determine which pricing option suits my needs best?
The pricing options vary based on user requirements and access needs. Individual users may opt for single-user licenses, while businesses requiring broader access may choose multi-user or enterprise licenses for cost-effective access to the report.
13. Are there any additional resources or data provided in the Meal Replacement Products Market report?
While the report offers comprehensive insights, it's advisable to review the specific contents or supplementary materials provided to ascertain if additional resources or data are available.
14. How can I stay updated on further developments or reports in the Meal Replacement Products Market?
To stay informed about further developments, trends, and reports in the Meal Replacement Products Market, consider subscribing to industry newsletters, following relevant companies and organizations, or regularly checking reputable industry news sources and publications.
Methodology
Step 1 - Identification of Relevant Samples Size from Population Database


Step 2 - Approaches for Defining Global Market Size (Value, Volume* & Price*)

Note*: In applicable scenarios
Step 3 - Data Sources
Primary Research
- Web Analytics
- Survey Reports
- Research Institute
- Latest Research Reports
- Opinion Leaders
Secondary Research
- Annual Reports
- White Paper
- Latest Press Release
- Industry Association
- Paid Database
- Investor Presentations

Step 4 - Data Triangulation
Involves using different sources of information in order to increase the validity of a study
These sources are likely to be stakeholders in a program - participants, other researchers, program staff, other community members, and so on.
Then we put all data in single framework & apply various statistical tools to find out the dynamic on the market.
During the analysis stage, feedback from the stakeholder groups would be compared to determine areas of agreement as well as areas of divergence