

Key Insights
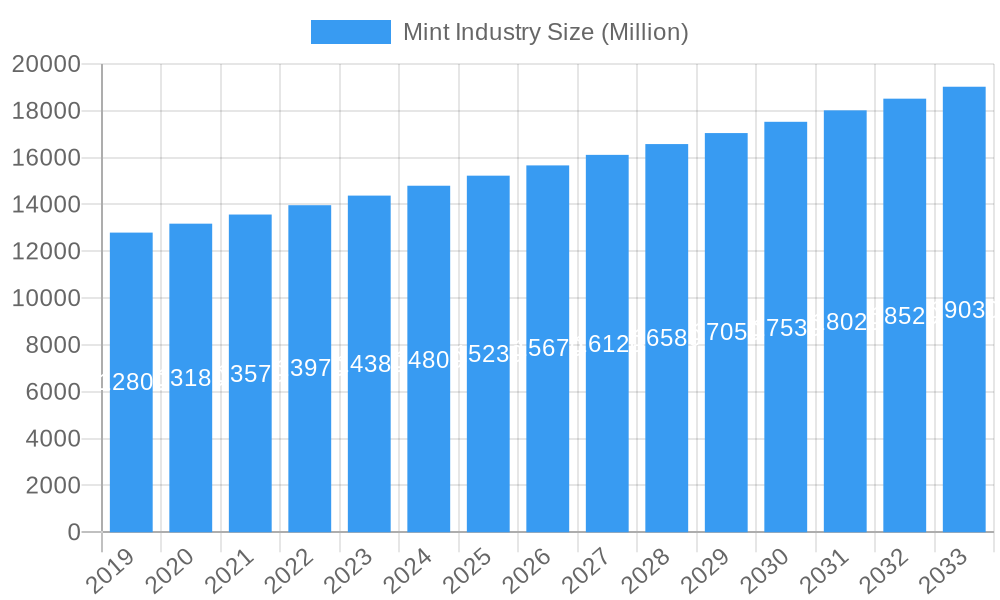
The global mint market is forecasted for substantial growth, projected to reach $7.74 billion by 2025, with a compound annual growth rate (CAGR) of 4.64% through 2033. This expansion is fueled by increasing consumer demand for breath fresheners, the perceived health advantages of mint, and the broad availability of mint-infused confectionery and oral care products. Market momentum is further bolstered by evolving consumer preferences for sugar-free and natural ingredient options. Product innovation, including functional mints offering benefits like stress relief or improved focus, is also a key driver of market penetration.
Mint Industry Market Size (In Billion)
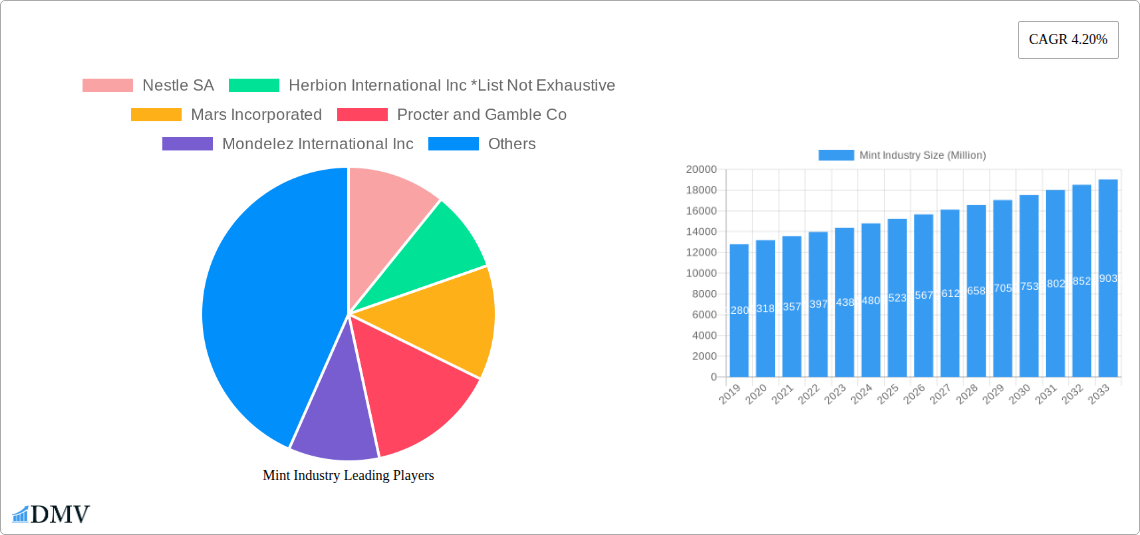
Distribution channels are varied, with supermarkets and hypermarkets leading, supported by convenience stores and pharmacies. Specialty retailers cater to specific market segments. Geographically, North America and Europe currently dominate due to high disposable incomes and established consumer habits. However, the Asia Pacific region is expected to experience significant growth, driven by a growing middle class, urbanization, and rising oral hygiene awareness. Leading companies such as Nestle SA, Mars Incorporated, and Mondelez International Inc. significantly influence market trends through their extensive product offerings and robust distribution networks. While fluctuating raw material costs and competition from alternatives present moderate challenges, strong consumer health consciousness and continuous product innovation are expected to drive sustained market expansion.
Mint Industry Company Market Share
Mint Industry Market Composition & Trends
This comprehensive report delves into the dynamic mint industry market, offering an in-depth analysis of its composition, evolving trends, and future trajectory. Examining the global mint market, we dissect key elements such as market concentration, innovation catalysts driving new product development, and the intricate regulatory landscapes shaping the industry. We also assess the impact of substitute products and the evolving profiles of end-users, from individual consumers to B2B applications. Mergers and acquisitions (M&A) activities are meticulously analyzed, providing insights into strategic consolidations and their impact on market share distribution. The report quantifies the market's robustness with projections indicating a market size of over XXXX Million in the forecast period. Key market share distribution insights reveal leading players holding significant portions of the market, with M&A deal values projected to reach over XXX Million as companies strategically consolidate their positions. This section aims to equip stakeholders with a foundational understanding of the forces shaping the confectionery mints market and the broader oral care mints market.
- Market Concentration: Analysis of leading companies and their respective market shares, indicating a moderately concentrated market.
- Innovation Catalysts: Focus on R&D investments in flavor profiles, functional benefits (e.g., sugar-free, enhanced breath freshening), and sustainable packaging.
- Regulatory Landscapes: Examination of food safety standards, labeling regulations, and health claims impacting product development and marketing across different regions.
- Substitute Products: Evaluation of alternatives like gum, lozenges, and breath sprays and their competitive impact.
- End-User Profiles: Segmentation of consumers based on demographics, purchasing behavior, and preference for specific product types.
- M&A Activities: Identification of key strategic acquisitions and partnerships, their rationale, and their influence on market consolidation.
Mint Industry Industry Evolution
The mint industry has undergone a significant transformation throughout the historical period (2019–2024) and is poised for substantial growth in the forecast period (2025–2033), with the base year (2025) serving as a critical pivot point. This section meticulously analyzes the market growth trajectories, charting the expansion from over XXX Million in 2019 to an anticipated over XXXX Million by 2033. Technological advancements have been instrumental in this evolution, with innovations in manufacturing processes, such as advanced cooling and compression techniques for power mints and standard mints, contributing to improved product quality and cost-effectiveness. We observe a notable shift in consumer demands, driven by increasing health consciousness and a desire for natural ingredients and sugar-free options. The adoption rate of these healthier alternatives has accelerated, with an estimated XX% increase in demand for sugar-free mints over the past five years. Furthermore, the penetration of mint products through diverse distribution channels, including supermarkets/hypermarkets, convenience stores, pharmacies, and specialist retailers, has broadened market access and driven sales volumes. The mint industry market size is projected to witness a Compound Annual Growth Rate (CAGR) of approximately XX% during the forecast period, underscoring its robust expansion. This evolution is further fueled by the increasing per capita consumption of confectionery products in emerging economies and the growing awareness of mint's oral hygiene benefits. The integration of smart technologies in packaging and personalized product offerings are emerging trends that will continue to shape the industry's landscape.
Leading Regions, Countries, or Segments in Mint Industry
The global mint market exhibits distinct regional dominance and segment leadership, with a granular analysis revealing key drivers and influential factors. North America currently stands as a leading region, propelled by high disposable incomes, a strong consumer preference for confectionery products, and the presence of major industry players. The United States mint market alone accounts for a significant portion of global sales, driven by robust demand for both power mints and standard mints. In terms of product type, standard mints continue to hold a dominant market share due to their widespread availability and affordability. However, the growth of power mints, often fortified with added functional benefits like enhanced breath freshening or enamel protection, is demonstrating a higher CAGR, indicating a shifting consumer preference towards specialized oral care solutions.
Analyzing distribution channels, supermarkets/hypermarkets remain the primary avenue for mint sales globally, offering broad accessibility and promotional opportunities. Following closely are convenience stores, catering to impulse purchases and on-the-go consumption. The pharmacies segment is witnessing a surge in demand for mints with medicinal or therapeutic benefits, such as those aiding digestion or offering throat relief. The specialist retailers segment, while smaller, plays a crucial role in offering premium and niche mint products.
Key drivers for dominance in these segments include:
- Investment Trends: Significant capital investment in marketing and product development by major companies in regions like North America and Western Europe.
- Regulatory Support: Favorable regulations in some countries promoting the sale of sugar-free and health-conscious confectionery items.
- Consumer Preferences: A growing trend towards natural ingredients, functional benefits, and sustainable packaging influencing purchasing decisions.
- Retail Infrastructure: Well-established and efficient retail networks facilitating widespread product availability.
- Economic Stability: Strong economic conditions leading to higher consumer spending on non-essential items like mints.
The mint industry market size is expected to see continued expansion in these leading regions and segments, with emerging markets showing significant potential for future growth. The competitive landscape remains dynamic, with continuous innovation in flavor profiles and product formulations aimed at capturing market share.
Mint Industry Product Innovations
Product innovation is a cornerstone of the mint industry, driving consumer engagement and market expansion. Recent advancements have focused on creating sugar-free variants, catering to the growing health-conscious consumer base, and incorporating natural ingredients and flavors. The introduction of power mints with intensified cooling sensations and longer-lasting breath-freshening properties has resonated well with consumers seeking superior oral hygiene solutions. Furthermore, companies are exploring novel applications, such as mints designed for specific occasions or functional benefits, like stress relief or improved focus. The global mint market is witnessing a trend towards premiumization, with artisanal and gourmet mints gaining traction. Technological advancements in encapsulation and flavor release technology are enabling more sophisticated and prolonged sensory experiences, setting new benchmarks for mint product performance.
Propelling Factors for Mint Industry Growth
The mint industry is experiencing robust growth propelled by several key factors. Technological advancements in manufacturing processes have enabled greater efficiency and the development of innovative product formats, such as sugar-free and advanced flavor-release mints. Economically, rising disposable incomes globally, particularly in emerging economies, are increasing consumer spending on confectionery and impulse purchases. Regulatory support for health-conscious products, including sugar-free and natural ingredient claims, is further stimulating demand. For instance, government initiatives promoting healthier lifestyles indirectly benefit the mint market by encouraging the consumption of sugar-free alternatives. The widespread availability across diverse distribution channels, from supermarkets/hypermarkets to convenience stores and pharmacies, ensures broad market penetration and accessibility for a wide range of mint products.
Obstacles in the Mint Industry Market
Despite its growth trajectory, the mint industry faces several obstacles. Stringent regulatory challenges regarding ingredient sourcing, labeling, and health claims can slow down product launches and market expansion in certain regions. Supply chain disruptions, exacerbated by global events, can lead to increased raw material costs and affect product availability. Intense competitive pressures from established brands and new entrants offering similar products necessitate continuous innovation and strategic marketing to maintain market share. The rising cost of natural ingredients and sustainable packaging solutions also presents a financial challenge, potentially impacting profit margins for manufacturers in the confectionery mints market.
Future Opportunities in Mint Industry
The mint industry is ripe with future opportunities. The burgeoning demand for natural and organic ingredients presents a significant avenue for product development and differentiation. Emerging markets, with their growing middle class and increasing consumption of convenience foods, offer vast untapped potential for market expansion. Technological advancements in personalized nutrition and functional ingredients could lead to the development of specialized mints catering to specific health needs or lifestyle preferences. Furthermore, the growing trend of sustainable and eco-friendly packaging offers an opportunity for brands to enhance their appeal among environmentally conscious consumers, positively impacting the oral care mints market.
Major Players in the Mint Industry Ecosystem
- Nestle SA
- Mars Incorporated
- Procter and Gamble Co
- Mondelez International Inc
- Ferrero International S A
- The Hershey Company
- Perfetti Van Melle Group B V
- Ricola Ltd
- Ferndale Confectionery Pty Ltd
- Herbion International Inc
Key Developments in Mint Industry Industry
- January 2022: Tic Tac introduced limited-edition packages with uplifting messages to inspire kindness and foster connections. The new packets feature 12 Tic Tac sayings and are available in Freshmint, Orange, and Fruit Adventure flavors, aiming to boost consumer engagement and brand loyalty in the confectionery mints market.
- March 2021: Perfetti Van Melle announced the launch of Center fresh 'Clean Breath.' This 3-layer product utilizes compressed mint technology with zinc lactate in the central layer, enhancing its breath-freshening efficacy and catering to the oral care mints market.
- March 2021: Mars Wrigley launched a new price variant of Doublemint and Orbit at INR 1, a strategic move to increase accessibility and market penetration in price-sensitive regions and to boost the global mint market sales.
Strategic Mint Industry Market Forecast
The mint industry market forecast indicates a promising future, driven by ongoing innovation and expanding consumer demand. The strategic emphasis on sugar-free and natural ingredient-based mint products will continue to propel growth in the oral care mints market. Emerging economies present substantial untapped potential, with increasing disposable incomes fostering greater consumption of confectionery items. Technological advancements in flavor encapsulation and functional ingredients are expected to unlock new product categories and enhance consumer experiences. The ongoing trend of health and wellness will further solidify the demand for mints perceived as beneficial for oral hygiene and overall well-being, contributing to a robust mint industry market size and sustained expansion.
Mint Industry Segmentation
-
1. Product Type
- 1.1. Power Mints
- 1.2. Standard Mints
-
2. Distribution Channel
- 2.1. Supermarkets/Hypermarkets
- 2.2. Convenience Stores
- 2.3. Pharmacies
- 2.4. Specialist Retailers
- 2.5. Other Distribution Channels
Mint Industry Segmentation By Geography
-
1. North America
- 1.1. United States
- 1.2. Canada
- 1.3. Mexico
- 1.4. Rest of North America
-
2. Europe
- 2.1. Spain
- 2.2. United Kingdom
- 2.3. Germany
- 2.4. France
- 2.5. Italy
- 2.6. Russia
- 2.7. Rest of Europe
-
3. Asia Pacific
- 3.1. China
- 3.2. Japan
- 3.3. India
- 3.4. Australia
- 3.5. Rest of Asia Pacific
-
4. South America
- 4.1. Brazil
- 4.2. Argentina
- 4.3. Rest of South America
-
5. Middle East and Africa
- 5.1. South Africa
- 5.2. United Arab Emirates
- 5.3. Rest of Middle East and Africa
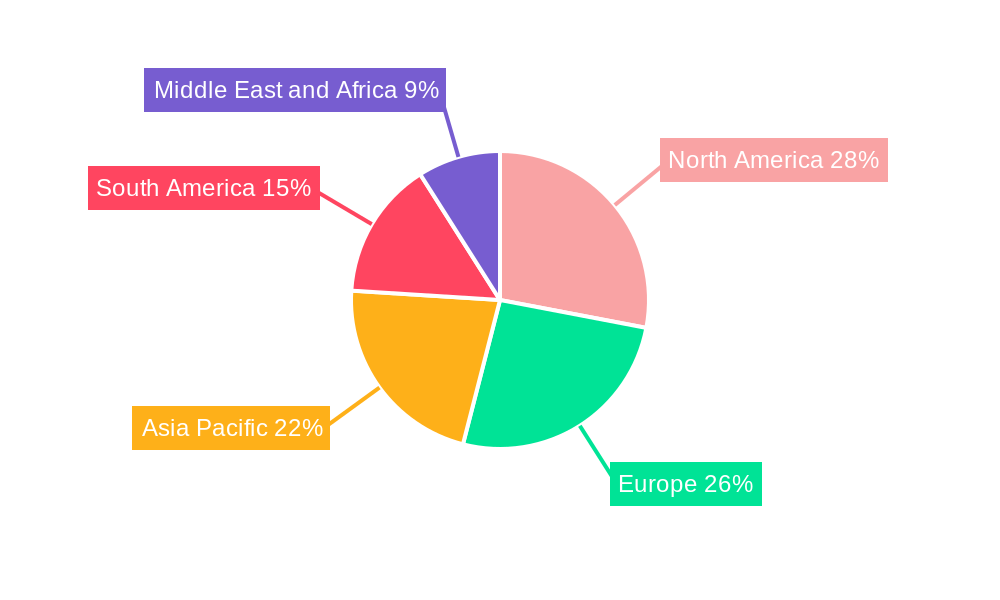
Mint Industry Regional Market Share
Geographic Coverage of Mint Industry
Mint Industry REPORT HIGHLIGHTS
| Aspects | Details |
|---|---|
| Study Period | 2020-2034 |
| Base Year | 2025 |
| Estimated Year | 2026 |
| Forecast Period | 2026-2034 |
| Historical Period | 2020-2025 |
| Growth Rate | CAGR of 4.64% from 2020-2034 |
| Segmentation |
|
Table of Contents
- 1. Introduction
- 1.1. Research Scope
- 1.2. Market Segmentation
- 1.3. Research Objective
- 1.4. Definitions and Assumptions
- 2. Executive Summary
- 2.1. Market Snapshot
- 3. Market Dynamics
- 3.1. Market Drivers
- 3.2. Market Restrains
- 3.3. Market Trends
- 3.4. Market Opportunities
- 4. Market Factor Analysis
- 4.1. Porters Five Forces
- 4.1.1. Bargaining Power of Suppliers
- 4.1.2. Bargaining Power of Buyers
- 4.1.3. Threat of New Entrants
- 4.1.4. Threat of Substitutes
- 4.1.5. Competitive Rivalry
- 4.2. PESTEL analysis
- 4.3. BCG Analysis
- 4.3.1. Stars (High Growth, High Market Share)
- 4.3.2. Cash Cows (Low Growth, High Market Share)
- 4.3.3. Question Mark (High Growth, Low Market Share)
- 4.3.4. Dogs (Low Growth, Low Market Share)
- 4.4. Ansoff Matrix Analysis
- 4.5. Supply Chain Analysis
- 4.6. Regulatory Landscape
- 4.7. Current Market Potential and Opportunity Assessment (TAM–SAM–SOM Framework)
- 4.8. DMV Analyst Note
- 4.1. Porters Five Forces
- 5. Market Analysis, Insights and Forecast 2021-2033
- 5.1. Market Analysis, Insights and Forecast - by Product Type
- 5.1.1. Power Mints
- 5.1.2. Standard Mints
- 5.2. Market Analysis, Insights and Forecast - by Distribution Channel
- 5.2.1. Supermarkets/Hypermarkets
- 5.2.2. Convenience Stores
- 5.2.3. Pharmacies
- 5.2.4. Specialist Retailers
- 5.2.5. Other Distribution Channels
- 5.3. Market Analysis, Insights and Forecast - by Region
- 5.3.1. North America
- 5.3.2. Europe
- 5.3.3. Asia Pacific
- 5.3.4. South America
- 5.3.5. Middle East and Africa
- 5.1. Market Analysis, Insights and Forecast - by Product Type
- 6. Global Mint Industry Analysis, Insights and Forecast, 2021-2033
- 6.1. Market Analysis, Insights and Forecast - by Product Type
- 6.1.1. Power Mints
- 6.1.2. Standard Mints
- 6.2. Market Analysis, Insights and Forecast - by Distribution Channel
- 6.2.1. Supermarkets/Hypermarkets
- 6.2.2. Convenience Stores
- 6.2.3. Pharmacies
- 6.2.4. Specialist Retailers
- 6.2.5. Other Distribution Channels
- 6.1. Market Analysis, Insights and Forecast - by Product Type
- 7. North America Mint Industry Analysis, Insights and Forecast, 2020-2032
- 7.1. Market Analysis, Insights and Forecast - by Product Type
- 7.1.1. Power Mints
- 7.1.2. Standard Mints
- 7.2. Market Analysis, Insights and Forecast - by Distribution Channel
- 7.2.1. Supermarkets/Hypermarkets
- 7.2.2. Convenience Stores
- 7.2.3. Pharmacies
- 7.2.4. Specialist Retailers
- 7.2.5. Other Distribution Channels
- 7.1. Market Analysis, Insights and Forecast - by Product Type
- 8. Europe Mint Industry Analysis, Insights and Forecast, 2020-2032
- 8.1. Market Analysis, Insights and Forecast - by Product Type
- 8.1.1. Power Mints
- 8.1.2. Standard Mints
- 8.2. Market Analysis, Insights and Forecast - by Distribution Channel
- 8.2.1. Supermarkets/Hypermarkets
- 8.2.2. Convenience Stores
- 8.2.3. Pharmacies
- 8.2.4. Specialist Retailers
- 8.2.5. Other Distribution Channels
- 8.1. Market Analysis, Insights and Forecast - by Product Type
- 9. Asia Pacific Mint Industry Analysis, Insights and Forecast, 2020-2032
- 9.1. Market Analysis, Insights and Forecast - by Product Type
- 9.1.1. Power Mints
- 9.1.2. Standard Mints
- 9.2. Market Analysis, Insights and Forecast - by Distribution Channel
- 9.2.1. Supermarkets/Hypermarkets
- 9.2.2. Convenience Stores
- 9.2.3. Pharmacies
- 9.2.4. Specialist Retailers
- 9.2.5. Other Distribution Channels
- 9.1. Market Analysis, Insights and Forecast - by Product Type
- 10. South America Mint Industry Analysis, Insights and Forecast, 2020-2032
- 10.1. Market Analysis, Insights and Forecast - by Product Type
- 10.1.1. Power Mints
- 10.1.2. Standard Mints
- 10.2. Market Analysis, Insights and Forecast - by Distribution Channel
- 10.2.1. Supermarkets/Hypermarkets
- 10.2.2. Convenience Stores
- 10.2.3. Pharmacies
- 10.2.4. Specialist Retailers
- 10.2.5. Other Distribution Channels
- 10.1. Market Analysis, Insights and Forecast - by Product Type
- 11. Middle East and Africa Mint Industry Analysis, Insights and Forecast, 2020-2032
- 11.1. Market Analysis, Insights and Forecast - by Product Type
- 11.1.1. Power Mints
- 11.1.2. Standard Mints
- 11.2. Market Analysis, Insights and Forecast - by Distribution Channel
- 11.2.1. Supermarkets/Hypermarkets
- 11.2.2. Convenience Stores
- 11.2.3. Pharmacies
- 11.2.4. Specialist Retailers
- 11.2.5. Other Distribution Channels
- 11.1. Market Analysis, Insights and Forecast - by Product Type
- 12. Competitive Analysis
- 12.1. Company Profiles
- 12.1.1 Nestle SA
- 12.1.1.1. Company Overview
- 12.1.1.2. Products
- 12.1.1.3. Company Financials
- 12.1.1.4. SWOT Analysis
- 12.1.2 Herbion International Inc *List Not Exhaustive
- 12.1.2.1. Company Overview
- 12.1.2.2. Products
- 12.1.2.3. Company Financials
- 12.1.2.4. SWOT Analysis
- 12.1.3 Mars Incorporated
- 12.1.3.1. Company Overview
- 12.1.3.2. Products
- 12.1.3.3. Company Financials
- 12.1.3.4. SWOT Analysis
- 12.1.4 Procter and Gamble Co
- 12.1.4.1. Company Overview
- 12.1.4.2. Products
- 12.1.4.3. Company Financials
- 12.1.4.4. SWOT Analysis
- 12.1.5 Mondelez International Inc
- 12.1.5.1. Company Overview
- 12.1.5.2. Products
- 12.1.5.3. Company Financials
- 12.1.5.4. SWOT Analysis
- 12.1.6 Ferndale Confectionery Pty Ltd
- 12.1.6.1. Company Overview
- 12.1.6.2. Products
- 12.1.6.3. Company Financials
- 12.1.6.4. SWOT Analysis
- 12.1.7 Ricola Ltd
- 12.1.7.1. Company Overview
- 12.1.7.2. Products
- 12.1.7.3. Company Financials
- 12.1.7.4. SWOT Analysis
- 12.1.8 Ferrero International S A
- 12.1.8.1. Company Overview
- 12.1.8.2. Products
- 12.1.8.3. Company Financials
- 12.1.8.4. SWOT Analysis
- 12.1.9 Perfetti Van Melle Group B V
- 12.1.9.1. Company Overview
- 12.1.9.2. Products
- 12.1.9.3. Company Financials
- 12.1.9.4. SWOT Analysis
- 12.1.10 The Hershey Company
- 12.1.10.1. Company Overview
- 12.1.10.2. Products
- 12.1.10.3. Company Financials
- 12.1.10.4. SWOT Analysis
- 12.1.1 Nestle SA
- 12.2. Market Entropy
- 12.2.1 Company's Key Areas Served
- 12.2.2 Recent Developments
- 12.3. Company Market Share Analysis 2025
- 12.3.1 Top 5 Companies Market Share Analysis
- 12.3.2 Top 3 Companies Market Share Analysis
- 12.4. List of Potential Customers
- 13. Research Methodology
List of Figures
- Figure 1: Global Mint Industry Revenue Breakdown (billion, %) by Region 2025 & 2033
- Figure 2: North America Mint Industry Revenue (billion), by Product Type 2025 & 2033
- Figure 3: North America Mint Industry Revenue Share (%), by Product Type 2025 & 2033
- Figure 4: North America Mint Industry Revenue (billion), by Distribution Channel 2025 & 2033
- Figure 5: North America Mint Industry Revenue Share (%), by Distribution Channel 2025 & 2033
- Figure 6: North America Mint Industry Revenue (billion), by Country 2025 & 2033
- Figure 7: North America Mint Industry Revenue Share (%), by Country 2025 & 2033
- Figure 8: Europe Mint Industry Revenue (billion), by Product Type 2025 & 2033
- Figure 9: Europe Mint Industry Revenue Share (%), by Product Type 2025 & 2033
- Figure 10: Europe Mint Industry Revenue (billion), by Distribution Channel 2025 & 2033
- Figure 11: Europe Mint Industry Revenue Share (%), by Distribution Channel 2025 & 2033
- Figure 12: Europe Mint Industry Revenue (billion), by Country 2025 & 2033
- Figure 13: Europe Mint Industry Revenue Share (%), by Country 2025 & 2033
- Figure 14: Asia Pacific Mint Industry Revenue (billion), by Product Type 2025 & 2033
- Figure 15: Asia Pacific Mint Industry Revenue Share (%), by Product Type 2025 & 2033
- Figure 16: Asia Pacific Mint Industry Revenue (billion), by Distribution Channel 2025 & 2033
- Figure 17: Asia Pacific Mint Industry Revenue Share (%), by Distribution Channel 2025 & 2033
- Figure 18: Asia Pacific Mint Industry Revenue (billion), by Country 2025 & 2033
- Figure 19: Asia Pacific Mint Industry Revenue Share (%), by Country 2025 & 2033
- Figure 20: South America Mint Industry Revenue (billion), by Product Type 2025 & 2033
- Figure 21: South America Mint Industry Revenue Share (%), by Product Type 2025 & 2033
- Figure 22: South America Mint Industry Revenue (billion), by Distribution Channel 2025 & 2033
- Figure 23: South America Mint Industry Revenue Share (%), by Distribution Channel 2025 & 2033
- Figure 24: South America Mint Industry Revenue (billion), by Country 2025 & 2033
- Figure 25: South America Mint Industry Revenue Share (%), by Country 2025 & 2033
- Figure 26: Middle East and Africa Mint Industry Revenue (billion), by Product Type 2025 & 2033
- Figure 27: Middle East and Africa Mint Industry Revenue Share (%), by Product Type 2025 & 2033
- Figure 28: Middle East and Africa Mint Industry Revenue (billion), by Distribution Channel 2025 & 2033
- Figure 29: Middle East and Africa Mint Industry Revenue Share (%), by Distribution Channel 2025 & 2033
- Figure 30: Middle East and Africa Mint Industry Revenue (billion), by Country 2025 & 2033
- Figure 31: Middle East and Africa Mint Industry Revenue Share (%), by Country 2025 & 2033
List of Tables
- Table 1: Global Mint Industry Revenue billion Forecast, by Product Type 2020 & 2033
- Table 2: Global Mint Industry Revenue billion Forecast, by Distribution Channel 2020 & 2033
- Table 3: Global Mint Industry Revenue billion Forecast, by Region 2020 & 2033
- Table 4: Global Mint Industry Revenue billion Forecast, by Product Type 2020 & 2033
- Table 5: Global Mint Industry Revenue billion Forecast, by Distribution Channel 2020 & 2033
- Table 6: Global Mint Industry Revenue billion Forecast, by Country 2020 & 2033
- Table 7: United States Mint Industry Revenue (billion) Forecast, by Application 2020 & 2033
- Table 8: Canada Mint Industry Revenue (billion) Forecast, by Application 2020 & 2033
- Table 9: Mexico Mint Industry Revenue (billion) Forecast, by Application 2020 & 2033
- Table 10: Rest of North America Mint Industry Revenue (billion) Forecast, by Application 2020 & 2033
- Table 11: Global Mint Industry Revenue billion Forecast, by Product Type 2020 & 2033
- Table 12: Global Mint Industry Revenue billion Forecast, by Distribution Channel 2020 & 2033
- Table 13: Global Mint Industry Revenue billion Forecast, by Country 2020 & 2033
- Table 14: Spain Mint Industry Revenue (billion) Forecast, by Application 2020 & 2033
- Table 15: United Kingdom Mint Industry Revenue (billion) Forecast, by Application 2020 & 2033
- Table 16: Germany Mint Industry Revenue (billion) Forecast, by Application 2020 & 2033
- Table 17: France Mint Industry Revenue (billion) Forecast, by Application 2020 & 2033
- Table 18: Italy Mint Industry Revenue (billion) Forecast, by Application 2020 & 2033
- Table 19: Russia Mint Industry Revenue (billion) Forecast, by Application 2020 & 2033
- Table 20: Rest of Europe Mint Industry Revenue (billion) Forecast, by Application 2020 & 2033
- Table 21: Global Mint Industry Revenue billion Forecast, by Product Type 2020 & 2033
- Table 22: Global Mint Industry Revenue billion Forecast, by Distribution Channel 2020 & 2033
- Table 23: Global Mint Industry Revenue billion Forecast, by Country 2020 & 2033
- Table 24: China Mint Industry Revenue (billion) Forecast, by Application 2020 & 2033
- Table 25: Japan Mint Industry Revenue (billion) Forecast, by Application 2020 & 2033
- Table 26: India Mint Industry Revenue (billion) Forecast, by Application 2020 & 2033
- Table 27: Australia Mint Industry Revenue (billion) Forecast, by Application 2020 & 2033
- Table 28: Rest of Asia Pacific Mint Industry Revenue (billion) Forecast, by Application 2020 & 2033
- Table 29: Global Mint Industry Revenue billion Forecast, by Product Type 2020 & 2033
- Table 30: Global Mint Industry Revenue billion Forecast, by Distribution Channel 2020 & 2033
- Table 31: Global Mint Industry Revenue billion Forecast, by Country 2020 & 2033
- Table 32: Brazil Mint Industry Revenue (billion) Forecast, by Application 2020 & 2033
- Table 33: Argentina Mint Industry Revenue (billion) Forecast, by Application 2020 & 2033
- Table 34: Rest of South America Mint Industry Revenue (billion) Forecast, by Application 2020 & 2033
- Table 35: Global Mint Industry Revenue billion Forecast, by Product Type 2020 & 2033
- Table 36: Global Mint Industry Revenue billion Forecast, by Distribution Channel 2020 & 2033
- Table 37: Global Mint Industry Revenue billion Forecast, by Country 2020 & 2033
- Table 38: South Africa Mint Industry Revenue (billion) Forecast, by Application 2020 & 2033
- Table 39: United Arab Emirates Mint Industry Revenue (billion) Forecast, by Application 2020 & 2033
- Table 40: Rest of Middle East and Africa Mint Industry Revenue (billion) Forecast, by Application 2020 & 2033
Frequently Asked Questions
1. What is the projected Compound Annual Growth Rate (CAGR) of the Mint Industry?
The projected CAGR is approximately 4.64%.
2. Which companies are prominent players in the Mint Industry?
Key companies in the market include Nestle SA, Herbion International Inc *List Not Exhaustive, Mars Incorporated, Procter and Gamble Co, Mondelez International Inc, Ferndale Confectionery Pty Ltd, Ricola Ltd, Ferrero International S A, Perfetti Van Melle Group B V, The Hershey Company.
3. What are the main segments of the Mint Industry?
The market segments include Product Type, Distribution Channel.
4. Can you provide details about the market size?
The market size is estimated to be USD 7.74 billion as of 2022.
5. What are some drivers contributing to market growth?
Innovation in Vanillin Synthesis; Diverse Functionality of Vanillin In End-use Industries.
6. What are the notable trends driving market growth?
Rising Demand for Clean Label Ingredient to Drive the Growth of Mints Market.
7. Are there any restraints impacting market growth?
Supply Chain Variability Impacting Vanilla Bean Availability For Flavor Production.
8. Can you provide examples of recent developments in the market?
In January 2022, Tic Tac introduced its limited-edition packages with uplifting messages to inspire customers to exercise kindness and foster connections. The new packets have 12 Tic Tac sayings, including "Keep Your Day In Mint Condition," "Orange You Glad We Have Each Other?" and many more. They are available in the flavors Freshmint, Orange, and Fruit Adventure.
9. What pricing options are available for accessing the report?
Pricing options include single-user, multi-user, and enterprise licenses priced at USD 4750, USD 5250, and USD 8750 respectively.
10. Is the market size provided in terms of value or volume?
The market size is provided in terms of value, measured in billion.
11. Are there any specific market keywords associated with the report?
Yes, the market keyword associated with the report is "Mint Industry," which aids in identifying and referencing the specific market segment covered.
12. How do I determine which pricing option suits my needs best?
The pricing options vary based on user requirements and access needs. Individual users may opt for single-user licenses, while businesses requiring broader access may choose multi-user or enterprise licenses for cost-effective access to the report.
13. Are there any additional resources or data provided in the Mint Industry report?
While the report offers comprehensive insights, it's advisable to review the specific contents or supplementary materials provided to ascertain if additional resources or data are available.
14. How can I stay updated on further developments or reports in the Mint Industry?
To stay informed about further developments, trends, and reports in the Mint Industry, consider subscribing to industry newsletters, following relevant companies and organizations, or regularly checking reputable industry news sources and publications.
Methodology
Step 1 - Identification of Relevant Samples Size from Population Database


Step 2 - Approaches for Defining Global Market Size (Value, Volume* & Price*)

Note*: In applicable scenarios
Step 3 - Data Sources
Primary Research
- Web Analytics
- Survey Reports
- Research Institute
- Latest Research Reports
- Opinion Leaders
Secondary Research
- Annual Reports
- White Paper
- Latest Press Release
- Industry Association
- Paid Database
- Investor Presentations

Step 4 - Data Triangulation
Involves using different sources of information in order to increase the validity of a study
These sources are likely to be stakeholders in a program - participants, other researchers, program staff, other community members, and so on.
Then we put all data in single framework & apply various statistical tools to find out the dynamic on the market.
During the analysis stage, feedback from the stakeholder groups would be compared to determine areas of agreement as well as areas of divergence