

Key Insights
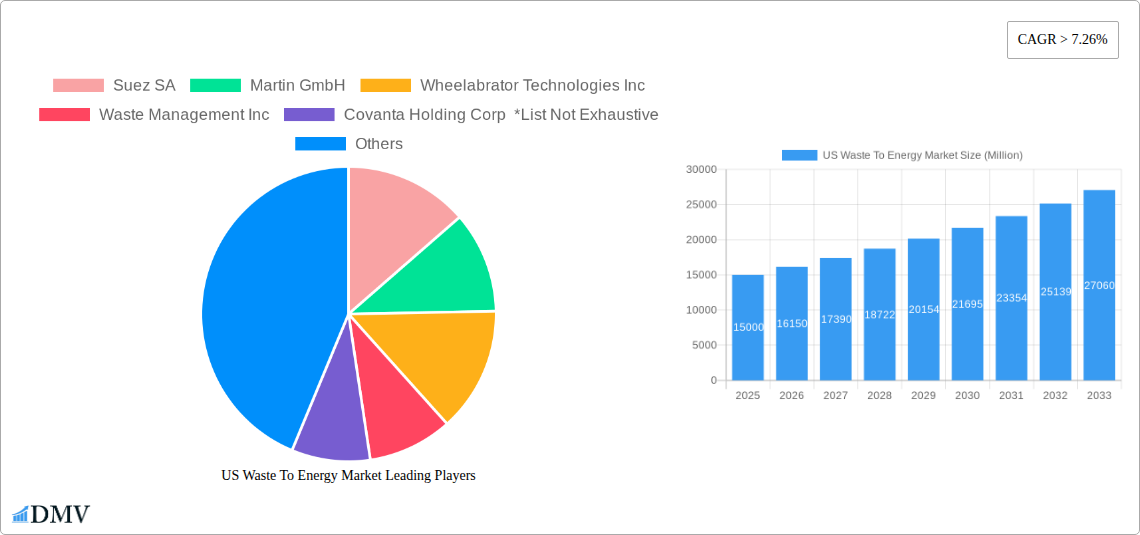
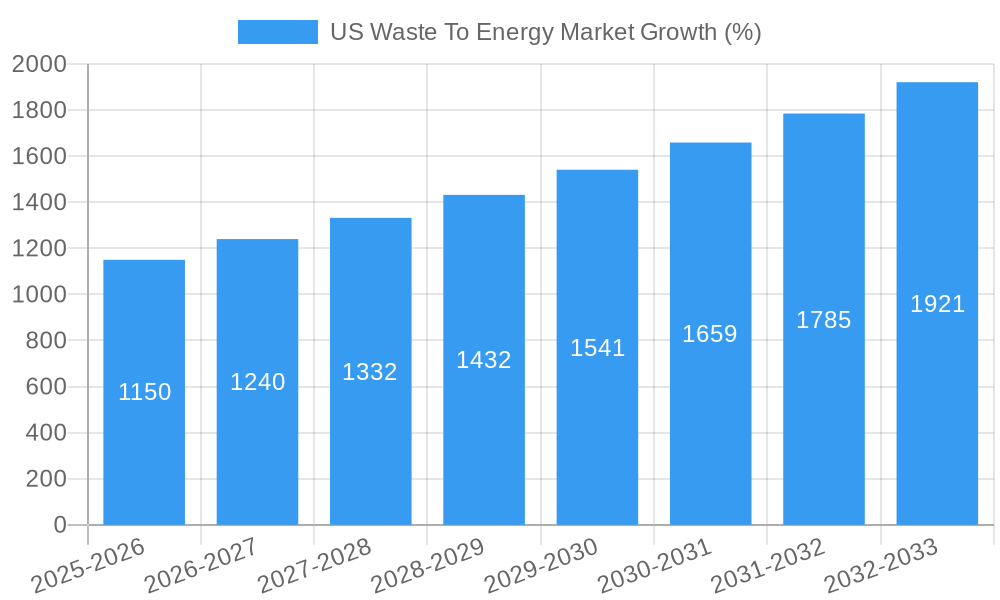
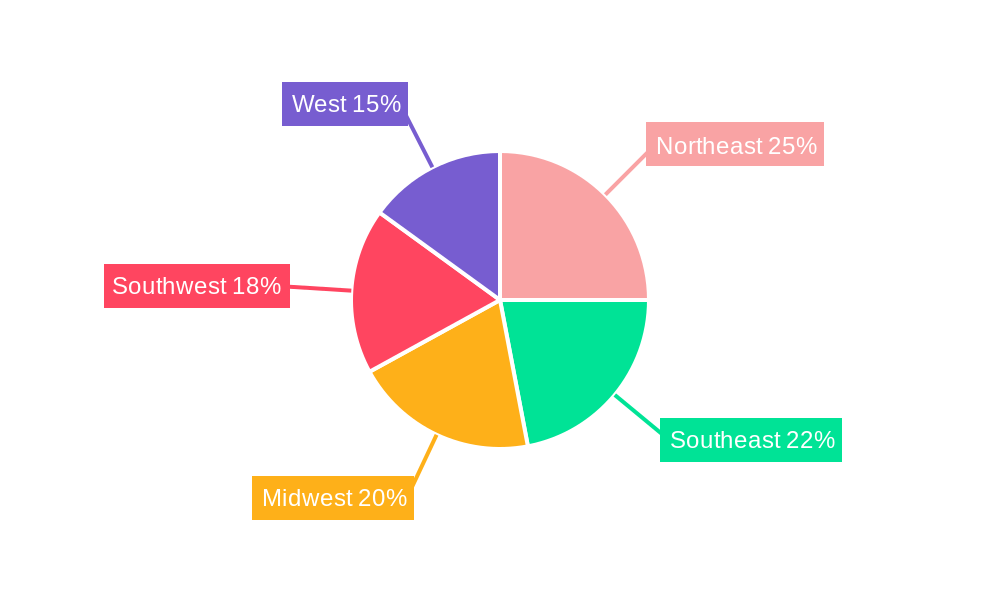
The US Waste-to-Energy (WtE) market, valued at approximately $15 billion in 2025, is experiencing robust growth, projected to expand at a Compound Annual Growth Rate (CAGR) exceeding 7.26% from 2025 to 2033. This surge is driven by several factors. Stringent environmental regulations aimed at reducing landfill waste and promoting sustainable waste management practices are key catalysts. Growing awareness of the environmental and economic benefits of WtE, including reduced greenhouse gas emissions and the generation of renewable energy, further fuels market expansion. Technological advancements in WtE technologies, particularly in areas like thermal and biological conversion, are improving efficiency and reducing operational costs, making WtE a more attractive and viable solution. Increased investment in research and development, coupled with supportive government policies and incentives, is also contributing to market growth. The municipal solid waste (MSW) segment currently dominates the market, but the industrial and agricultural waste segments are poised for significant growth as businesses and farmers seek sustainable waste management solutions. Regional variations exist, with the Northeast, West, and Southeast regions showing particularly strong growth potential due to higher population density and advanced waste management infrastructure.
While the market exhibits significant growth potential, challenges remain. High initial capital investment costs associated with WtE facilities can act as a barrier to entry for smaller operators. Public perception and concerns regarding potential environmental impacts, such as air emissions and ash disposal, need to be addressed through robust environmental monitoring and public education initiatives. Furthermore, fluctuations in fuel prices and the availability of suitable waste feedstock could impact the profitability of WtE projects. Despite these restraints, the long-term outlook for the US WtE market remains positive, driven by the pressing need for sustainable waste management solutions and the increasing economic viability of WtE technologies. The market is expected to surpass $25 billion by 2033, representing substantial opportunities for established players and new entrants alike.
US Waste-to-Energy Market Report: 2019-2033 Forecast
This comprehensive report provides an in-depth analysis of the US waste-to-energy market, offering invaluable insights for stakeholders seeking to navigate this dynamic sector. With a study period spanning 2019-2033, a base year of 2025, and a forecast period from 2025-2033, this report delivers actionable intelligence based on historical data (2019-2024) and robust projections. The market is segmented by technology (physical, thermal, biological) and application (municipal solid waste, industrial waste, agricultural waste), offering granular market sizing and growth projections in Millions.
US Waste To Energy Market Market Composition & Trends
The US waste-to-energy market exhibits a moderately consolidated structure, with key players like Suez SA, Martin GmbH, Wheelabrator Technologies Inc, Waste Management Inc, and Covanta Holding Corp holding significant market share. However, the entry of innovative startups and the ongoing M&A activity indicate a dynamic landscape. Market share distribution in 2025 is estimated to be as follows: Waste Management Inc (25%), Suez SA (18%), Covanta Holding Corp (15%), Wheelabrator Technologies Inc (12%), Martin GmbH (10%), and Others (20%). The total market value in 2025 is projected at $XX Million. Innovation is driven by stringent environmental regulations and the growing need for sustainable waste management solutions. The regulatory landscape, while supportive of waste-to-energy solutions in some areas, varies significantly across states, impacting market growth. Substitute products, such as landfilling and anaerobic digestion, compete for market share. End-user profiles comprise municipalities, industrial facilities, and agricultural businesses. M&A activity has been significant, with deal values exceeding $XX Million in the past five years, primarily driven by consolidation efforts and access to new technologies.
US Waste To Energy Market Industry Evolution
The US waste-to-energy market has witnessed robust growth from 2019 to 2024, with a Compound Annual Growth Rate (CAGR) of XX%. This growth is attributed to several factors including increasing awareness of environmental sustainability, stricter waste management regulations, and advancements in waste-to-energy technologies, leading to higher efficiency and reduced environmental impact. The adoption of thermal technologies remains dominant due to their established infrastructure and proven ability to generate energy from various waste streams. However, biological technologies are gaining traction, driven by their potential for carbon-negative waste processing. The market is experiencing a shift towards integrated waste management solutions, combining waste-to-energy with recycling and composting. This holistic approach is enhancing the overall efficiency and sustainability of waste management operations. Consumer demand for renewable energy is a major catalyst, driving investment in waste-to-energy projects. The market is anticipated to reach $XX Million by 2033, reflecting a CAGR of XX% during the forecast period (2025-2033).
Leading Regions, Countries, or Segments in US Waste To Energy Market
Dominant Segment: Thermal technology dominates the US waste-to-energy market due to its established infrastructure and proven energy generation capabilities. Municipal solid waste remains the largest application segment, driven by the high volume of waste generated by urban populations.
Key Drivers:
- Significant investments in new and upgraded waste-to-energy facilities across several states.
- Favorable government policies and incentives promoting renewable energy generation.
- Stringent regulations on landfilling and waste disposal.
- Increasing demand for renewable energy sources.
- Technological advancements, including improved efficiency and reduced emissions.
The Northeast and West Coast regions exhibit the highest concentration of waste-to-energy facilities and demonstrate the highest market penetration due to stringent environmental regulations and strong public support for renewable energy initiatives.
US Waste To Energy Market Product Innovations
Recent innovations in waste-to-energy technologies focus on enhancing energy efficiency, minimizing emissions, and recovering valuable materials from waste streams. Advancements in gasification and pyrolysis technologies are improving the conversion of waste into syngas and biochar, increasing energy yield and reducing greenhouse gas emissions. Modular and decentralized waste-to-energy systems are gaining popularity, offering scalability and flexibility for various waste streams and locations. These innovations are improving the economic viability and environmental sustainability of waste-to-energy solutions, attracting further investments in the sector.
Propelling Factors for US Waste To Energy Market Growth
Stringent environmental regulations, particularly those targeting landfill diversion, are a major driver. The growing demand for renewable energy and the increasing focus on carbon neutrality are also key factors. Furthermore, economic incentives, such as tax credits and subsidies for renewable energy projects, stimulate investment in waste-to-energy facilities. Technological advancements, leading to higher efficiency, reduced emissions, and improved resource recovery, play a significant role.
Obstacles in the US Waste To Energy Market Market
High capital costs for building and operating waste-to-energy facilities pose a major challenge. Concerns regarding potential environmental impacts, including air and water pollution, create regulatory hurdles and public opposition in some regions. Fluctuations in waste composition and quality can impact the efficiency and economic viability of waste-to-energy plants. Competition from other waste management solutions like landfilling and anaerobic digestion also creates pressure. Supply chain disruptions impacting the availability of critical components can hinder project development.
Future Opportunities in US Waste To Energy Market
The integration of advanced technologies like artificial intelligence and machine learning for optimizing plant operations and enhancing resource recovery presents significant opportunities. Expanding into new markets, such as industrial and agricultural waste streams, can broaden the market reach. Developing innovative financial models, such as power purchase agreements and green bonds, can facilitate project financing. Focusing on carbon capture and storage technologies can enhance the environmental sustainability of waste-to-energy facilities, attracting more investors and public support.
Major Players in the US Waste To Energy Market Ecosystem
- Suez SA
- Martin GmbH
- Wheelabrator Technologies Inc
- Waste Management Inc
- Covanta Holding Corp
- List Not Exhaustive
Key Developments in US Waste To Energy Market Industry
June 2022: The Florida government introduced a financial assistance program for power purchase agreements at municipally-owned solid waste combustion facilities and grants to incentivize capacity expansion. This boosts the financial viability of existing and new projects.
October 2022: Kore Infrastructure successfully demonstrated its modular waste-to-energy system in Los Angeles. This showcases the potential of innovative technologies to provide 100% renewable energy from organic waste in a carbon-negative manner, stimulating interest in modular solutions.
Strategic US Waste To Energy Market Market Forecast
The US waste-to-energy market is poised for significant growth, driven by technological advancements, supportive policies, and increasing environmental awareness. The rising demand for renewable energy, coupled with the need for sustainable waste management solutions, will fuel substantial market expansion in the coming years. Emerging technologies, such as carbon capture and innovative waste processing techniques, will further enhance the sector's growth trajectory. The market is expected to reach $XX Million by 2033, presenting significant opportunities for investors and industry players.
US Waste To Energy Market Segmentation
-
1. Technology
- 1.1. Physical
- 1.2. Thermal
- 1.3. Biological
US Waste To Energy Market Segmentation By Geography
-
1. North America
- 1.1. United States
- 1.2. Canada
- 1.3. Mexico
-
2. South America
- 2.1. Brazil
- 2.2. Argentina
- 2.3. Rest of South America
-
3. Europe
- 3.1. United Kingdom
- 3.2. Germany
- 3.3. France
- 3.4. Italy
- 3.5. Spain
- 3.6. Russia
- 3.7. Benelux
- 3.8. Nordics
- 3.9. Rest of Europe
-
4. Middle East & Africa
- 4.1. Turkey
- 4.2. Israel
- 4.3. GCC
- 4.4. North Africa
- 4.5. South Africa
- 4.6. Rest of Middle East & Africa
-
5. Asia Pacific
- 5.1. China
- 5.2. India
- 5.3. Japan
- 5.4. South Korea
- 5.5. ASEAN
- 5.6. Oceania
- 5.7. Rest of Asia Pacific
US Waste To Energy Market REPORT HIGHLIGHTS
| Aspects | Details |
|---|---|
| Study Period | 2019-2033 |
| Base Year | 2024 |
| Estimated Year | 2025 |
| Forecast Period | 2025-2033 |
| Historical Period | 2019-2024 |
| Growth Rate | CAGR of > 7.26% from 2019-2033 |
| Segmentation |
|
Table of Contents
- 1. Introduction
- 1.1. Research Scope
- 1.2. Market Segmentation
- 1.3. Research Methodology
- 1.4. Definitions and Assumptions
- 2. Executive Summary
- 2.1. Introduction
- 3. Market Dynamics
- 3.1. Introduction
- 3.2. Market Drivers
- 3.2.1. 4.; Global Inclination toward Renewable-based Power Generation4.; Increased Power Demand in Line with the Increasing Population
- 3.3. Market Restrains
- 3.3.1. 4.; High Initial Cost
- 3.4. Market Trends
- 3.4.1. Thermal Based Waste to Energy Conversion to Dominate the Market
- 4. Market Factor Analysis
- 4.1. Porters Five Forces
- 4.2. Supply/Value Chain
- 4.3. PESTEL analysis
- 4.4. Market Entropy
- 4.5. Patent/Trademark Analysis
- 5. Global US Waste To Energy Market Analysis, Insights and Forecast, 2019-2031
- 5.1. Market Analysis, Insights and Forecast - by Technology
- 5.1.1. Physical
- 5.1.2. Thermal
- 5.1.3. Biological
- 5.2. Market Analysis, Insights and Forecast - by Region
- 5.2.1. North America
- 5.2.2. South America
- 5.2.3. Europe
- 5.2.4. Middle East & Africa
- 5.2.5. Asia Pacific
- 5.1. Market Analysis, Insights and Forecast - by Technology
- 6. North America US Waste To Energy Market Analysis, Insights and Forecast, 2019-2031
- 6.1. Market Analysis, Insights and Forecast - by Technology
- 6.1.1. Physical
- 6.1.2. Thermal
- 6.1.3. Biological
- 6.1. Market Analysis, Insights and Forecast - by Technology
- 7. South America US Waste To Energy Market Analysis, Insights and Forecast, 2019-2031
- 7.1. Market Analysis, Insights and Forecast - by Technology
- 7.1.1. Physical
- 7.1.2. Thermal
- 7.1.3. Biological
- 7.1. Market Analysis, Insights and Forecast - by Technology
- 8. Europe US Waste To Energy Market Analysis, Insights and Forecast, 2019-2031
- 8.1. Market Analysis, Insights and Forecast - by Technology
- 8.1.1. Physical
- 8.1.2. Thermal
- 8.1.3. Biological
- 8.1. Market Analysis, Insights and Forecast - by Technology
- 9. Middle East & Africa US Waste To Energy Market Analysis, Insights and Forecast, 2019-2031
- 9.1. Market Analysis, Insights and Forecast - by Technology
- 9.1.1. Physical
- 9.1.2. Thermal
- 9.1.3. Biological
- 9.1. Market Analysis, Insights and Forecast - by Technology
- 10. Asia Pacific US Waste To Energy Market Analysis, Insights and Forecast, 2019-2031
- 10.1. Market Analysis, Insights and Forecast - by Technology
- 10.1.1. Physical
- 10.1.2. Thermal
- 10.1.3. Biological
- 10.1. Market Analysis, Insights and Forecast - by Technology
- 11. Northeast US Waste To Energy Market Analysis, Insights and Forecast, 2019-2031
- 12. Southeast US Waste To Energy Market Analysis, Insights and Forecast, 2019-2031
- 13. Midwest US Waste To Energy Market Analysis, Insights and Forecast, 2019-2031
- 14. Southwest US Waste To Energy Market Analysis, Insights and Forecast, 2019-2031
- 15. West US Waste To Energy Market Analysis, Insights and Forecast, 2019-2031
- 16. Competitive Analysis
- 16.1. Global Market Share Analysis 2024
- 16.2. Company Profiles
- 16.2.1 Suez SA
- 16.2.1.1. Overview
- 16.2.1.2. Products
- 16.2.1.3. SWOT Analysis
- 16.2.1.4. Recent Developments
- 16.2.1.5. Financials (Based on Availability)
- 16.2.2 Martin GmbH
- 16.2.2.1. Overview
- 16.2.2.2. Products
- 16.2.2.3. SWOT Analysis
- 16.2.2.4. Recent Developments
- 16.2.2.5. Financials (Based on Availability)
- 16.2.3 Wheelabrator Technologies Inc
- 16.2.3.1. Overview
- 16.2.3.2. Products
- 16.2.3.3. SWOT Analysis
- 16.2.3.4. Recent Developments
- 16.2.3.5. Financials (Based on Availability)
- 16.2.4 Waste Management Inc
- 16.2.4.1. Overview
- 16.2.4.2. Products
- 16.2.4.3. SWOT Analysis
- 16.2.4.4. Recent Developments
- 16.2.4.5. Financials (Based on Availability)
- 16.2.5 Covanta Holding Corp *List Not Exhaustive
- 16.2.5.1. Overview
- 16.2.5.2. Products
- 16.2.5.3. SWOT Analysis
- 16.2.5.4. Recent Developments
- 16.2.5.5. Financials (Based on Availability)
- 16.2.1 Suez SA
List of Figures
- Figure 1: Global US Waste To Energy Market Revenue Breakdown (Million, %) by Region 2024 & 2032
- Figure 2: United states US Waste To Energy Market Revenue (Million), by Country 2024 & 2032
- Figure 3: United states US Waste To Energy Market Revenue Share (%), by Country 2024 & 2032
- Figure 4: North America US Waste To Energy Market Revenue (Million), by Technology 2024 & 2032
- Figure 5: North America US Waste To Energy Market Revenue Share (%), by Technology 2024 & 2032
- Figure 6: North America US Waste To Energy Market Revenue (Million), by Country 2024 & 2032
- Figure 7: North America US Waste To Energy Market Revenue Share (%), by Country 2024 & 2032
- Figure 8: South America US Waste To Energy Market Revenue (Million), by Technology 2024 & 2032
- Figure 9: South America US Waste To Energy Market Revenue Share (%), by Technology 2024 & 2032
- Figure 10: South America US Waste To Energy Market Revenue (Million), by Country 2024 & 2032
- Figure 11: South America US Waste To Energy Market Revenue Share (%), by Country 2024 & 2032
- Figure 12: Europe US Waste To Energy Market Revenue (Million), by Technology 2024 & 2032
- Figure 13: Europe US Waste To Energy Market Revenue Share (%), by Technology 2024 & 2032
- Figure 14: Europe US Waste To Energy Market Revenue (Million), by Country 2024 & 2032
- Figure 15: Europe US Waste To Energy Market Revenue Share (%), by Country 2024 & 2032
- Figure 16: Middle East & Africa US Waste To Energy Market Revenue (Million), by Technology 2024 & 2032
- Figure 17: Middle East & Africa US Waste To Energy Market Revenue Share (%), by Technology 2024 & 2032
- Figure 18: Middle East & Africa US Waste To Energy Market Revenue (Million), by Country 2024 & 2032
- Figure 19: Middle East & Africa US Waste To Energy Market Revenue Share (%), by Country 2024 & 2032
- Figure 20: Asia Pacific US Waste To Energy Market Revenue (Million), by Technology 2024 & 2032
- Figure 21: Asia Pacific US Waste To Energy Market Revenue Share (%), by Technology 2024 & 2032
- Figure 22: Asia Pacific US Waste To Energy Market Revenue (Million), by Country 2024 & 2032
- Figure 23: Asia Pacific US Waste To Energy Market Revenue Share (%), by Country 2024 & 2032
List of Tables
- Table 1: Global US Waste To Energy Market Revenue Million Forecast, by Region 2019 & 2032
- Table 2: Global US Waste To Energy Market Revenue Million Forecast, by Technology 2019 & 2032
- Table 3: Global US Waste To Energy Market Revenue Million Forecast, by Region 2019 & 2032
- Table 4: Global US Waste To Energy Market Revenue Million Forecast, by Country 2019 & 2032
- Table 5: Northeast US Waste To Energy Market Revenue (Million) Forecast, by Application 2019 & 2032
- Table 6: Southeast US Waste To Energy Market Revenue (Million) Forecast, by Application 2019 & 2032
- Table 7: Midwest US Waste To Energy Market Revenue (Million) Forecast, by Application 2019 & 2032
- Table 8: Southwest US Waste To Energy Market Revenue (Million) Forecast, by Application 2019 & 2032
- Table 9: West US Waste To Energy Market Revenue (Million) Forecast, by Application 2019 & 2032
- Table 10: Global US Waste To Energy Market Revenue Million Forecast, by Technology 2019 & 2032
- Table 11: Global US Waste To Energy Market Revenue Million Forecast, by Country 2019 & 2032
- Table 12: United States US Waste To Energy Market Revenue (Million) Forecast, by Application 2019 & 2032
- Table 13: Canada US Waste To Energy Market Revenue (Million) Forecast, by Application 2019 & 2032
- Table 14: Mexico US Waste To Energy Market Revenue (Million) Forecast, by Application 2019 & 2032
- Table 15: Global US Waste To Energy Market Revenue Million Forecast, by Technology 2019 & 2032
- Table 16: Global US Waste To Energy Market Revenue Million Forecast, by Country 2019 & 2032
- Table 17: Brazil US Waste To Energy Market Revenue (Million) Forecast, by Application 2019 & 2032
- Table 18: Argentina US Waste To Energy Market Revenue (Million) Forecast, by Application 2019 & 2032
- Table 19: Rest of South America US Waste To Energy Market Revenue (Million) Forecast, by Application 2019 & 2032
- Table 20: Global US Waste To Energy Market Revenue Million Forecast, by Technology 2019 & 2032
- Table 21: Global US Waste To Energy Market Revenue Million Forecast, by Country 2019 & 2032
- Table 22: United Kingdom US Waste To Energy Market Revenue (Million) Forecast, by Application 2019 & 2032
- Table 23: Germany US Waste To Energy Market Revenue (Million) Forecast, by Application 2019 & 2032
- Table 24: France US Waste To Energy Market Revenue (Million) Forecast, by Application 2019 & 2032
- Table 25: Italy US Waste To Energy Market Revenue (Million) Forecast, by Application 2019 & 2032
- Table 26: Spain US Waste To Energy Market Revenue (Million) Forecast, by Application 2019 & 2032
- Table 27: Russia US Waste To Energy Market Revenue (Million) Forecast, by Application 2019 & 2032
- Table 28: Benelux US Waste To Energy Market Revenue (Million) Forecast, by Application 2019 & 2032
- Table 29: Nordics US Waste To Energy Market Revenue (Million) Forecast, by Application 2019 & 2032
- Table 30: Rest of Europe US Waste To Energy Market Revenue (Million) Forecast, by Application 2019 & 2032
- Table 31: Global US Waste To Energy Market Revenue Million Forecast, by Technology 2019 & 2032
- Table 32: Global US Waste To Energy Market Revenue Million Forecast, by Country 2019 & 2032
- Table 33: Turkey US Waste To Energy Market Revenue (Million) Forecast, by Application 2019 & 2032
- Table 34: Israel US Waste To Energy Market Revenue (Million) Forecast, by Application 2019 & 2032
- Table 35: GCC US Waste To Energy Market Revenue (Million) Forecast, by Application 2019 & 2032
- Table 36: North Africa US Waste To Energy Market Revenue (Million) Forecast, by Application 2019 & 2032
- Table 37: South Africa US Waste To Energy Market Revenue (Million) Forecast, by Application 2019 & 2032
- Table 38: Rest of Middle East & Africa US Waste To Energy Market Revenue (Million) Forecast, by Application 2019 & 2032
- Table 39: Global US Waste To Energy Market Revenue Million Forecast, by Technology 2019 & 2032
- Table 40: Global US Waste To Energy Market Revenue Million Forecast, by Country 2019 & 2032
- Table 41: China US Waste To Energy Market Revenue (Million) Forecast, by Application 2019 & 2032
- Table 42: India US Waste To Energy Market Revenue (Million) Forecast, by Application 2019 & 2032
- Table 43: Japan US Waste To Energy Market Revenue (Million) Forecast, by Application 2019 & 2032
- Table 44: South Korea US Waste To Energy Market Revenue (Million) Forecast, by Application 2019 & 2032
- Table 45: ASEAN US Waste To Energy Market Revenue (Million) Forecast, by Application 2019 & 2032
- Table 46: Oceania US Waste To Energy Market Revenue (Million) Forecast, by Application 2019 & 2032
- Table 47: Rest of Asia Pacific US Waste To Energy Market Revenue (Million) Forecast, by Application 2019 & 2032
Frequently Asked Questions
1. What is the projected Compound Annual Growth Rate (CAGR) of the US Waste To Energy Market?
The projected CAGR is approximately > 7.26%.
2. Which companies are prominent players in the US Waste To Energy Market?
Key companies in the market include Suez SA, Martin GmbH, Wheelabrator Technologies Inc, Waste Management Inc, Covanta Holding Corp *List Not Exhaustive.
3. What are the main segments of the US Waste To Energy Market?
The market segments include Technology.
4. Can you provide details about the market size?
The market size is estimated to be USD XX Million as of 2022.
5. What are some drivers contributing to market growth?
4.; Global Inclination toward Renewable-based Power Generation4.; Increased Power Demand in Line with the Increasing Population.
6. What are the notable trends driving market growth?
Thermal Based Waste to Energy Conversion to Dominate the Market.
7. Are there any restraints impacting market growth?
4.; High Initial Cost.
8. Can you provide examples of recent developments in the market?
October 2022: Kore Infrastructure announced the successful one-year demonstration of its waste-to-energy modular system in Los Angeles, California. The company's technology can produce 100% renewable energy from organic waste using a closed-loop, carbon-negative process.
9. What pricing options are available for accessing the report?
Pricing options include single-user, multi-user, and enterprise licenses priced at USD 3800, USD 4500, and USD 5800 respectively.
10. Is the market size provided in terms of value or volume?
The market size is provided in terms of value, measured in Million.
11. Are there any specific market keywords associated with the report?
Yes, the market keyword associated with the report is "US Waste To Energy Market," which aids in identifying and referencing the specific market segment covered.
12. How do I determine which pricing option suits my needs best?
The pricing options vary based on user requirements and access needs. Individual users may opt for single-user licenses, while businesses requiring broader access may choose multi-user or enterprise licenses for cost-effective access to the report.
13. Are there any additional resources or data provided in the US Waste To Energy Market report?
While the report offers comprehensive insights, it's advisable to review the specific contents or supplementary materials provided to ascertain if additional resources or data are available.
14. How can I stay updated on further developments or reports in the US Waste To Energy Market?
To stay informed about further developments, trends, and reports in the US Waste To Energy Market, consider subscribing to industry newsletters, following relevant companies and organizations, or regularly checking reputable industry news sources and publications.
Methodology
Step 1 - Identification of Relevant Samples Size from Population Database


Step 2 - Approaches for Defining Global Market Size (Value, Volume* & Price*)

Note*: In applicable scenarios
Step 3 - Data Sources
Primary Research
- Web Analytics
- Survey Reports
- Research Institute
- Latest Research Reports
- Opinion Leaders
Secondary Research
- Annual Reports
- White Paper
- Latest Press Release
- Industry Association
- Paid Database
- Investor Presentations

Step 4 - Data Triangulation
Involves using different sources of information in order to increase the validity of a study
These sources are likely to be stakeholders in a program - participants, other researchers, program staff, other community members, and so on.
Then we put all data in single framework & apply various statistical tools to find out the dynamic on the market.
During the analysis stage, feedback from the stakeholder groups would be compared to determine areas of agreement as well as areas of divergence
