

Key Insights
The global oil and gas pipeline industry is projected for significant growth, forecasted to reach a market size of 103.63 billion by 2025, with a Compound Annual Growth Rate (CAGR) of 5.03% through 2033. This expansion is driven by increasing global energy demand, necessitating improved crude oil and natural gas transportation infrastructure. Key growth factors include investments in new pipeline projects in emerging economies, continuous maintenance and upgrades of existing assets, and the development of offshore pipelines for accessing remote reserves. The industry is adopting advanced materials and technologies for construction and monitoring, prioritizing safety, efficiency, and environmental compliance. Innovations in smart pipeline technology, leak detection, and corrosion prevention are transforming operations.
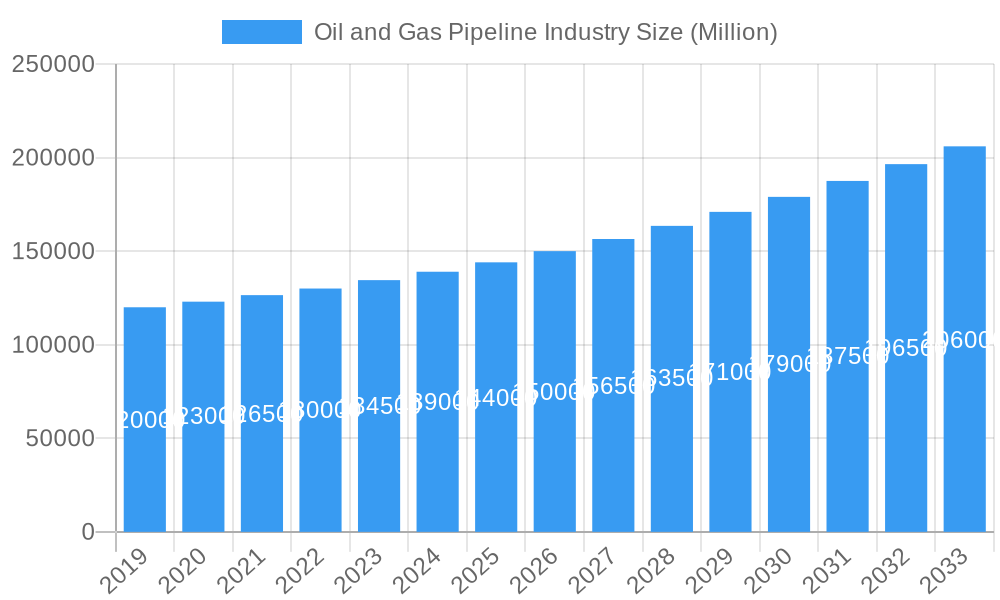
Oil and Gas Pipeline Industry Market Size (In Billion)
Challenges include stringent environmental regulations and complex permitting processes, potentially causing project delays and cost overruns, alongside geopolitical uncertainties and fluctuating energy prices impacting investment. The market is segmented by deployment (onshore, offshore) and type (crude oil pipeline, gas pipeline). The gas pipeline segment is expected to experience robust growth due to the rising preference for natural gas as a cleaner energy source. Geographically, North America and the Middle East & Africa will likely lead, supported by established infrastructure and exploration. Asia Pacific is poised for the fastest growth, driven by industrialization and escalating energy consumption. Leading companies such as TMK Group, TechnipFMC PLC, and Tenaris Inc. are spearheading innovation and market expansion.
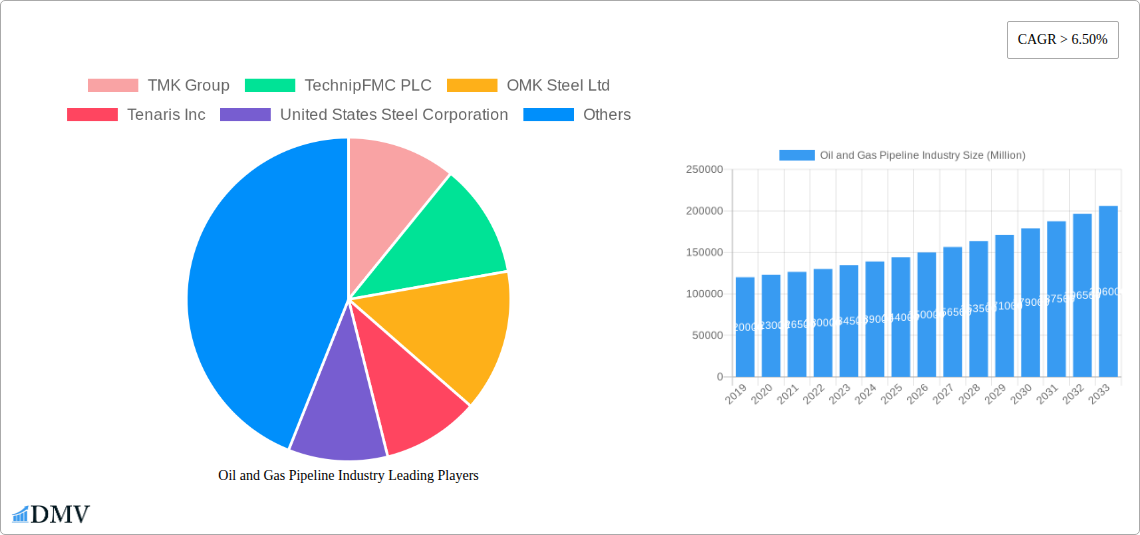
Oil and Gas Pipeline Industry Company Market Share
Oil and Gas Pipeline Industry: Comprehensive Market Analysis & Future Outlook (2019-2033)
This in-depth report offers a definitive analysis of the global Oil and Gas Pipeline Industry, providing critical insights into market dynamics, growth trajectories, and strategic opportunities. Spanning the historical period of 2019-2024 and projecting to 2033 with a base and estimated year of 2025, this report is an indispensable resource for stakeholders seeking to navigate the evolving landscape of crude oil and gas transportation infrastructure. The study meticulously examines market composition, industry evolution, leading regional segments, product innovations, growth drivers, market obstacles, future opportunities, major players, key developments, and strategic market forecasts, all vital for informed decision-making in the oil and gas pipeline market, pipeline construction, and energy infrastructure development.
Oil and Gas Pipeline Industry Market Composition & Trends
The oil and gas pipeline industry exhibits a moderately concentrated market structure, with a significant portion of the market share held by a few dominant players, including TMK Group, TechnipFMC PLC, OMK Steel Ltd, Tenaris Inc, United States Steel Corporation, Nippon Steel Corporation, ChelPipe Group, and Shengli Oil & Gas Pipe Holdings Limited. Innovation is a key catalyst, driven by the persistent demand for efficient, safe, and environmentally sound pipeline solutions. Regulatory landscapes worldwide are increasingly stringent, focusing on safety standards, environmental protection, and operational integrity, thereby influencing investment decisions and technological advancements in pipeline integrity management. Substitute products, such as alternative transportation methods like rail and sea, exist but are often less cost-effective and efficient for large-scale, long-distance oil and gas transport. End-user profiles primarily consist of national and international oil and gas exploration and production companies, refineries, and distribution networks. Mergers and Acquisitions (M&A) activities are notable, with deal values often in the range of hundreds of millions to billions of USD, reflecting consolidation and strategic expansion within the sector. For instance, M&A deal values in the past year are estimated to be around $5,000 Million. The distribution of market share, with top players holding approximately 60% of the global market, underscores the competitive intensity and the strategic importance of securing contracts and technological leadership in oil pipeline construction and gas pipeline infrastructure.
Oil and Gas Pipeline Industry Industry Evolution
The oil and gas pipeline industry has undergone a significant evolution, driven by dynamic market growth trajectories, relentless technological advancements, and shifting consumer demands. Over the historical period (2019-2024), the industry witnessed a steady increase in demand for both crude oil and natural gas pipelines, fueled by growing energy consumption globally and the need to access new reserves. The market growth rate during this period averaged approximately 4.5% annually. Technological innovation has been a paramount force, transforming the efficiency and safety of pipeline operations. Advancements in materials science have led to the development of stronger, more corrosion-resistant steel alloys, enhancing pipeline lifespan and reducing maintenance costs. Furthermore, the adoption of sophisticated monitoring and diagnostic technologies, including inline inspection tools (e.g., smart pigs) and real-time data analytics, has revolutionized pipeline leak detection and predictive maintenance, minimizing the risk of environmental incidents and operational disruptions. The integration of digital twin technology and AI-powered systems is further optimizing pipeline network management. Shifting consumer demands, particularly the increasing global emphasis on environmental sustainability and the transition towards cleaner energy sources, are also influencing the industry's evolution. While traditional fossil fuels remain dominant, there is a growing interest and investment in pipelines designed for the transportation of hydrogen and carbon capture, utilization, and storage (CCUS) projects. This foresight is crucial for the long-term viability of energy transportation networks. The estimated market size for oil and gas pipelines in 2025 is valued at $180,000 Million, with projections indicating a robust CAGR of 4.8% during the forecast period (2025-2033). This growth is underpinned by significant investments in expanding and upgrading existing infrastructure, particularly in emerging economies and regions with substantial hydrocarbon reserves. The industry's ability to adapt to these evolving demands, embracing new technologies and expanding its scope to include new energy mediums, will be critical for sustained growth and relevance in the coming decade.
Leading Regions, Countries, or Segments in Oil and Gas Pipeline Industry
The oil and gas pipeline industry is heavily influenced by regional dynamics, with significant dominance observed across different deployment locations and pipeline types.
Location of Deployment:
- Onshore Pipelines: This segment currently holds the largest market share, estimated at approximately 75% of the total market value in 2025. The widespread availability of land resources and the established infrastructure networks in major producing and consuming nations contribute to this dominance. Key drivers include large-scale oil and gas pipeline projects for domestic distribution and intercontinental transfer. Investments are particularly robust in North America, the Middle East, and parts of Asia.
- Offshore Pipelines: While smaller in market share (estimated at 25% in 2025), the offshore segment is experiencing rapid growth, driven by the increasing need to access deep-sea oil and gas reserves. Advancements in subsea technology and specialized engineering expertise are crucial for the successful execution of these complex projects. The North Sea, Gulf of Mexico, and parts of Asia Pacific are prominent regions for offshore pipeline development.
Type:
- Gas Pipelines: This segment is projected to exhibit higher growth rates due to the increasing global demand for natural gas as a cleaner alternative to coal and oil, and its expanding role in power generation and industrial processes. The market share for gas pipelines is estimated to reach 55% by 2033, up from 52% in 2025. Significant investments are being made in expanding natural gas transmission networks, especially in regions with burgeoning liquefied natural gas (LNG) import/export capabilities and shale gas production.
- Crude Oil Pipelines: This segment remains a cornerstone of the industry, essential for transporting crude oil from production sites to refineries and ports. While its growth may be more moderate compared to gas pipelines, it continues to be a vital component of the global energy supply chain. The market share for crude oil pipelines is projected to be around 45% in 2025, with steady growth driven by the development of new oil fields and the optimization of existing transportation routes.
Dominance Factors: The dominance of onshore pipelines is largely attributed to the extensive existing infrastructure and the lower perceived risk and cost compared to offshore installations. Major countries like the United States, Canada, Russia, and China heavily invest in onshore natural gas pipeline networks and crude oil transportation systems to meet domestic energy demands and facilitate exports. In the offshore sector, advancements in subsea welding, trenching, and remote operated vehicles (ROVs) have made deepwater pipeline construction more feasible and cost-effective. Regulatory support for energy infrastructure development, coupled with significant capital investments from national oil companies and major energy corporations, are critical drivers for market leadership in these regions. Furthermore, the strategic importance of energy security and the economic benefits derived from efficient resource transportation solidify the importance of robust pipeline networks, making this a critical sector for energy infrastructure investment.
Oil and Gas Pipeline Industry Product Innovations
Product innovation in the oil and gas pipeline industry is focused on enhancing safety, efficiency, and environmental sustainability. Advanced steel alloys with superior tensile strength and corrosion resistance are being developed to extend pipeline lifespans and withstand harsh operating conditions, reducing the need for frequent maintenance. Smart coatings and internal lining technologies are improving flow efficiency and preventing internal erosion. Furthermore, the integration of advanced sensor technologies and IoT devices allows for real-time monitoring of pipeline integrity, pressure, and flow rates, enabling proactive leak detection and predictive maintenance. These innovations directly contribute to improved operational performance and reduced environmental risks.
Propelling Factors for Oil and Gas Pipeline Industry Growth
The oil and gas pipeline industry is propelled by several key growth drivers. Firstly, the increasing global demand for energy, particularly natural gas as a cleaner fuel, necessitates the expansion and upgrade of existing pipeline infrastructure. Secondly, technological advancements in materials science and pipeline construction techniques are making projects more feasible and cost-effective. For example, innovations in horizontal directional drilling (HDD) allow for more efficient and environmentally friendly pipeline crossings. Thirdly, favorable government policies and incentives aimed at enhancing energy security and facilitating energy trade encourage significant capital investment in new pipeline projects. Finally, the discovery of new oil and gas reserves in remote or challenging locations necessitates the development of extensive pipeline networks for transportation.
Obstacles in the Oil and Gas Pipeline Industry Market
Despite robust growth, the oil and gas pipeline industry faces several obstacles. Stringent and evolving environmental regulations pose significant challenges, increasing project costs and lead times for permits and approvals. Supply chain disruptions, exacerbated by geopolitical events and raw material price volatility, can impact project timelines and budgets. Moreover, intense competition among pipeline construction companies and the high capital intensity of large-scale projects create financial pressures. Public opposition and land acquisition challenges in certain regions can also lead to project delays or cancellations. The cost of maintaining aging infrastructure and ensuring pipeline safety compliance also presents an ongoing challenge, with estimated annual maintenance costs reaching $2,000 Million globally.
Future Opportunities in Oil and Gas Pipeline Industry
Emerging opportunities in the oil and gas pipeline industry are diverse and promising. The growing demand for renewable energy has spurred interest in repurposing existing pipelines or constructing new ones for hydrogen transportation and carbon dioxide (CO2) sequestration, crucial for carbon capture and storage (CCS) initiatives. Expansion into emerging markets with significant untapped hydrocarbon reserves presents substantial growth potential. Furthermore, the increasing adoption of digital technologies, such as AI-powered predictive maintenance and advanced robotics for inspections, offers opportunities for improved operational efficiency and cost reduction. The development of smaller, modular pipeline systems for niche applications is also an area of potential growth.
Major Players in the Oil and Gas Pipeline Industry Ecosystem
- TMK Group
- TechnipFMC PLC
- OMK Steel Ltd
- Tenaris Inc
- United States Steel Corporation
- Nippon Steel Corporation
- ChelPipe Group
- Shengli Oil & Gas Pipe Holdings Limited
- Mott Macdonald Group Ltd
Key Developments in Oil and Gas Pipeline Industry Industry
- June 2022: Kalpataru Power Transmission Limited (KPTL) secured a significant contract for the laying and construction of a steel gas pipeline and terminals, along with associated facilities, for Section II of the Mumbai - Nagpur Pipeline Project (Part A) for GAIL (India) Ltd. This development highlights the ongoing investment in gas infrastructure in India.
- December 2022: Argentina successfully obtained financing of USD 689 Million from the Brazilian state development bank BNDES for the second stage of a natural gas pipeline project in the Vaca Muerta shale region. This underscores the strategic importance of natural gas development and cross-border energy cooperation in South America, particularly for enhancing shale gas infrastructure.
Strategic Oil and Gas Pipeline Industry Market Forecast
The strategic outlook for the oil and gas pipeline industry is robust, driven by sustained global energy demand and a strong commitment to enhancing energy security. Growth catalysts include the increasing adoption of natural gas as a transitional fuel, the development of new hydrocarbon reserves, and the expanding infrastructure for renewable energy carriers like hydrogen. Technological advancements in pipeline materials, construction techniques, and digital monitoring are expected to further optimize operations and reduce environmental impact. Investments in emerging markets and the ongoing need to upgrade aging infrastructure in developed nations will ensure consistent project pipelines. The market is poised for continued expansion, with a projected market size of approximately $250,000 Million by 2033, reflecting significant opportunities for innovation and growth in energy transportation solutions.
Oil and Gas Pipeline Industry Segmentation
-
1. Location of Deployment
- 1.1. Onshore
- 1.2. Offshore
-
2. Type
- 2.1. Crude Oil Pipeline
- 2.2. Gas Pipeline
Oil and Gas Pipeline Industry Segmentation By Geography
- 1. North America
- 2. Europe
- 3. Asia Pacific
- 4. South America
- 5. Middle East and Africa
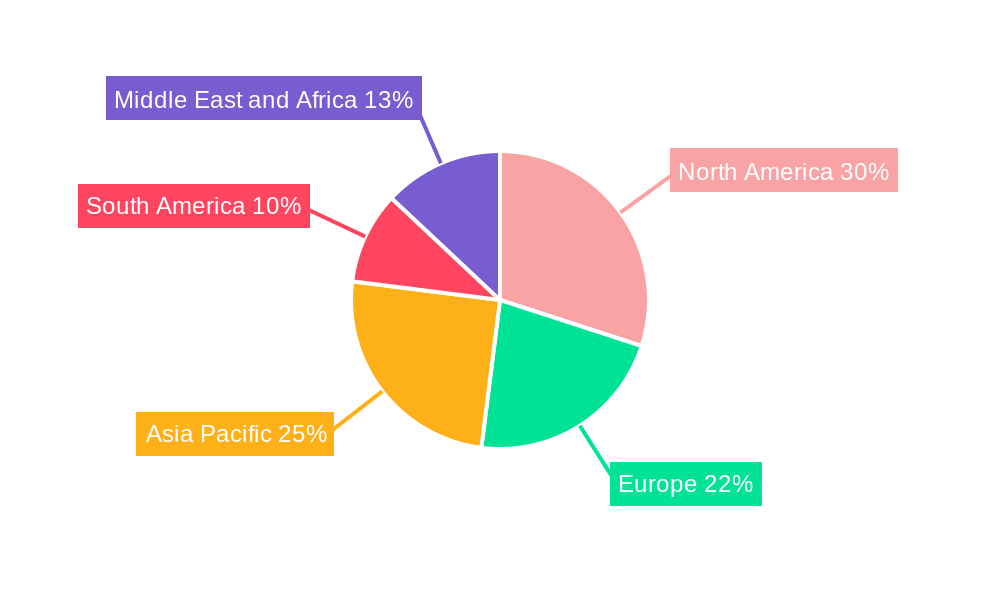
Oil and Gas Pipeline Industry Regional Market Share
Geographic Coverage of Oil and Gas Pipeline Industry
Oil and Gas Pipeline Industry REPORT HIGHLIGHTS
| Aspects | Details |
|---|---|
| Study Period | 2020-2034 |
| Base Year | 2025 |
| Estimated Year | 2026 |
| Forecast Period | 2026-2034 |
| Historical Period | 2020-2025 |
| Growth Rate | CAGR of 5.03% from 2020-2034 |
| Segmentation |
|
Table of Contents
- 1. Introduction
- 1.1. Research Scope
- 1.2. Market Segmentation
- 1.3. Research Objective
- 1.4. Definitions and Assumptions
- 2. Executive Summary
- 2.1. Market Snapshot
- 3. Market Dynamics
- 3.1. Market Drivers
- 3.2. Market Restrains
- 3.3. Market Trends
- 3.4. Market Opportunities
- 4. Market Factor Analysis
- 4.1. Porters Five Forces
- 4.1.1. Bargaining Power of Suppliers
- 4.1.2. Bargaining Power of Buyers
- 4.1.3. Threat of New Entrants
- 4.1.4. Threat of Substitutes
- 4.1.5. Competitive Rivalry
- 4.2. PESTEL analysis
- 4.3. BCG Analysis
- 4.3.1. Stars (High Growth, High Market Share)
- 4.3.2. Cash Cows (Low Growth, High Market Share)
- 4.3.3. Question Mark (High Growth, Low Market Share)
- 4.3.4. Dogs (Low Growth, Low Market Share)
- 4.4. Ansoff Matrix Analysis
- 4.5. Supply Chain Analysis
- 4.6. Regulatory Landscape
- 4.7. Current Market Potential and Opportunity Assessment (TAM–SAM–SOM Framework)
- 4.8. DMV Analyst Note
- 4.1. Porters Five Forces
- 5. Market Analysis, Insights and Forecast 2021-2033
- 5.1. Market Analysis, Insights and Forecast - by Location of Deployment
- 5.1.1. Onshore
- 5.1.2. Offshore
- 5.2. Market Analysis, Insights and Forecast - by Type
- 5.2.1. Crude Oil Pipeline
- 5.2.2. Gas Pipeline
- 5.3. Market Analysis, Insights and Forecast - by Region
- 5.3.1. North America
- 5.3.2. Europe
- 5.3.3. Asia Pacific
- 5.3.4. South America
- 5.3.5. Middle East and Africa
- 5.1. Market Analysis, Insights and Forecast - by Location of Deployment
- 6. Global Oil and Gas Pipeline Industry Analysis, Insights and Forecast, 2021-2033
- 6.1. Market Analysis, Insights and Forecast - by Location of Deployment
- 6.1.1. Onshore
- 6.1.2. Offshore
- 6.2. Market Analysis, Insights and Forecast - by Type
- 6.2.1. Crude Oil Pipeline
- 6.2.2. Gas Pipeline
- 6.1. Market Analysis, Insights and Forecast - by Location of Deployment
- 7. North America Oil and Gas Pipeline Industry Analysis, Insights and Forecast, 2020-2032
- 7.1. Market Analysis, Insights and Forecast - by Location of Deployment
- 7.1.1. Onshore
- 7.1.2. Offshore
- 7.2. Market Analysis, Insights and Forecast - by Type
- 7.2.1. Crude Oil Pipeline
- 7.2.2. Gas Pipeline
- 7.1. Market Analysis, Insights and Forecast - by Location of Deployment
- 8. Europe Oil and Gas Pipeline Industry Analysis, Insights and Forecast, 2020-2032
- 8.1. Market Analysis, Insights and Forecast - by Location of Deployment
- 8.1.1. Onshore
- 8.1.2. Offshore
- 8.2. Market Analysis, Insights and Forecast - by Type
- 8.2.1. Crude Oil Pipeline
- 8.2.2. Gas Pipeline
- 8.1. Market Analysis, Insights and Forecast - by Location of Deployment
- 9. Asia Pacific Oil and Gas Pipeline Industry Analysis, Insights and Forecast, 2020-2032
- 9.1. Market Analysis, Insights and Forecast - by Location of Deployment
- 9.1.1. Onshore
- 9.1.2. Offshore
- 9.2. Market Analysis, Insights and Forecast - by Type
- 9.2.1. Crude Oil Pipeline
- 9.2.2. Gas Pipeline
- 9.1. Market Analysis, Insights and Forecast - by Location of Deployment
- 10. South America Oil and Gas Pipeline Industry Analysis, Insights and Forecast, 2020-2032
- 10.1. Market Analysis, Insights and Forecast - by Location of Deployment
- 10.1.1. Onshore
- 10.1.2. Offshore
- 10.2. Market Analysis, Insights and Forecast - by Type
- 10.2.1. Crude Oil Pipeline
- 10.2.2. Gas Pipeline
- 10.1. Market Analysis, Insights and Forecast - by Location of Deployment
- 11. Middle East and Africa Oil and Gas Pipeline Industry Analysis, Insights and Forecast, 2020-2032
- 11.1. Market Analysis, Insights and Forecast - by Location of Deployment
- 11.1.1. Onshore
- 11.1.2. Offshore
- 11.2. Market Analysis, Insights and Forecast - by Type
- 11.2.1. Crude Oil Pipeline
- 11.2.2. Gas Pipeline
- 11.1. Market Analysis, Insights and Forecast - by Location of Deployment
- 12. Competitive Analysis
- 12.1. Company Profiles
- 12.1.1 TMK Group
- 12.1.1.1. Company Overview
- 12.1.1.2. Products
- 12.1.1.3. Company Financials
- 12.1.1.4. SWOT Analysis
- 12.1.2 TechnipFMC PLC
- 12.1.2.1. Company Overview
- 12.1.2.2. Products
- 12.1.2.3. Company Financials
- 12.1.2.4. SWOT Analysis
- 12.1.3 OMK Steel Ltd
- 12.1.3.1. Company Overview
- 12.1.3.2. Products
- 12.1.3.3. Company Financials
- 12.1.3.4. SWOT Analysis
- 12.1.4 Tenaris Inc
- 12.1.4.1. Company Overview
- 12.1.4.2. Products
- 12.1.4.3. Company Financials
- 12.1.4.4. SWOT Analysis
- 12.1.5 United States Steel Corporation
- 12.1.5.1. Company Overview
- 12.1.5.2. Products
- 12.1.5.3. Company Financials
- 12.1.5.4. SWOT Analysis
- 12.1.6 Nippon Steel Corporation
- 12.1.6.1. Company Overview
- 12.1.6.2. Products
- 12.1.6.3. Company Financials
- 12.1.6.4. SWOT Analysis
- 12.1.7 ChelPipe Group
- 12.1.7.1. Company Overview
- 12.1.7.2. Products
- 12.1.7.3. Company Financials
- 12.1.7.4. SWOT Analysis
- 12.1.8 Shengli Oil & Gas Pipe Holdings Limited
- 12.1.8.1. Company Overview
- 12.1.8.2. Products
- 12.1.8.3. Company Financials
- 12.1.8.4. SWOT Analysis
- 12.1.9 Mott Macdonald Group Ltd
- 12.1.9.1. Company Overview
- 12.1.9.2. Products
- 12.1.9.3. Company Financials
- 12.1.9.4. SWOT Analysis
- 12.1.1 TMK Group
- 12.2. Market Entropy
- 12.2.1 Company's Key Areas Served
- 12.2.2 Recent Developments
- 12.3. Company Market Share Analysis 2025
- 12.3.1 Top 5 Companies Market Share Analysis
- 12.3.2 Top 3 Companies Market Share Analysis
- 12.4. List of Potential Customers
- 13. Research Methodology
List of Figures
- Figure 1: Global Oil and Gas Pipeline Industry Revenue Breakdown (billion, %) by Region 2025 & 2033
- Figure 2: North America Oil and Gas Pipeline Industry Revenue (billion), by Location of Deployment 2025 & 2033
- Figure 3: North America Oil and Gas Pipeline Industry Revenue Share (%), by Location of Deployment 2025 & 2033
- Figure 4: North America Oil and Gas Pipeline Industry Revenue (billion), by Type 2025 & 2033
- Figure 5: North America Oil and Gas Pipeline Industry Revenue Share (%), by Type 2025 & 2033
- Figure 6: North America Oil and Gas Pipeline Industry Revenue (billion), by Country 2025 & 2033
- Figure 7: North America Oil and Gas Pipeline Industry Revenue Share (%), by Country 2025 & 2033
- Figure 8: Europe Oil and Gas Pipeline Industry Revenue (billion), by Location of Deployment 2025 & 2033
- Figure 9: Europe Oil and Gas Pipeline Industry Revenue Share (%), by Location of Deployment 2025 & 2033
- Figure 10: Europe Oil and Gas Pipeline Industry Revenue (billion), by Type 2025 & 2033
- Figure 11: Europe Oil and Gas Pipeline Industry Revenue Share (%), by Type 2025 & 2033
- Figure 12: Europe Oil and Gas Pipeline Industry Revenue (billion), by Country 2025 & 2033
- Figure 13: Europe Oil and Gas Pipeline Industry Revenue Share (%), by Country 2025 & 2033
- Figure 14: Asia Pacific Oil and Gas Pipeline Industry Revenue (billion), by Location of Deployment 2025 & 2033
- Figure 15: Asia Pacific Oil and Gas Pipeline Industry Revenue Share (%), by Location of Deployment 2025 & 2033
- Figure 16: Asia Pacific Oil and Gas Pipeline Industry Revenue (billion), by Type 2025 & 2033
- Figure 17: Asia Pacific Oil and Gas Pipeline Industry Revenue Share (%), by Type 2025 & 2033
- Figure 18: Asia Pacific Oil and Gas Pipeline Industry Revenue (billion), by Country 2025 & 2033
- Figure 19: Asia Pacific Oil and Gas Pipeline Industry Revenue Share (%), by Country 2025 & 2033
- Figure 20: South America Oil and Gas Pipeline Industry Revenue (billion), by Location of Deployment 2025 & 2033
- Figure 21: South America Oil and Gas Pipeline Industry Revenue Share (%), by Location of Deployment 2025 & 2033
- Figure 22: South America Oil and Gas Pipeline Industry Revenue (billion), by Type 2025 & 2033
- Figure 23: South America Oil and Gas Pipeline Industry Revenue Share (%), by Type 2025 & 2033
- Figure 24: South America Oil and Gas Pipeline Industry Revenue (billion), by Country 2025 & 2033
- Figure 25: South America Oil and Gas Pipeline Industry Revenue Share (%), by Country 2025 & 2033
- Figure 26: Middle East and Africa Oil and Gas Pipeline Industry Revenue (billion), by Location of Deployment 2025 & 2033
- Figure 27: Middle East and Africa Oil and Gas Pipeline Industry Revenue Share (%), by Location of Deployment 2025 & 2033
- Figure 28: Middle East and Africa Oil and Gas Pipeline Industry Revenue (billion), by Type 2025 & 2033
- Figure 29: Middle East and Africa Oil and Gas Pipeline Industry Revenue Share (%), by Type 2025 & 2033
- Figure 30: Middle East and Africa Oil and Gas Pipeline Industry Revenue (billion), by Country 2025 & 2033
- Figure 31: Middle East and Africa Oil and Gas Pipeline Industry Revenue Share (%), by Country 2025 & 2033
List of Tables
- Table 1: Global Oil and Gas Pipeline Industry Revenue billion Forecast, by Location of Deployment 2020 & 2033
- Table 2: Global Oil and Gas Pipeline Industry Revenue billion Forecast, by Type 2020 & 2033
- Table 3: Global Oil and Gas Pipeline Industry Revenue billion Forecast, by Region 2020 & 2033
- Table 4: Global Oil and Gas Pipeline Industry Revenue billion Forecast, by Location of Deployment 2020 & 2033
- Table 5: Global Oil and Gas Pipeline Industry Revenue billion Forecast, by Type 2020 & 2033
- Table 6: Global Oil and Gas Pipeline Industry Revenue billion Forecast, by Country 2020 & 2033
- Table 7: Global Oil and Gas Pipeline Industry Revenue billion Forecast, by Location of Deployment 2020 & 2033
- Table 8: Global Oil and Gas Pipeline Industry Revenue billion Forecast, by Type 2020 & 2033
- Table 9: Global Oil and Gas Pipeline Industry Revenue billion Forecast, by Country 2020 & 2033
- Table 10: Global Oil and Gas Pipeline Industry Revenue billion Forecast, by Location of Deployment 2020 & 2033
- Table 11: Global Oil and Gas Pipeline Industry Revenue billion Forecast, by Type 2020 & 2033
- Table 12: Global Oil and Gas Pipeline Industry Revenue billion Forecast, by Country 2020 & 2033
- Table 13: Global Oil and Gas Pipeline Industry Revenue billion Forecast, by Location of Deployment 2020 & 2033
- Table 14: Global Oil and Gas Pipeline Industry Revenue billion Forecast, by Type 2020 & 2033
- Table 15: Global Oil and Gas Pipeline Industry Revenue billion Forecast, by Country 2020 & 2033
- Table 16: Global Oil and Gas Pipeline Industry Revenue billion Forecast, by Location of Deployment 2020 & 2033
- Table 17: Global Oil and Gas Pipeline Industry Revenue billion Forecast, by Type 2020 & 2033
- Table 18: Global Oil and Gas Pipeline Industry Revenue billion Forecast, by Country 2020 & 2033
Frequently Asked Questions
1. What is the projected Compound Annual Growth Rate (CAGR) of the Oil and Gas Pipeline Industry?
The projected CAGR is approximately 5.03%.
2. Which companies are prominent players in the Oil and Gas Pipeline Industry?
Key companies in the market include TMK Group, TechnipFMC PLC, OMK Steel Ltd, Tenaris Inc, United States Steel Corporation, Nippon Steel Corporation, ChelPipe Group, Shengli Oil & Gas Pipe Holdings Limited, Mott Macdonald Group Ltd.
3. What are the main segments of the Oil and Gas Pipeline Industry?
The market segments include Location of Deployment, Type.
4. Can you provide details about the market size?
The market size is estimated to be USD 103.63 billion as of 2022.
5. What are some drivers contributing to market growth?
4.; Rising Demand for Increaing Refinening Capacity4.; Increasing Investment in Downstream Sector.
6. What are the notable trends driving market growth?
The Gas Pipeline Segment to Dominate the Market.
7. Are there any restraints impacting market growth?
4.; Fluctuating Price of Crude Oil May Impede the Development of the Downstream Sector.
8. Can you provide examples of recent developments in the market?
June 2022: Kalpataru Power Transmission Limited (KPTL) was awarded the laying & construction of a steel gas pipeline and terminals along with associated facilities for Section II of the Mumbai - Nagpur Pipeline Project (Part A) for GAIL (India) Ltd.
9. What pricing options are available for accessing the report?
Pricing options include single-user, multi-user, and enterprise licenses priced at USD 4750, USD 5250, and USD 8750 respectively.
10. Is the market size provided in terms of value or volume?
The market size is provided in terms of value, measured in billion.
11. Are there any specific market keywords associated with the report?
Yes, the market keyword associated with the report is "Oil and Gas Pipeline Industry," which aids in identifying and referencing the specific market segment covered.
12. How do I determine which pricing option suits my needs best?
The pricing options vary based on user requirements and access needs. Individual users may opt for single-user licenses, while businesses requiring broader access may choose multi-user or enterprise licenses for cost-effective access to the report.
13. Are there any additional resources or data provided in the Oil and Gas Pipeline Industry report?
While the report offers comprehensive insights, it's advisable to review the specific contents or supplementary materials provided to ascertain if additional resources or data are available.
14. How can I stay updated on further developments or reports in the Oil and Gas Pipeline Industry?
To stay informed about further developments, trends, and reports in the Oil and Gas Pipeline Industry, consider subscribing to industry newsletters, following relevant companies and organizations, or regularly checking reputable industry news sources and publications.
Methodology
Step 1 - Identification of Relevant Samples Size from Population Database


Step 2 - Approaches for Defining Global Market Size (Value, Volume* & Price*)

Note*: In applicable scenarios
Step 3 - Data Sources
Primary Research
- Web Analytics
- Survey Reports
- Research Institute
- Latest Research Reports
- Opinion Leaders
Secondary Research
- Annual Reports
- White Paper
- Latest Press Release
- Industry Association
- Paid Database
- Investor Presentations

Step 4 - Data Triangulation
Involves using different sources of information in order to increase the validity of a study
These sources are likely to be stakeholders in a program - participants, other researchers, program staff, other community members, and so on.
Then we put all data in single framework & apply various statistical tools to find out the dynamic on the market.
During the analysis stage, feedback from the stakeholder groups would be compared to determine areas of agreement as well as areas of divergence