

Key Insights
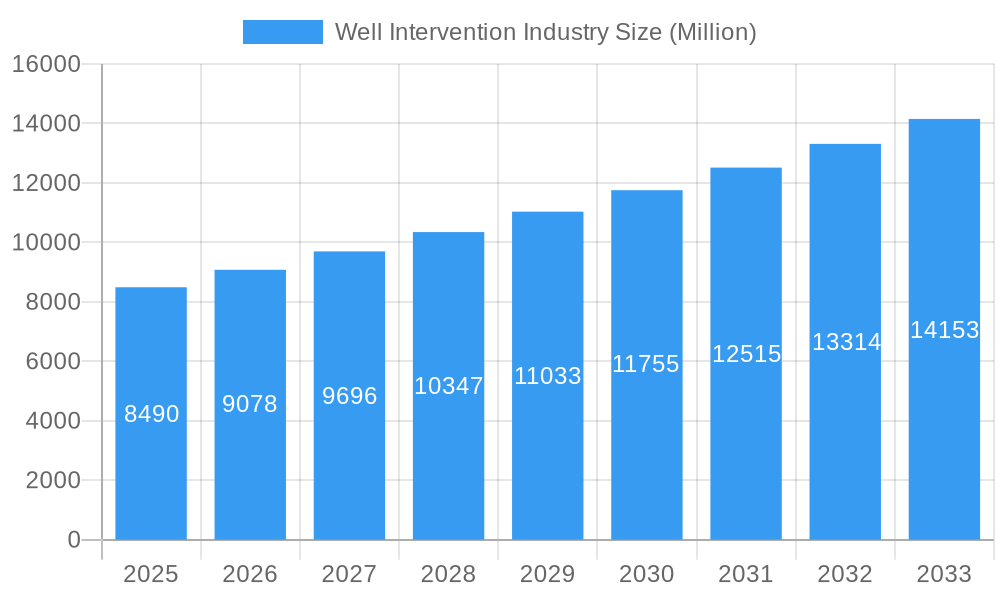
The global Well Intervention Market is poised for significant expansion, projected to reach an estimated \$8.49 billion by 2025. This growth is fueled by a robust Compound Annual Growth Rate (CAGR) of 6.80%, indicating a dynamic and expanding industry. The market's vitality is primarily driven by the increasing demand for enhanced oil recovery (EOR) techniques, particularly in mature fields requiring optimization to maintain production levels. Furthermore, the imperative to extend the lifespan of existing oil and gas wells, coupled with the declining cost of intervention services, is acting as a substantial market accelerant. As global energy demands continue to rise, the strategic importance of maximizing output from established reserves becomes paramount, directly translating into sustained investment in well intervention technologies and services. The forecast period from 2025 to 2033 anticipates a steady upward trajectory, underscoring the long-term viability and strategic importance of this sector within the broader energy landscape.
Well Intervention Industry Market Size (In Billion)
Key trends shaping the Well Intervention Market include the increasing adoption of digital technologies and automation for enhanced efficiency and safety, such as advanced data analytics for predictive maintenance and the deployment of remotely operated vehicles (ROVs) for complex operations. The market is also witnessing a growing emphasis on environmentally friendly intervention methods and a shift towards more specialized services for unconventional reservoirs. However, the market faces certain restraints, including volatile crude oil prices that can impact investment decisions and the stringent regulatory landscape in various regions, which can add complexity and cost to operations. Geographically, North America, driven by its substantial onshore and offshore exploration and production activities, is expected to maintain a leading position. The Asia Pacific region, with its burgeoning energy needs and increasing investments in oil and gas infrastructure, presents a significant growth opportunity, alongside the Middle East and Africa, which possess vast reserves and ongoing development projects.
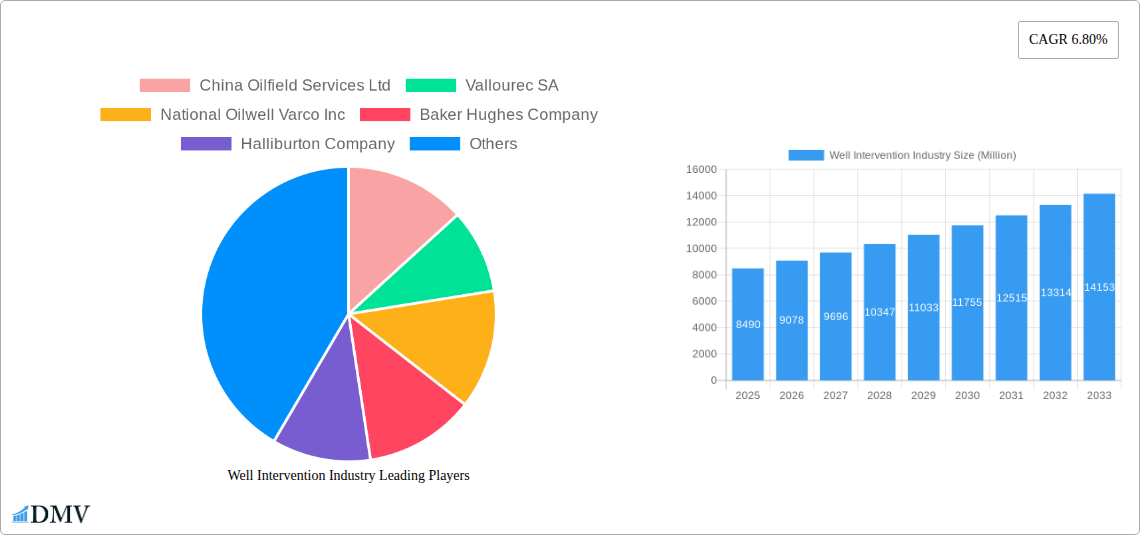
Well Intervention Industry Company Market Share
Well Intervention Industry Market Composition & Trends
The global Well Intervention Industry is characterized by a dynamic market composition, driven by a strategic interplay of technological innovation, evolving regulatory landscapes, and concentrated M&A activities. The market concentration is evident with key players like Schlumberger Limited, Halliburton Company, Baker Hughes Company, and China Oilfield Services Ltd dominating significant market shares, estimated in the range of 15-20% each. Innovation catalysts are predominantly focused on enhancing production efficiency, reducing operational costs, and improving safety standards, with a notable surge in R&D investments. Regulatory frameworks, while providing essential safety guidelines, also present opportunities for specialized service providers adept at navigating compliance. The threat of substitute products is relatively low, given the critical nature of well intervention in maximizing hydrocarbon recovery and extending asset life. End-user profiles span national oil companies, independent producers, and international oil companies, all seeking reliable and cost-effective solutions. M&A activities are strategically shaping the market, with estimated deal values ranging from XXX Million to XXX Million, aimed at expanding service portfolios and geographical reach. The market is projected for robust growth, fueled by the increasing demand for mature field rejuvenation and the imperative to meet global energy needs.
- Market Share Distribution: Leading companies collectively hold an estimated 70% of the market share.
- M&A Deal Values: Recent strategic acquisitions and mergers have seen deal values fluctuating between XXX Million and XXX Million.
- Innovation Focus: Emphasis on digitalization, artificial intelligence, and advanced materials for enhanced performance and reduced environmental impact.
- Regulatory Impact: Stringent safety and environmental regulations drive demand for specialized and compliant intervention services.
Well Intervention Industry Industry Evolution
The Well Intervention Industry has undergone a significant evolution, marked by consistent market growth trajectories, transformative technological advancements, and a palpable shift in consumer demands. Over the historical period of 2019-2024, the industry experienced a compound annual growth rate (CAGR) of approximately 4.5%, a testament to the enduring need for production optimization and asset integrity management. The estimated year of 2025 is projected to see this growth momentum continue, with an anticipated CAGR of 5.0% leading into the forecast period of 2025-2033. This sustained expansion is intrinsically linked to the increasing complexity of mature oil and gas fields, where primary recovery methods are no longer sufficient to meet production targets. Consequently, operators are increasingly relying on sophisticated well intervention techniques to enhance hydrocarbon recovery, repair damaged wells, and extend the productive lifespan of existing assets.
Technological advancements have been the primary engine driving this evolution. The advent of sophisticated downhole tools, advanced logging services, and real-time data analytics has revolutionized the efficiency and effectiveness of well intervention operations. For instance, the adoption of digital twin technology and AI-powered predictive maintenance algorithms allows for proactive identification of potential well issues, enabling timely intervention and minimizing costly downtime. Furthermore, the development of innovative artificial lift systems and enhanced oil recovery (EOR) techniques, such as chemical flooding and CO2 injection, are critical components of modern well intervention strategies. These technologies not only boost production but also contribute to more sustainable extraction practices.
Shifting consumer demands have also played a crucial role. There is a growing emphasis on cost-effectiveness and operational efficiency. Clients are actively seeking intervention service providers who can deliver comprehensive solutions that minimize operational expenditures while maximizing return on investment. This has led to a greater demand for integrated service models, where a single provider offers a suite of intervention services, thereby streamlining project management and reducing logistical complexities. Environmental considerations are also becoming increasingly prominent, with a rising preference for intervention methods that minimize environmental impact and adhere to stringent regulatory standards. The industry is responding by developing greener intervention fluids, optimizing waste management practices, and implementing technologies that reduce carbon emissions. The strategic shift towards maximizing production from existing reserves, driven by global energy security concerns and the ongoing energy transition, ensures the continued relevance and growth of the well intervention sector.
Leading Regions, Countries, or Segments in Well Intervention Industry
The global Well Intervention Industry is significantly influenced by regional dynamics, with the Offshore segment consistently demonstrating dominance in terms of market value and strategic importance. This leadership is underpinned by a confluence of factors including higher hydrocarbon reserves located in offshore basins, escalating exploration and production activities in deepwater and ultra-deepwater environments, and the inherent complexities associated with offshore operations that necessitate specialized and robust intervention solutions. The historical period of 2019-2024 has seen offshore well intervention expenditure consistently outpace its onshore counterpart, with projections for the forecast period of 2025-2033 indicating a widening gap.
Key drivers contributing to the offshore segment's prominence include:
- Investment Trends: Major oil-producing nations with extensive offshore continental shelves continue to allocate substantial capital towards offshore exploration and production, directly translating into increased demand for well intervention services. Countries such as Norway, the United States (Gulf of Mexico), Brazil, and countries in the Middle East are significant contributors to this trend. The recent contract awarded to TechnipFMC by Equinor for RLWI services on the Norwegian Continental Shelf, commencing in 2024, exemplifies the sustained investment in offshore production enhancement and maintenance.
- Technological Advancements: The development and deployment of advanced technologies specifically designed for the harsh offshore environment, such as remotely operated vehicles (ROVs), subsea intervention systems, and riserless light well intervention (RLWI) capabilities, have made complex offshore operations more feasible and cost-effective, thereby stimulating demand. The consent granted to Norske Shell by the Petroleum Safety Authority Norway (PSA) to use the Island Constructor vessel for well intervention on the Knarr and Gaupe fields highlights the increasing reliance on specialized vessels and equipment for offshore operations.
- Resource Complexity and Maturity: Many of the world's most prolific offshore fields are mature, requiring continuous intervention to maintain production levels and optimize recovery. The deeper and more challenging reservoirs discovered offshore further necessitate sophisticated intervention techniques for effective well management and integrity.
- Regulatory Support and Safety Standards: While regulatory landscapes in offshore environments can be stringent, they also drive innovation and demand for highly specialized services that meet rigorous safety and environmental standards. This often favors established players with proven track records in complex offshore operations.
The onshore segment, while substantial, often faces different market dynamics, including a higher degree of price sensitivity and a more fragmented operational landscape. However, specific onshore regions, particularly those with extensive mature fields and declining production, continue to present significant intervention opportunities. The dominance of the offshore segment is a strategic imperative driven by the nature of global energy reserves and the technological capabilities required to access and maintain them. As the industry looks towards the forecast period, continued innovation in subsea technologies and a focus on extending the life of existing offshore assets will further solidify the offshore segment's leading position in the Well Intervention Industry.
Well Intervention Industry Product Innovations
The Well Intervention Industry is continually being redefined by groundbreaking product innovations focused on enhancing efficiency, safety, and environmental stewardship. Advancements in digital subsurface diagnostics, including AI-powered real-time data analysis and predictive modeling, are revolutionizing well integrity monitoring and intervention planning. The development of advanced coil tubing and slickline technologies, engineered with lighter yet stronger materials, enables deeper access and more precise operations in challenging wellbore conditions. Furthermore, specialized stimulation fluids and advanced cementing solutions are being developed to maximize reservoir stimulation while minimizing formation damage and environmental impact. The unique selling proposition of these innovations lies in their ability to reduce non-productive time (NPT), lower operational costs, and extend the life of producing assets, thereby delivering superior economic returns for operators.
Propelling Factors for Well Intervention Industry Growth
Several critical factors are propelling the growth of the Well Intervention Industry. Firstly, the increasing maturity of global oil and gas fields necessitates ongoing intervention to maintain and optimize production, acting as a primary growth driver. Secondly, the global demand for energy continues to rise, pushing operators to maximize recovery from existing reserves, thereby boosting the need for intervention services. Thirdly, technological advancements, particularly in digitalization, automation, and specialized equipment, are making intervention operations more efficient, cost-effective, and safer, encouraging their wider adoption. Finally, stringent environmental regulations and a focus on extending asset life are compelling operators to invest in well integrity management and production enhancement interventions, further fueling market expansion.
- Mature Field Production Optimization: Essential for sustaining output from aging reservoirs.
- Rising Global Energy Demand: Driving the need to maximize hydrocarbon recovery from all available sources.
- Technological Advancements: Enabling more efficient, cost-effective, and safer intervention techniques.
- Environmental Stewardship & Asset Life Extension: Regulatory pressures and economic incentives for responsible production.
Obstacles in the Well Intervention Industry Market
The Well Intervention Industry faces several significant obstacles that can impede its growth trajectory. Regulatory complexities and evolving environmental mandates in various operating regions create compliance challenges and can lead to project delays or increased operational costs. Supply chain disruptions, exacerbated by geopolitical factors and global economic volatility, can impact the availability and cost of specialized equipment and personnel, leading to project scheduling issues and inflated service fees. Intensifying competitive pressures among a growing number of service providers, especially in fragmented markets, can lead to price erosion and reduced profit margins. Furthermore, the inherent risks associated with complex wellbore environments can result in non-productive time (NPT) and potential safety incidents, which add to operational expenses and can deter investment.
Future Opportunities in Well Intervention Industry
The Well Intervention Industry is poised for significant future opportunities driven by emerging trends and technological advancements. The increasing focus on decarbonization and energy transition presents opportunities for intervention services aimed at managing aging infrastructure, including plugging and abandonment (P&A) services for depleted wells, and interventions for carbon capture, utilization, and storage (CCUS) projects. The expansion of offshore wind farm development also creates a demand for specialized subsea intervention expertise for foundation and cable maintenance. Furthermore, the adoption of digitalization and artificial intelligence will continue to unlock new efficiencies, enabling predictive interventions and remote operations, leading to cost reductions and improved safety outcomes. Emerging markets and the development of unconventional resources will also contribute to sustained demand for innovative intervention solutions.
Major Players in the Well Intervention Industry Ecosystem
- Schlumberger Limited
- Halliburton Company
- Baker Hughes Company
- China Oilfield Services Ltd
- Weatherford International Ltd
- Vallourec SA
- National Oilwell Varco Inc
- Scientific Drilling International Inc
Key Developments in Well Intervention Industry Industry
- May 2023: TechnipFMC secured a contract from Equinor to provide riserless light well intervention (RLWI) services on the Norwegian Continental Shelf, focusing on production enhancement, production data, and pre-plug-and-abandonment services from 2024 to 2025, with options for three subsequent years. This development highlights the increasing demand for RLWI solutions for production optimization and life extension in mature offshore fields.
- March 2023: Petroleum Safety Authority Norway (PSA) granted consent to Norske Shell for the utilization of the Island Constructor vessel for well intervention operations on the Knarr and Gaupe fields. This signifies ongoing operational activities and regulatory approvals for specialized intervention vessels in key offshore regions.
Strategic Well Intervention Industry Market Forecast
The strategic Well Intervention Industry market forecast indicates a robust growth trajectory fueled by escalating global energy demands and the imperative to maximize recovery from existing hydrocarbon reserves. The increasing complexity of mature fields and the continued exploration in challenging offshore environments necessitate sophisticated intervention techniques for production optimization, asset integrity, and life extension. Technological advancements, particularly in digitalization, AI-driven analytics, and advanced downhole tools, are set to enhance operational efficiency, reduce costs, and improve safety, thereby stimulating market penetration. Furthermore, the growing emphasis on environmental compliance and the burgeoning opportunities in areas like carbon capture and storage are creating new avenues for intervention service providers. The market is expected to witness sustained growth, driven by innovation, strategic collaborations, and the continuous need to unlock the full potential of global energy resources.
Well Intervention Industry Segmentation
-
1. Location of Deployment
- 1.1. Onshore
- 1.2. Offshore
Well Intervention Industry Segmentation By Geography
-
1. North America
- 1.1. United States of America
- 1.2. Canada
- 1.3. Rest of the North America
-
2. Europe
- 2.1. United Kingdom
- 2.2. France
- 2.3. Germany
- 2.4. Italy
- 2.5. Rest of the Europe
-
3. Asia Pacific
- 3.1. China
- 3.2. India
- 3.3. South Korea
- 3.4. Rest of the Asia Pacific
-
4. South America
- 4.1. Brazil
- 4.2. Argentina
- 4.3. Rest of the South America
-
5. Middle East and Africa
- 5.1. United Arab Emirates
- 5.2. Saudi Arabia
- 5.3. Rest of the Middle East and Africa
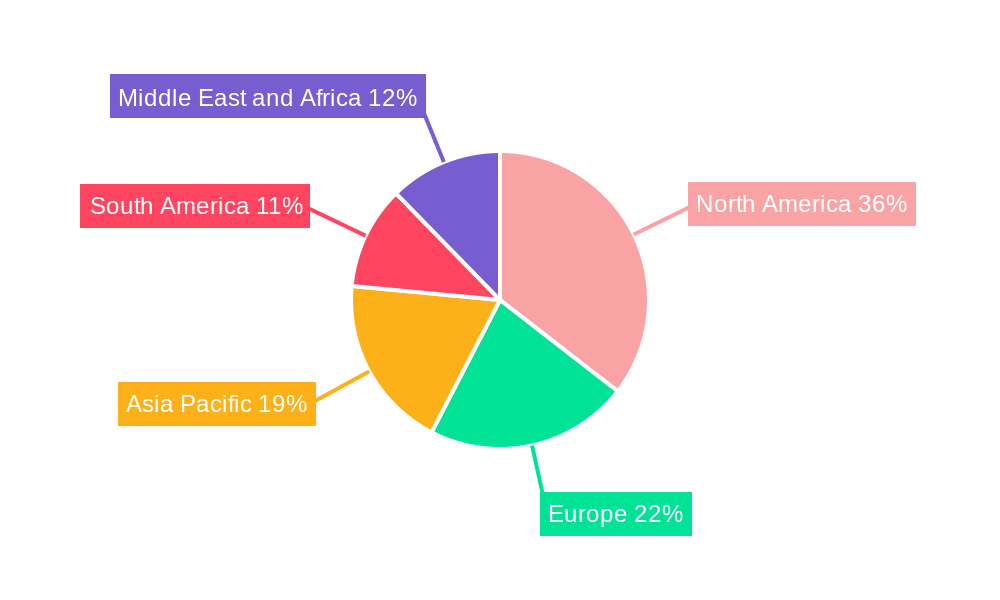
Well Intervention Industry Regional Market Share
Geographic Coverage of Well Intervention Industry
Well Intervention Industry REPORT HIGHLIGHTS
| Aspects | Details |
|---|---|
| Study Period | 2020-2034 |
| Base Year | 2025 |
| Estimated Year | 2026 |
| Forecast Period | 2026-2034 |
| Historical Period | 2020-2025 |
| Growth Rate | CAGR of 6.80% from 2020-2034 |
| Segmentation |
|
Table of Contents
- 1. Introduction
- 1.1. Research Scope
- 1.2. Market Segmentation
- 1.3. Research Objective
- 1.4. Definitions and Assumptions
- 2. Executive Summary
- 2.1. Market Snapshot
- 3. Market Dynamics
- 3.1. Market Drivers
- 3.2. Market Restrains
- 3.3. Market Trends
- 3.4. Market Opportunities
- 4. Market Factor Analysis
- 4.1. Porters Five Forces
- 4.1.1. Bargaining Power of Suppliers
- 4.1.2. Bargaining Power of Buyers
- 4.1.3. Threat of New Entrants
- 4.1.4. Threat of Substitutes
- 4.1.5. Competitive Rivalry
- 4.2. PESTEL analysis
- 4.3. BCG Analysis
- 4.3.1. Stars (High Growth, High Market Share)
- 4.3.2. Cash Cows (Low Growth, High Market Share)
- 4.3.3. Question Mark (High Growth, Low Market Share)
- 4.3.4. Dogs (Low Growth, Low Market Share)
- 4.4. Ansoff Matrix Analysis
- 4.5. Supply Chain Analysis
- 4.6. Regulatory Landscape
- 4.7. Current Market Potential and Opportunity Assessment (TAM–SAM–SOM Framework)
- 4.8. DMV Analyst Note
- 4.1. Porters Five Forces
- 5. Market Analysis, Insights and Forecast 2021-2033
- 5.1. Market Analysis, Insights and Forecast - by Location of Deployment
- 5.1.1. Onshore
- 5.1.2. Offshore
- 5.2. Market Analysis, Insights and Forecast - by Region
- 5.2.1. North America
- 5.2.2. Europe
- 5.2.3. Asia Pacific
- 5.2.4. South America
- 5.2.5. Middle East and Africa
- 5.1. Market Analysis, Insights and Forecast - by Location of Deployment
- 6. Global Well Intervention Industry Analysis, Insights and Forecast, 2021-2033
- 6.1. Market Analysis, Insights and Forecast - by Location of Deployment
- 6.1.1. Onshore
- 6.1.2. Offshore
- 6.1. Market Analysis, Insights and Forecast - by Location of Deployment
- 7. North America Well Intervention Industry Analysis, Insights and Forecast, 2020-2032
- 7.1. Market Analysis, Insights and Forecast - by Location of Deployment
- 7.1.1. Onshore
- 7.1.2. Offshore
- 7.1. Market Analysis, Insights and Forecast - by Location of Deployment
- 8. Europe Well Intervention Industry Analysis, Insights and Forecast, 2020-2032
- 8.1. Market Analysis, Insights and Forecast - by Location of Deployment
- 8.1.1. Onshore
- 8.1.2. Offshore
- 8.1. Market Analysis, Insights and Forecast - by Location of Deployment
- 9. Asia Pacific Well Intervention Industry Analysis, Insights and Forecast, 2020-2032
- 9.1. Market Analysis, Insights and Forecast - by Location of Deployment
- 9.1.1. Onshore
- 9.1.2. Offshore
- 9.1. Market Analysis, Insights and Forecast - by Location of Deployment
- 10. South America Well Intervention Industry Analysis, Insights and Forecast, 2020-2032
- 10.1. Market Analysis, Insights and Forecast - by Location of Deployment
- 10.1.1. Onshore
- 10.1.2. Offshore
- 10.1. Market Analysis, Insights and Forecast - by Location of Deployment
- 11. Middle East and Africa Well Intervention Industry Analysis, Insights and Forecast, 2020-2032
- 11.1. Market Analysis, Insights and Forecast - by Location of Deployment
- 11.1.1. Onshore
- 11.1.2. Offshore
- 11.1. Market Analysis, Insights and Forecast - by Location of Deployment
- 12. Competitive Analysis
- 12.1. Company Profiles
- 12.1.1 China Oilfield Services Ltd
- 12.1.1.1. Company Overview
- 12.1.1.2. Products
- 12.1.1.3. Company Financials
- 12.1.1.4. SWOT Analysis
- 12.1.2 Vallourec SA
- 12.1.2.1. Company Overview
- 12.1.2.2. Products
- 12.1.2.3. Company Financials
- 12.1.2.4. SWOT Analysis
- 12.1.3 National Oilwell Varco Inc
- 12.1.3.1. Company Overview
- 12.1.3.2. Products
- 12.1.3.3. Company Financials
- 12.1.3.4. SWOT Analysis
- 12.1.4 Baker Hughes Company
- 12.1.4.1. Company Overview
- 12.1.4.2. Products
- 12.1.4.3. Company Financials
- 12.1.4.4. SWOT Analysis
- 12.1.5 Halliburton Company
- 12.1.5.1. Company Overview
- 12.1.5.2. Products
- 12.1.5.3. Company Financials
- 12.1.5.4. SWOT Analysis
- 12.1.6 Weatherford International Ltd
- 12.1.6.1. Company Overview
- 12.1.6.2. Products
- 12.1.6.3. Company Financials
- 12.1.6.4. SWOT Analysis
- 12.1.7 Schlumberger Limited
- 12.1.7.1. Company Overview
- 12.1.7.2. Products
- 12.1.7.3. Company Financials
- 12.1.7.4. SWOT Analysis
- 12.1.8 Scientific Drilling International Inc
- 12.1.8.1. Company Overview
- 12.1.8.2. Products
- 12.1.8.3. Company Financials
- 12.1.8.4. SWOT Analysis
- 12.1.1 China Oilfield Services Ltd
- 12.2. Market Entropy
- 12.2.1 Company's Key Areas Served
- 12.2.2 Recent Developments
- 12.3. Company Market Share Analysis 2025
- 12.3.1 Top 5 Companies Market Share Analysis
- 12.3.2 Top 3 Companies Market Share Analysis
- 12.4. List of Potential Customers
- 13. Research Methodology
List of Figures
- Figure 1: Global Well Intervention Industry Revenue Breakdown (Million, %) by Region 2025 & 2033
- Figure 2: North America Well Intervention Industry Revenue (Million), by Location of Deployment 2025 & 2033
- Figure 3: North America Well Intervention Industry Revenue Share (%), by Location of Deployment 2025 & 2033
- Figure 4: North America Well Intervention Industry Revenue (Million), by Country 2025 & 2033
- Figure 5: North America Well Intervention Industry Revenue Share (%), by Country 2025 & 2033
- Figure 6: Europe Well Intervention Industry Revenue (Million), by Location of Deployment 2025 & 2033
- Figure 7: Europe Well Intervention Industry Revenue Share (%), by Location of Deployment 2025 & 2033
- Figure 8: Europe Well Intervention Industry Revenue (Million), by Country 2025 & 2033
- Figure 9: Europe Well Intervention Industry Revenue Share (%), by Country 2025 & 2033
- Figure 10: Asia Pacific Well Intervention Industry Revenue (Million), by Location of Deployment 2025 & 2033
- Figure 11: Asia Pacific Well Intervention Industry Revenue Share (%), by Location of Deployment 2025 & 2033
- Figure 12: Asia Pacific Well Intervention Industry Revenue (Million), by Country 2025 & 2033
- Figure 13: Asia Pacific Well Intervention Industry Revenue Share (%), by Country 2025 & 2033
- Figure 14: South America Well Intervention Industry Revenue (Million), by Location of Deployment 2025 & 2033
- Figure 15: South America Well Intervention Industry Revenue Share (%), by Location of Deployment 2025 & 2033
- Figure 16: South America Well Intervention Industry Revenue (Million), by Country 2025 & 2033
- Figure 17: South America Well Intervention Industry Revenue Share (%), by Country 2025 & 2033
- Figure 18: Middle East and Africa Well Intervention Industry Revenue (Million), by Location of Deployment 2025 & 2033
- Figure 19: Middle East and Africa Well Intervention Industry Revenue Share (%), by Location of Deployment 2025 & 2033
- Figure 20: Middle East and Africa Well Intervention Industry Revenue (Million), by Country 2025 & 2033
- Figure 21: Middle East and Africa Well Intervention Industry Revenue Share (%), by Country 2025 & 2033
List of Tables
- Table 1: Global Well Intervention Industry Revenue Million Forecast, by Location of Deployment 2020 & 2033
- Table 2: Global Well Intervention Industry Revenue Million Forecast, by Region 2020 & 2033
- Table 3: Global Well Intervention Industry Revenue Million Forecast, by Location of Deployment 2020 & 2033
- Table 4: Global Well Intervention Industry Revenue Million Forecast, by Country 2020 & 2033
- Table 5: United States of America Well Intervention Industry Revenue (Million) Forecast, by Application 2020 & 2033
- Table 6: Canada Well Intervention Industry Revenue (Million) Forecast, by Application 2020 & 2033
- Table 7: Rest of the North America Well Intervention Industry Revenue (Million) Forecast, by Application 2020 & 2033
- Table 8: Global Well Intervention Industry Revenue Million Forecast, by Location of Deployment 2020 & 2033
- Table 9: Global Well Intervention Industry Revenue Million Forecast, by Country 2020 & 2033
- Table 10: United Kingdom Well Intervention Industry Revenue (Million) Forecast, by Application 2020 & 2033
- Table 11: France Well Intervention Industry Revenue (Million) Forecast, by Application 2020 & 2033
- Table 12: Germany Well Intervention Industry Revenue (Million) Forecast, by Application 2020 & 2033
- Table 13: Italy Well Intervention Industry Revenue (Million) Forecast, by Application 2020 & 2033
- Table 14: Rest of the Europe Well Intervention Industry Revenue (Million) Forecast, by Application 2020 & 2033
- Table 15: Global Well Intervention Industry Revenue Million Forecast, by Location of Deployment 2020 & 2033
- Table 16: Global Well Intervention Industry Revenue Million Forecast, by Country 2020 & 2033
- Table 17: China Well Intervention Industry Revenue (Million) Forecast, by Application 2020 & 2033
- Table 18: India Well Intervention Industry Revenue (Million) Forecast, by Application 2020 & 2033
- Table 19: South Korea Well Intervention Industry Revenue (Million) Forecast, by Application 2020 & 2033
- Table 20: Rest of the Asia Pacific Well Intervention Industry Revenue (Million) Forecast, by Application 2020 & 2033
- Table 21: Global Well Intervention Industry Revenue Million Forecast, by Location of Deployment 2020 & 2033
- Table 22: Global Well Intervention Industry Revenue Million Forecast, by Country 2020 & 2033
- Table 23: Brazil Well Intervention Industry Revenue (Million) Forecast, by Application 2020 & 2033
- Table 24: Argentina Well Intervention Industry Revenue (Million) Forecast, by Application 2020 & 2033
- Table 25: Rest of the South America Well Intervention Industry Revenue (Million) Forecast, by Application 2020 & 2033
- Table 26: Global Well Intervention Industry Revenue Million Forecast, by Location of Deployment 2020 & 2033
- Table 27: Global Well Intervention Industry Revenue Million Forecast, by Country 2020 & 2033
- Table 28: United Arab Emirates Well Intervention Industry Revenue (Million) Forecast, by Application 2020 & 2033
- Table 29: Saudi Arabia Well Intervention Industry Revenue (Million) Forecast, by Application 2020 & 2033
- Table 30: Rest of the Middle East and Africa Well Intervention Industry Revenue (Million) Forecast, by Application 2020 & 2033
Frequently Asked Questions
1. What is the projected Compound Annual Growth Rate (CAGR) of the Well Intervention Industry?
The projected CAGR is approximately 6.80%.
2. Which companies are prominent players in the Well Intervention Industry?
Key companies in the market include China Oilfield Services Ltd, Vallourec SA, National Oilwell Varco Inc, Baker Hughes Company, Halliburton Company, Weatherford International Ltd, Schlumberger Limited, Scientific Drilling International Inc.
3. What are the main segments of the Well Intervention Industry?
The market segments include Location of Deployment.
4. Can you provide details about the market size?
The market size is estimated to be USD 8.49 Million as of 2022.
5. What are some drivers contributing to market growth?
4.; Increased Drilling and Completion Activities.
6. What are the notable trends driving market growth?
Offshore Segment to have a Significant Market Share.
7. Are there any restraints impacting market growth?
4.; Volatility of Oil Prices.
8. Can you provide examples of recent developments in the market?
In May 2023, TechnipFMC got a contract from Equinor to provide riserless light well intervention (RLWI) services on the Norwegian Continental Shelf. The contract includes production enhancement, production data, and pre-plug-and-abandonment services with a time bond from 2024 to 2025, with options to extend for the three subsequent years.
9. What pricing options are available for accessing the report?
Pricing options include single-user, multi-user, and enterprise licenses priced at USD 4750, USD 5250, and USD 8750 respectively.
10. Is the market size provided in terms of value or volume?
The market size is provided in terms of value, measured in Million.
11. Are there any specific market keywords associated with the report?
Yes, the market keyword associated with the report is "Well Intervention Industry," which aids in identifying and referencing the specific market segment covered.
12. How do I determine which pricing option suits my needs best?
The pricing options vary based on user requirements and access needs. Individual users may opt for single-user licenses, while businesses requiring broader access may choose multi-user or enterprise licenses for cost-effective access to the report.
13. Are there any additional resources or data provided in the Well Intervention Industry report?
While the report offers comprehensive insights, it's advisable to review the specific contents or supplementary materials provided to ascertain if additional resources or data are available.
14. How can I stay updated on further developments or reports in the Well Intervention Industry?
To stay informed about further developments, trends, and reports in the Well Intervention Industry, consider subscribing to industry newsletters, following relevant companies and organizations, or regularly checking reputable industry news sources and publications.
Methodology
Step 1 - Identification of Relevant Samples Size from Population Database


Step 2 - Approaches for Defining Global Market Size (Value, Volume* & Price*)

Note*: In applicable scenarios
Step 3 - Data Sources
Primary Research
- Web Analytics
- Survey Reports
- Research Institute
- Latest Research Reports
- Opinion Leaders
Secondary Research
- Annual Reports
- White Paper
- Latest Press Release
- Industry Association
- Paid Database
- Investor Presentations

Step 4 - Data Triangulation
Involves using different sources of information in order to increase the validity of a study
These sources are likely to be stakeholders in a program - participants, other researchers, program staff, other community members, and so on.
Then we put all data in single framework & apply various statistical tools to find out the dynamic on the market.
During the analysis stage, feedback from the stakeholder groups would be compared to determine areas of agreement as well as areas of divergence