

Key Insights
The global Crude Oil Carriers market is projected for significant expansion, expected to reach $225142.8 million by 2025, driven by a CAGR of 4.6%. This growth is underpinned by rising global energy consumption, especially in developing economies, and consistent oil production from key regions. The escalating need for crude oil in power generation, transportation, and industrial sectors necessitates an enlarged and more efficient carrier fleet. Key growth catalysts include new oil reserve exploration and extraction, ensuring stable energy supply chains, and government efforts to enhance energy security via diversified imports. Advancements in vessel design, focusing on fuel efficiency and safety, also contribute to fleet modernization and market expansion.
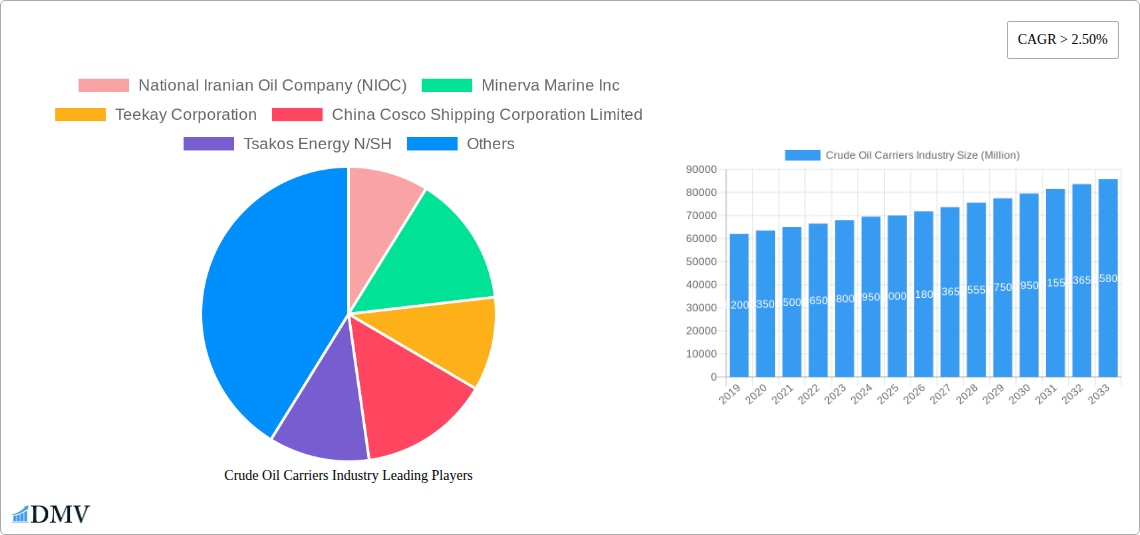
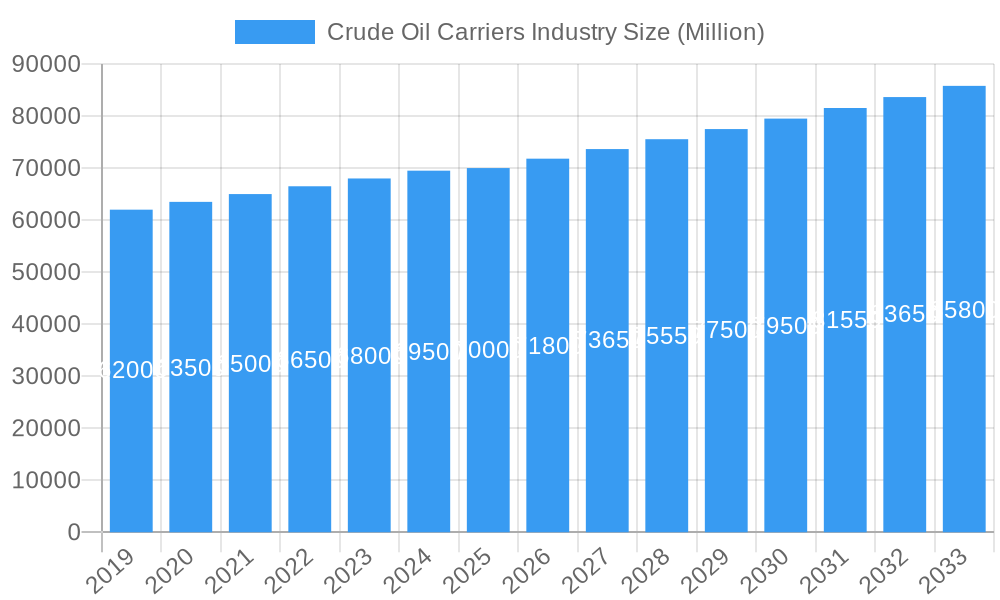
Crude Oil Carriers Industry Market Size (In Billion)
The market is segmented by vessel size, including Medium Range, Panaxax, Aframax, Suezmax, and Very Large Crude Carriers (VLCCs), each serving distinct trade routes and cargo capacities. VLCCs lead in long-haul routes, while Aframax dominate regional trades, illustrating diverse market demands. Leading companies such as National Iranian Oil Company (NIOC), Minerva Marine Inc., Teekay Corporation, China Cosco Shipping Corporation Limited, and Euronav NV are investing in fleet expansion and technological enhancements to leverage these opportunities. However, the industry faces challenges such as stringent environmental regulations, fluctuating oil prices, geopolitical risks affecting trade, and the increasing adoption of renewable energy sources which may reduce long-term oil demand. Notwithstanding these hurdles, the continued global reliance on oil ensures a robust and growing market for crude oil carriers, with the Asia Pacific region anticipated to be a primary growth hub.
Crude Oil Carriers Industry Company Market Share
The Crude Oil Carriers industry is experiencing substantial growth, driven by increasing global energy demand and strategic importance of oil supply chains. Technological advancements and fleet modernization are key factors supporting this expansion. Despite regulatory and geopolitical challenges, the market is set for a strong future, particularly in emerging economic regions.
Crude Oil Carriers Industry Market Composition & Trends
This comprehensive report dissects the intricate market composition and evolving trends within the global Crude Oil Carriers Industry. We provide an in-depth evaluation of market concentration, identifying key players and their market share distribution, with an estimated collective market capitalization exceeding 300,000 Million. The study delves into innovation catalysts, analyzing how advancements in vessel technology and operational efficiency are shaping the competitive landscape. Understanding the regulatory landscapes, including IMO 2020 compliance and future environmental mandates, is crucial for navigating this sector. We examine the influence of substitute products, such as pipelines and alternative energy sources, on crude oil transportation demand. End-user profiles, primarily major oil producers and refineries, are meticulously detailed, highlighting their distinct transportation needs. Furthermore, the report scrutinizes Merger & Acquisition (M&A) activities, estimating total M&A deal values to be in the tens of thousands of Millions during the historical period, indicating significant consolidation and strategic partnerships within the industry.
- Market Concentration: Analysis of leading companies and their estimated market share.
- Innovation Catalysts: Identification of key technological and operational advancements driving the market.
- Regulatory Landscapes: Overview of current and upcoming regulations impacting crude oil shipping.
- Substitute Products: Assessment of alternative transportation methods and their impact.
- End-User Profiles: Detailed analysis of major consumers of crude oil transportation services.
- M&A Activities: Examination of recent M&A deals and their strategic implications, with an estimated value of xx Million.
Crude Oil Carriers Industry Industry Evolution
The Crude Oil Carriers Industry has undergone a significant transformation, shaped by economic volatilities, technological leaps, and shifting geopolitical dynamics. Over the historical period of 2019–2024, the industry navigated fluctuating crude oil prices, impacting tanker demand and charter rates. A critical inflection point was the IMO 2020 regulation, mandating the use of low-sulfur fuel oil, which necessitated substantial fleet upgrades and operational adjustments, estimated to have cost billions in retrofitting and new builds. This period also witnessed a gradual but persistent shift towards more environmentally conscious shipping practices, with owners investing in technologies like ballast water treatment systems and exploring decarbonization strategies. The base year of 2025 is positioned at a pivotal moment, reflecting the industry's adaptation to these new environmental standards and its readiness to capitalize on projected demand growth.
Technological advancements have played a transformative role. The introduction of larger and more fuel-efficient vessels, such as Very Large Crude Carriers (VLCCs) and Suezmax tankers, has improved economies of scale for transporting crude oil across vast distances. The adoption of digitalization and automation in vessel operations, including advanced navigation systems and predictive maintenance, has enhanced safety, efficiency, and cost-effectiveness. We project a compound annual growth rate (CAGR) of approximately 4.5% for the forecast period of 2025–2033, driven by increasing global energy demand and the need for secure and reliable crude oil transportation. Adoption metrics for advanced hull coatings, for instance, are estimated to have increased by over 20% by 2025, leading to fuel savings of up to 5%. Furthermore, the development of eco-friendly vessel designs and alternative fuel technologies, such as LNG-powered crude carriers, is gaining momentum, indicating a long-term commitment to sustainability. The industry's resilience, demonstrated by its ability to absorb global supply chain disruptions and geopolitical events, underscores its critical importance in the global energy ecosystem. The total fleet capacity is expected to grow from approximately 500 Million DWT in 2019 to an estimated 650 Million DWT by 2033, a testament to sustained investment and demand.
Leading Regions, Countries, or Segments in Crude Oil Carriers Industry
The global Crude Oil Carriers Industry is characterized by distinct regional dominance and segment-specific strengths, crucial for understanding market dynamics and investment opportunities. The Asia-Pacific region stands out as a leading hub, driven by burgeoning economies and their escalating demand for crude oil imports. Countries like China and India, with their massive industrial bases and growing energy needs, are pivotal consumers of crude oil, necessitating extensive shipping infrastructure and capacity.
Within the vessel size segments, the Suezmax and Aframax categories are critical for navigating various trade routes and port limitations, while Very Large Crude Carriers (VLCCs) dominate long-haul transport of crude oil from major production hubs to refining centers. The Medium Range (MR) and Panamax segments serve crucial roles in regional and product-specific transportation. Investment trends in the Asia-Pacific region are heavily skewed towards expanding port infrastructure and fleet modernization to accommodate larger vessels and more efficient cargo handling.
Dominant Segment: Suezmax and Aframax Tankers
- Key Drivers: Strategic positioning for accessing major crude oil production areas and refining centers globally. Their size offers a balance between carrying capacity and navigational flexibility through key chokepoints like the Suez Canal.
- Investment Trends: Continued investment in upgrading existing fleets to meet stricter environmental regulations and enhancing operational efficiency. Increasing demand from emerging economies in Asia fuels sustained chartering activity.
- Regulatory Support: Favorable port access and operational feasibility in numerous key trading lanes.
Leading Region: Asia-Pacific
- Key Drivers: Rapid industrialization, growing middle class, and increasing reliance on imported crude oil for energy security.
- Investment Trends: Significant investments in new port facilities capable of handling larger vessels, alongside substantial orders for new builds to expand fleet capacity. Focus on developing robust domestic refining capabilities, thus increasing crude import volumes.
- Market Dynamics: High charter rates driven by consistent demand from major Asian economies. The region acts as both a major importer and increasingly, a significant player in shipbuilding and ship management.
Emerging Trends in VLCC Dominance:
- Key Drivers: The increasing volume of crude oil moved from the Middle East and Africa to Asia necessitates the use of VLCCs for economies of scale on these long-haul routes.
- Investment Trends: Owners are investing in eco-friendly VLCC designs and scrubber technology to comply with environmental regulations and reduce operational costs.
- Market Dynamics: While historically focused on long-haul trade, there's a growing trend of VLCCs being used for floating storage, especially during periods of market imbalance.
Crude Oil Carriers Industry Product Innovations
The Crude Oil Carriers Industry is witnessing significant product innovations focused on enhancing efficiency, safety, and environmental sustainability. Innovations include advanced hull coatings that reduce drag and improve fuel economy, estimated to reduce fuel consumption by up to 8%. The development of dual-fuel engines, capable of running on both traditional heavy fuel oil and cleaner alternatives like LNG, is a key advancement addressing emissions reduction targets. Furthermore, sophisticated ballast water treatment systems are now standard to prevent the spread of invasive species, a critical environmental safeguard. Predictive maintenance technologies utilizing AI and IoT sensors are revolutionizing vessel upkeep, minimizing downtime and operational risks. These advancements not only improve performance metrics like fuel efficiency and reduced emissions (targeting a 30% reduction by 2030) but also provide unique selling propositions for shipowners seeking to gain a competitive edge in an increasingly regulated and cost-conscious market.
Propelling Factors for Crude Oil Carriers Industry Growth
The growth of the Crude Oil Carriers Industry is propelled by several key factors, ensuring its continued relevance in the global energy supply chain. Primarily, the escalating global demand for crude oil, driven by industrialization and population growth in emerging economies, directly translates to increased transportation needs. Geopolitical stability and trade relations between major oil-producing and consuming nations significantly influence trade flows and, consequently, tanker demand. Furthermore, technological advancements in vessel design and fuel efficiency, such as the adoption of eco-friendly coatings and optimized hull forms, reduce operational costs and enhance competitiveness. The ongoing expansion of refining capacities in import-dependent regions necessitates larger and more frequent crude oil shipments. Finally, the strategic importance of maritime transport for energy security ensures sustained investment in the sector, even amidst market fluctuations.
Obstacles in the Crude Oil Carriers Industry Market
Despite its growth trajectory, the Crude Oil Carriers Industry faces significant obstacles that can impede its progress. Stringent environmental regulations, particularly those concerning emissions and ballast water discharge, necessitate substantial capital expenditure for fleet upgrades and compliance, estimated to cost billions annually. Volatility in crude oil prices and demand fluctuations can lead to periods of oversupply of tonnage and depressed charter rates, impacting profitability. Geopolitical tensions and trade disputes can disrupt established trade routes and create uncertainty in cargo flows. Supply chain disruptions, exacerbated by events like pandemics or port congestion, can lead to operational inefficiencies and increased costs. Furthermore, increasing competition from alternative transportation methods, such as pipelines and rail, in certain regions poses a continuous challenge, especially for shorter haul routes.
Future Opportunities in Crude Oil Carriers Industry
The Crude Oil Carriers Industry is ripe with future opportunities, driven by evolving market dynamics and technological innovation. The growing energy demand from developing economies, particularly in Asia and Africa, presents a substantial opportunity for increased crude oil transportation. The transition towards cleaner energy sources and fuels also creates opportunities for specialized vessels and the retrofitting of existing fleets to accommodate new fuel types like LNG and potentially ammonia or methanol. Digitalization and automation offer pathways to enhance operational efficiency, improve safety, and reduce costs, creating a competitive advantage for early adopters. The development of new trade routes and exploration of untapped oil reserves will also necessitate specialized shipping solutions. Furthermore, the potential for increased demand for floating storage solutions during periods of market volatility represents another avenue for growth.
Major Players in the Crude Oil Carriers Industry Ecosystem
- National Iranian Oil Company (NIOC)
- Minerva Marine Inc
- Teekay Corporation
- China Cosco Shipping Corporation Limited
- Tsakos Energy N/SH
- China Merchants Group Ltd
- Euronav NV
- Petroliam Nasional Berhad (PETRONAS)
- The National Shipping Co Saudi Arabia
- Angelicoussis Shipping Group Ltd
Key Developments in Crude Oil Carriers Industry Industry
- 2023 Q4: Increased investment in scrubber installations across VLCC fleets to meet IMO 2020 compliance and reduce sulfur emissions.
- 2024 Q1: Launch of new eco-friendly Aframax tankers with enhanced fuel efficiency, designed to meet future emissions standards.
- 2024 Q2: Major consolidation through the merger of two significant tanker operators, creating a larger entity with enhanced market share.
- 2024 Q3: Introduction of advanced predictive maintenance systems on key vessels, significantly reducing unplanned downtime and maintenance costs.
- 2024 Q4: Growing interest and pilot programs for LNG-powered crude oil carriers, signaling a shift towards alternative fuels.
Strategic Crude Oil Carriers Industry Market Forecast
The strategic Crude Oil Carriers Industry forecast indicates a period of sustained growth driven by robust global energy demand, particularly from emerging economies in Asia and Africa. Technological advancements, including the widespread adoption of dual-fuel engines and digital optimization tools, will be key to enhancing operational efficiency and meeting stringent environmental mandates. Expected fleet expansion and modernization, coupled with strategic M&A activities to consolidate market presence, will shape the competitive landscape. The industry is poised to benefit from investments in new trade routes and the ongoing development of alternative energy sources, further solidifying its crucial role in global energy security and economic stability.
Crude Oil Carriers Industry Segmentation
-
1. Size
- 1.1. Medium Range
- 1.2. Panaxax
- 1.3. Aframax
- 1.4. Suezmax
- 1.5. Very Lar
Crude Oil Carriers Industry Segmentation By Geography
- 1. North America
- 2. Europe
- 3. Asia Pacific
- 4. South America
- 5. Middle East
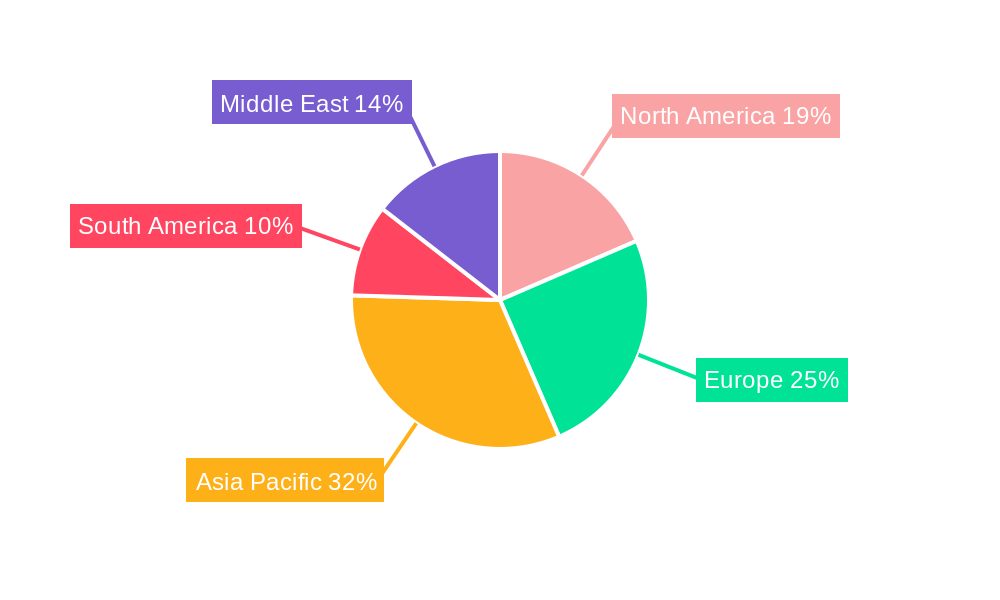
Crude Oil Carriers Industry Regional Market Share
Geographic Coverage of Crude Oil Carriers Industry
Crude Oil Carriers Industry REPORT HIGHLIGHTS
| Aspects | Details |
|---|---|
| Study Period | 2020-2034 |
| Base Year | 2025 |
| Estimated Year | 2026 |
| Forecast Period | 2026-2034 |
| Historical Period | 2020-2025 |
| Growth Rate | CAGR of 4.6% from 2020-2034 |
| Segmentation |
|
Table of Contents
- 1. Introduction
- 1.1. Research Scope
- 1.2. Market Segmentation
- 1.3. Research Objective
- 1.4. Definitions and Assumptions
- 2. Executive Summary
- 2.1. Market Snapshot
- 3. Market Dynamics
- 3.1. Market Drivers
- 3.2. Market Restrains
- 3.3. Market Trends
- 3.4. Market Opportunities
- 4. Market Factor Analysis
- 4.1. Porters Five Forces
- 4.1.1. Bargaining Power of Suppliers
- 4.1.2. Bargaining Power of Buyers
- 4.1.3. Threat of New Entrants
- 4.1.4. Threat of Substitutes
- 4.1.5. Competitive Rivalry
- 4.2. PESTEL analysis
- 4.3. BCG Analysis
- 4.3.1. Stars (High Growth, High Market Share)
- 4.3.2. Cash Cows (Low Growth, High Market Share)
- 4.3.3. Question Mark (High Growth, Low Market Share)
- 4.3.4. Dogs (Low Growth, Low Market Share)
- 4.4. Ansoff Matrix Analysis
- 4.5. Supply Chain Analysis
- 4.6. Regulatory Landscape
- 4.7. Current Market Potential and Opportunity Assessment (TAM–SAM–SOM Framework)
- 4.8. DMV Analyst Note
- 4.1. Porters Five Forces
- 5. Market Analysis, Insights and Forecast 2021-2033
- 5.1. Market Analysis, Insights and Forecast - by Size
- 5.1.1. Medium Range
- 5.1.2. Panaxax
- 5.1.3. Aframax
- 5.1.4. Suezmax
- 5.1.5. Very Lar
- 5.2. Market Analysis, Insights and Forecast - by Region
- 5.2.1. North America
- 5.2.2. Europe
- 5.2.3. Asia Pacific
- 5.2.4. South America
- 5.2.5. Middle East
- 5.1. Market Analysis, Insights and Forecast - by Size
- 6. Global Crude Oil Carriers Industry Analysis, Insights and Forecast, 2021-2033
- 6.1. Market Analysis, Insights and Forecast - by Size
- 6.1.1. Medium Range
- 6.1.2. Panaxax
- 6.1.3. Aframax
- 6.1.4. Suezmax
- 6.1.5. Very Lar
- 6.1. Market Analysis, Insights and Forecast - by Size
- 7. North America Crude Oil Carriers Industry Analysis, Insights and Forecast, 2020-2032
- 7.1. Market Analysis, Insights and Forecast - by Size
- 7.1.1. Medium Range
- 7.1.2. Panaxax
- 7.1.3. Aframax
- 7.1.4. Suezmax
- 7.1.5. Very Lar
- 7.1. Market Analysis, Insights and Forecast - by Size
- 8. Europe Crude Oil Carriers Industry Analysis, Insights and Forecast, 2020-2032
- 8.1. Market Analysis, Insights and Forecast - by Size
- 8.1.1. Medium Range
- 8.1.2. Panaxax
- 8.1.3. Aframax
- 8.1.4. Suezmax
- 8.1.5. Very Lar
- 8.1. Market Analysis, Insights and Forecast - by Size
- 9. Asia Pacific Crude Oil Carriers Industry Analysis, Insights and Forecast, 2020-2032
- 9.1. Market Analysis, Insights and Forecast - by Size
- 9.1.1. Medium Range
- 9.1.2. Panaxax
- 9.1.3. Aframax
- 9.1.4. Suezmax
- 9.1.5. Very Lar
- 9.1. Market Analysis, Insights and Forecast - by Size
- 10. South America Crude Oil Carriers Industry Analysis, Insights and Forecast, 2020-2032
- 10.1. Market Analysis, Insights and Forecast - by Size
- 10.1.1. Medium Range
- 10.1.2. Panaxax
- 10.1.3. Aframax
- 10.1.4. Suezmax
- 10.1.5. Very Lar
- 10.1. Market Analysis, Insights and Forecast - by Size
- 11. Middle East Crude Oil Carriers Industry Analysis, Insights and Forecast, 2020-2032
- 11.1. Market Analysis, Insights and Forecast - by Size
- 11.1.1. Medium Range
- 11.1.2. Panaxax
- 11.1.3. Aframax
- 11.1.4. Suezmax
- 11.1.5. Very Lar
- 11.1. Market Analysis, Insights and Forecast - by Size
- 12. Competitive Analysis
- 12.1. Company Profiles
- 12.1.1 National Iranian Oil Company (NIOC)
- 12.1.1.1. Company Overview
- 12.1.1.2. Products
- 12.1.1.3. Company Financials
- 12.1.1.4. SWOT Analysis
- 12.1.2 Minerva Marine Inc
- 12.1.2.1. Company Overview
- 12.1.2.2. Products
- 12.1.2.3. Company Financials
- 12.1.2.4. SWOT Analysis
- 12.1.3 Teekay Corporation
- 12.1.3.1. Company Overview
- 12.1.3.2. Products
- 12.1.3.3. Company Financials
- 12.1.3.4. SWOT Analysis
- 12.1.4 China Cosco Shipping Corporation Limited
- 12.1.4.1. Company Overview
- 12.1.4.2. Products
- 12.1.4.3. Company Financials
- 12.1.4.4. SWOT Analysis
- 12.1.5 Tsakos Energy N/SH
- 12.1.5.1. Company Overview
- 12.1.5.2. Products
- 12.1.5.3. Company Financials
- 12.1.5.4. SWOT Analysis
- 12.1.6 China Merchants Group Ltd
- 12.1.6.1. Company Overview
- 12.1.6.2. Products
- 12.1.6.3. Company Financials
- 12.1.6.4. SWOT Analysis
- 12.1.7 Euronav NV
- 12.1.7.1. Company Overview
- 12.1.7.2. Products
- 12.1.7.3. Company Financials
- 12.1.7.4. SWOT Analysis
- 12.1.8 Petroliam Nasional Berhad (PETRONAS)*List Not Exhaustive
- 12.1.8.1. Company Overview
- 12.1.8.2. Products
- 12.1.8.3. Company Financials
- 12.1.8.4. SWOT Analysis
- 12.1.9 The National Shipping Co Saudi Arabia
- 12.1.9.1. Company Overview
- 12.1.9.2. Products
- 12.1.9.3. Company Financials
- 12.1.9.4. SWOT Analysis
- 12.1.10 Angelicoussis Shipping Group Ltd
- 12.1.10.1. Company Overview
- 12.1.10.2. Products
- 12.1.10.3. Company Financials
- 12.1.10.4. SWOT Analysis
- 12.1.1 National Iranian Oil Company (NIOC)
- 12.2. Market Entropy
- 12.2.1 Company's Key Areas Served
- 12.2.2 Recent Developments
- 12.3. Company Market Share Analysis 2025
- 12.3.1 Top 5 Companies Market Share Analysis
- 12.3.2 Top 3 Companies Market Share Analysis
- 12.4. List of Potential Customers
- 13. Research Methodology
List of Figures
- Figure 1: Global Crude Oil Carriers Industry Revenue Breakdown (million, %) by Region 2025 & 2033
- Figure 2: Global Crude Oil Carriers Industry Volume Breakdown (metric tonnes, %) by Region 2025 & 2033
- Figure 3: North America Crude Oil Carriers Industry Revenue (million), by Size 2025 & 2033
- Figure 4: North America Crude Oil Carriers Industry Volume (metric tonnes), by Size 2025 & 2033
- Figure 5: North America Crude Oil Carriers Industry Revenue Share (%), by Size 2025 & 2033
- Figure 6: North America Crude Oil Carriers Industry Volume Share (%), by Size 2025 & 2033
- Figure 7: North America Crude Oil Carriers Industry Revenue (million), by Country 2025 & 2033
- Figure 8: North America Crude Oil Carriers Industry Volume (metric tonnes), by Country 2025 & 2033
- Figure 9: North America Crude Oil Carriers Industry Revenue Share (%), by Country 2025 & 2033
- Figure 10: North America Crude Oil Carriers Industry Volume Share (%), by Country 2025 & 2033
- Figure 11: Europe Crude Oil Carriers Industry Revenue (million), by Size 2025 & 2033
- Figure 12: Europe Crude Oil Carriers Industry Volume (metric tonnes), by Size 2025 & 2033
- Figure 13: Europe Crude Oil Carriers Industry Revenue Share (%), by Size 2025 & 2033
- Figure 14: Europe Crude Oil Carriers Industry Volume Share (%), by Size 2025 & 2033
- Figure 15: Europe Crude Oil Carriers Industry Revenue (million), by Country 2025 & 2033
- Figure 16: Europe Crude Oil Carriers Industry Volume (metric tonnes), by Country 2025 & 2033
- Figure 17: Europe Crude Oil Carriers Industry Revenue Share (%), by Country 2025 & 2033
- Figure 18: Europe Crude Oil Carriers Industry Volume Share (%), by Country 2025 & 2033
- Figure 19: Asia Pacific Crude Oil Carriers Industry Revenue (million), by Size 2025 & 2033
- Figure 20: Asia Pacific Crude Oil Carriers Industry Volume (metric tonnes), by Size 2025 & 2033
- Figure 21: Asia Pacific Crude Oil Carriers Industry Revenue Share (%), by Size 2025 & 2033
- Figure 22: Asia Pacific Crude Oil Carriers Industry Volume Share (%), by Size 2025 & 2033
- Figure 23: Asia Pacific Crude Oil Carriers Industry Revenue (million), by Country 2025 & 2033
- Figure 24: Asia Pacific Crude Oil Carriers Industry Volume (metric tonnes), by Country 2025 & 2033
- Figure 25: Asia Pacific Crude Oil Carriers Industry Revenue Share (%), by Country 2025 & 2033
- Figure 26: Asia Pacific Crude Oil Carriers Industry Volume Share (%), by Country 2025 & 2033
- Figure 27: South America Crude Oil Carriers Industry Revenue (million), by Size 2025 & 2033
- Figure 28: South America Crude Oil Carriers Industry Volume (metric tonnes), by Size 2025 & 2033
- Figure 29: South America Crude Oil Carriers Industry Revenue Share (%), by Size 2025 & 2033
- Figure 30: South America Crude Oil Carriers Industry Volume Share (%), by Size 2025 & 2033
- Figure 31: South America Crude Oil Carriers Industry Revenue (million), by Country 2025 & 2033
- Figure 32: South America Crude Oil Carriers Industry Volume (metric tonnes), by Country 2025 & 2033
- Figure 33: South America Crude Oil Carriers Industry Revenue Share (%), by Country 2025 & 2033
- Figure 34: South America Crude Oil Carriers Industry Volume Share (%), by Country 2025 & 2033
- Figure 35: Middle East Crude Oil Carriers Industry Revenue (million), by Size 2025 & 2033
- Figure 36: Middle East Crude Oil Carriers Industry Volume (metric tonnes), by Size 2025 & 2033
- Figure 37: Middle East Crude Oil Carriers Industry Revenue Share (%), by Size 2025 & 2033
- Figure 38: Middle East Crude Oil Carriers Industry Volume Share (%), by Size 2025 & 2033
- Figure 39: Middle East Crude Oil Carriers Industry Revenue (million), by Country 2025 & 2033
- Figure 40: Middle East Crude Oil Carriers Industry Volume (metric tonnes), by Country 2025 & 2033
- Figure 41: Middle East Crude Oil Carriers Industry Revenue Share (%), by Country 2025 & 2033
- Figure 42: Middle East Crude Oil Carriers Industry Volume Share (%), by Country 2025 & 2033
List of Tables
- Table 1: Global Crude Oil Carriers Industry Revenue million Forecast, by Size 2020 & 2033
- Table 2: Global Crude Oil Carriers Industry Volume metric tonnes Forecast, by Size 2020 & 2033
- Table 3: Global Crude Oil Carriers Industry Revenue million Forecast, by Region 2020 & 2033
- Table 4: Global Crude Oil Carriers Industry Volume metric tonnes Forecast, by Region 2020 & 2033
- Table 5: Global Crude Oil Carriers Industry Revenue million Forecast, by Size 2020 & 2033
- Table 6: Global Crude Oil Carriers Industry Volume metric tonnes Forecast, by Size 2020 & 2033
- Table 7: Global Crude Oil Carriers Industry Revenue million Forecast, by Country 2020 & 2033
- Table 8: Global Crude Oil Carriers Industry Volume metric tonnes Forecast, by Country 2020 & 2033
- Table 9: Global Crude Oil Carriers Industry Revenue million Forecast, by Size 2020 & 2033
- Table 10: Global Crude Oil Carriers Industry Volume metric tonnes Forecast, by Size 2020 & 2033
- Table 11: Global Crude Oil Carriers Industry Revenue million Forecast, by Country 2020 & 2033
- Table 12: Global Crude Oil Carriers Industry Volume metric tonnes Forecast, by Country 2020 & 2033
- Table 13: Global Crude Oil Carriers Industry Revenue million Forecast, by Size 2020 & 2033
- Table 14: Global Crude Oil Carriers Industry Volume metric tonnes Forecast, by Size 2020 & 2033
- Table 15: Global Crude Oil Carriers Industry Revenue million Forecast, by Country 2020 & 2033
- Table 16: Global Crude Oil Carriers Industry Volume metric tonnes Forecast, by Country 2020 & 2033
- Table 17: Global Crude Oil Carriers Industry Revenue million Forecast, by Size 2020 & 2033
- Table 18: Global Crude Oil Carriers Industry Volume metric tonnes Forecast, by Size 2020 & 2033
- Table 19: Global Crude Oil Carriers Industry Revenue million Forecast, by Country 2020 & 2033
- Table 20: Global Crude Oil Carriers Industry Volume metric tonnes Forecast, by Country 2020 & 2033
- Table 21: Global Crude Oil Carriers Industry Revenue million Forecast, by Size 2020 & 2033
- Table 22: Global Crude Oil Carriers Industry Volume metric tonnes Forecast, by Size 2020 & 2033
- Table 23: Global Crude Oil Carriers Industry Revenue million Forecast, by Country 2020 & 2033
- Table 24: Global Crude Oil Carriers Industry Volume metric tonnes Forecast, by Country 2020 & 2033
Frequently Asked Questions
1. What is the projected Compound Annual Growth Rate (CAGR) of the Crude Oil Carriers Industry?
The projected CAGR is approximately 4.6%.
2. Which companies are prominent players in the Crude Oil Carriers Industry?
Key companies in the market include National Iranian Oil Company (NIOC), Minerva Marine Inc, Teekay Corporation, China Cosco Shipping Corporation Limited, Tsakos Energy N/SH, China Merchants Group Ltd, Euronav NV, Petroliam Nasional Berhad (PETRONAS)*List Not Exhaustive, The National Shipping Co Saudi Arabia, Angelicoussis Shipping Group Ltd.
3. What are the main segments of the Crude Oil Carriers Industry?
The market segments include Size.
4. Can you provide details about the market size?
The market size is estimated to be USD 225142.8 million as of 2022.
5. What are some drivers contributing to market growth?
Increasing Electricity Demand; Rising Investments in the Coal Industry.
6. What are the notable trends driving market growth?
Very Large Crude Carrier to Dominate the Market.
7. Are there any restraints impacting market growth?
Increasing Installation of Renewable Energy Sources.
8. Can you provide examples of recent developments in the market?
N/A
9. What pricing options are available for accessing the report?
Pricing options include single-user, multi-user, and enterprise licenses priced at USD 4750, USD 5250, and USD 8750 respectively.
10. Is the market size provided in terms of value or volume?
The market size is provided in terms of value, measured in million and volume, measured in metric tonnes.
11. Are there any specific market keywords associated with the report?
Yes, the market keyword associated with the report is "Crude Oil Carriers Industry," which aids in identifying and referencing the specific market segment covered.
12. How do I determine which pricing option suits my needs best?
The pricing options vary based on user requirements and access needs. Individual users may opt for single-user licenses, while businesses requiring broader access may choose multi-user or enterprise licenses for cost-effective access to the report.
13. Are there any additional resources or data provided in the Crude Oil Carriers Industry report?
While the report offers comprehensive insights, it's advisable to review the specific contents or supplementary materials provided to ascertain if additional resources or data are available.
14. How can I stay updated on further developments or reports in the Crude Oil Carriers Industry?
To stay informed about further developments, trends, and reports in the Crude Oil Carriers Industry, consider subscribing to industry newsletters, following relevant companies and organizations, or regularly checking reputable industry news sources and publications.
Methodology
Step 1 - Identification of Relevant Samples Size from Population Database


Step 2 - Approaches for Defining Global Market Size (Value, Volume* & Price*)

Note*: In applicable scenarios
Step 3 - Data Sources
Primary Research
- Web Analytics
- Survey Reports
- Research Institute
- Latest Research Reports
- Opinion Leaders
Secondary Research
- Annual Reports
- White Paper
- Latest Press Release
- Industry Association
- Paid Database
- Investor Presentations

Step 4 - Data Triangulation
Involves using different sources of information in order to increase the validity of a study
These sources are likely to be stakeholders in a program - participants, other researchers, program staff, other community members, and so on.
Then we put all data in single framework & apply various statistical tools to find out the dynamic on the market.
During the analysis stage, feedback from the stakeholder groups would be compared to determine areas of agreement as well as areas of divergence