

Key Insights
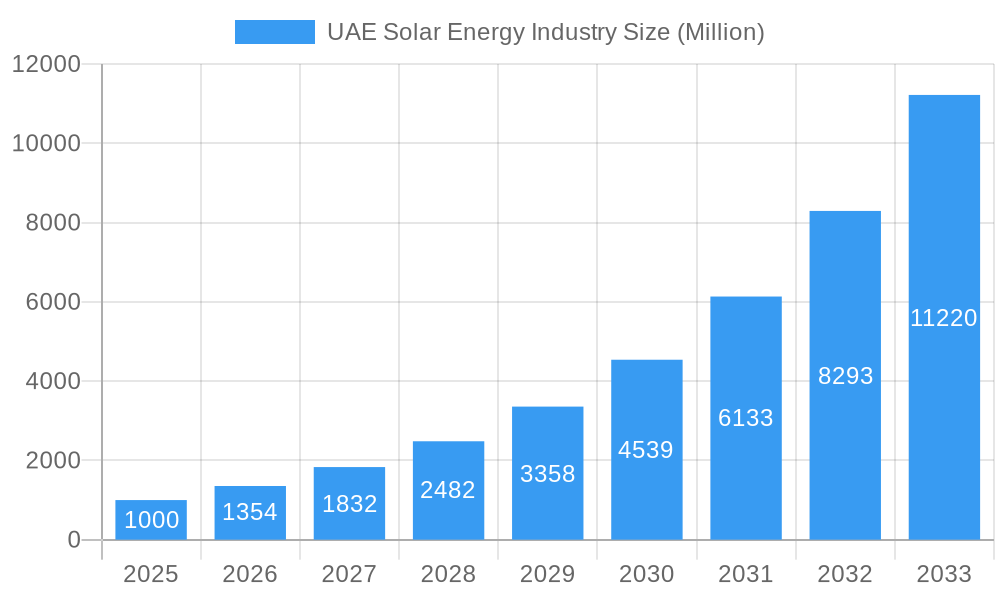
The UAE solar energy market, valued at $10.3 billion in 2025, is experiencing robust expansion. Projections indicate a significant market size by 2033, driven by a remarkable Compound Annual Growth Rate (CAGR) of 22.33%. This growth is fueled by the UAE's ambitious sustainability targets, abundant solar resources, and strong government backing through supportive policies and substantial renewable energy investments. Advancements in photovoltaic (PV) and Concentrated Solar Power (CSP) technologies, resulting in enhanced efficiency and cost reduction, further accelerate market momentum. The market is segmented by deployment, including utility-scale projects, commercial and industrial installations, and residential applications. While utility-scale projects currently lead, residential and commercial segments are anticipated to grow rapidly due to declining installation costs and rising environmental awareness.
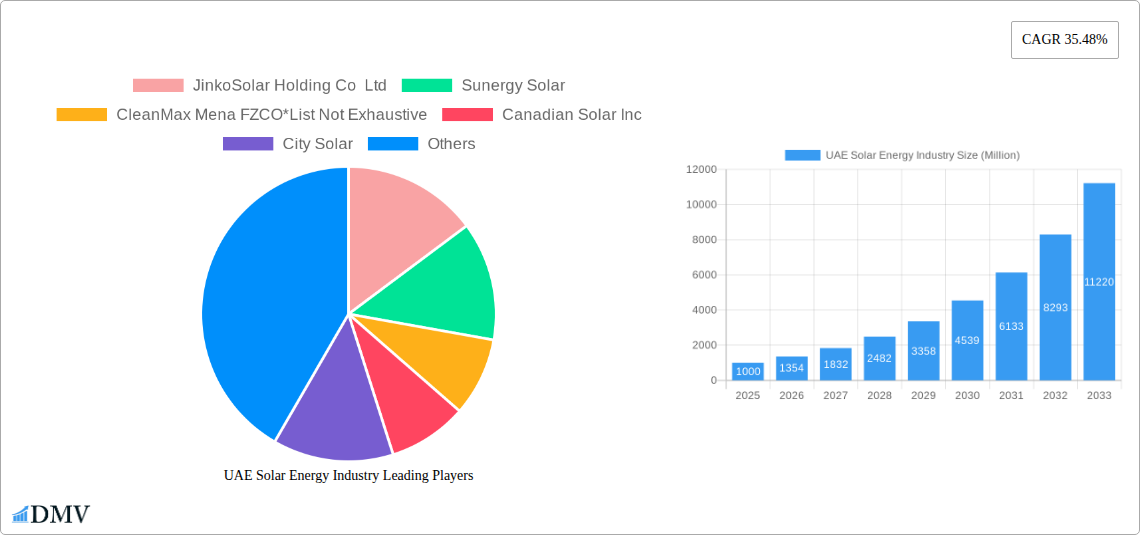
UAE Solar Energy Industry Market Size (In Billion)
Key challenges influencing market growth include land availability for large-scale projects, grid infrastructure constraints, and volatile raw material prices. However, ongoing investments in grid modernization and continuous solar technology improvements are expected to address these obstacles. Leading market participants include JinkoSolar Holding Co Ltd, Sunergy Solar, CleanMax Mena FZCO, Canadian Solar Inc, City Solar, Masdar, MAYSUN SOLAR FZCO, Enerwhere, and ACWA Power, contributing to a dynamic competitive environment and fostering innovation. The UAE's commitment to energy mix diversification and achieving net-zero emissions will ensure the sustained growth of its solar energy sector.
UAE Solar Energy Industry Company Market Share
UAE Solar Energy Industry: Market Analysis & Forecast 2019-2033
This comprehensive report provides an in-depth analysis of the UAE solar energy industry, encompassing market trends, technological advancements, key players, and future growth projections. The study period covers 2019-2033, with 2025 as the base and estimated year, and a forecast period of 2025-2033. This report is essential for stakeholders including investors, industry players, and policymakers seeking to understand and capitalize on the burgeoning opportunities within this dynamic sector.
UAE Solar Energy Industry Market Composition & Trends
This section analyzes the UAE solar energy market's competitive landscape, highlighting key trends influencing its evolution. We delve into market concentration, analyzing the distribution of market share amongst major players like JinkoSolar Holding Co Ltd, Sunergy Solar, CleanMax Mena FZCO, Canadian Solar Inc, City Solar, Masdar (Abu Dhabi Future Energy Company), MAYSUN SOLAR FZCO, Enerwhere, and ACWA Power (list not exhaustive). We examine innovation drivers, including technological breakthroughs in photovoltaic (PV) and Concentrated Solar Power (CSP) technologies. The regulatory landscape, including government incentives and policies supporting solar energy adoption, is meticulously explored. We also assess the impact of substitute products and analyze end-user profiles across utility, commercial & industrial, and residential segments. Furthermore, the report scrutinizes mergers and acquisitions (M&A) activity, including deal values and their impact on market consolidation. The report estimates a xx Million USD market value for 2025 with a projected xx% CAGR for the forecast period, driven by substantial investments in renewable energy infrastructure.
- Market Share Distribution (2025): Masdar holds an estimated xx% market share, followed by ACWA Power at xx%, and JinkoSolar at xx%. The remaining share is distributed among other players.
- M&A Activity (2019-2024): A total of xx M&A deals were recorded, with a cumulative value of approximately xx Million USD.
UAE Solar Energy Industry Industry Evolution
This section charts the growth trajectory of the UAE solar energy industry from 2019 to 2033, detailing the technological advancements and evolving consumer preferences that are shaping its expansion. We examine the historical period (2019-2024), demonstrating a Compound Annual Growth Rate (CAGR) of xx%, driven by factors such as increasing energy demand, supportive government policies, and decreasing solar technology costs. The report projects a CAGR of xx% during the forecast period (2025-2033), fueled by the UAE's ambitious renewable energy targets and ongoing investments in large-scale solar projects. Technological progress, particularly in PV efficiency and CSP technology, is analyzed, along with shifting consumer demands toward sustainable energy solutions. This section will delve into the specific growth rates for each segment (Utility, Commercial & Industrial, Residential), demonstrating their individual contributions to the overall market expansion. Adoption metrics, such as the installed capacity of solar power in MW, will be presented to provide a clear picture of market penetration.
Leading Regions, Countries, or Segments in UAE Solar Energy Industry
The UAE's solar energy industry is predominantly driven by the utility-scale segment, followed by the commercial and industrial sectors. This section identifies the leading regions, countries, and segments within the UAE solar energy market, supported by an in-depth analysis of the drivers behind their dominance. Abu Dhabi and Dubai emerge as the leading regions due to significant government investments and supportive policies.
Key Drivers for Utility Segment Dominance:
- High government investment in large-scale solar power projects (e.g., Al Dhafra PV2).
- Favorable regulatory framework, including feed-in tariffs and power purchase agreements (PPAs).
- Economies of scale, leading to lower costs per MW of installed capacity.
Key Drivers for Commercial & Industrial Segment Growth:
- Rising energy costs and the desire to reduce operational expenses.
- Government incentives and tax benefits for businesses adopting solar energy.
- Growing awareness of environmental sustainability amongst corporations.
Residential Segment: While still a smaller segment compared to utility and C&I, the residential segment exhibits growth potential driven by decreasing solar system costs and increasing consumer awareness.
(Further detailed analysis on dominance factors will be provided within the full report.)
UAE Solar Energy Industry Product Innovations
The UAE solar energy industry is witnessing significant product innovations, particularly in PV technology. Higher efficiency solar panels, improved energy storage solutions, and smart grid integration technologies are enhancing the performance and reliability of solar power systems. These innovations are resulting in reduced levelized cost of energy (LCOE), making solar power increasingly competitive with traditional energy sources. Unique selling propositions include enhanced durability, improved aesthetics, and advanced monitoring capabilities.
Propelling Factors for UAE Solar Energy Industry Growth
The growth of the UAE's solar energy industry is propelled by a confluence of technological, economic, and regulatory factors. Technological advancements, such as increased PV efficiency and improved energy storage solutions, are making solar power more affordable and reliable. Economically, the decreasing cost of solar technology and the rising cost of fossil fuels are making solar energy an increasingly attractive alternative. Government policies, including ambitious renewable energy targets and supportive regulatory frameworks, further incentivize solar energy adoption. The UAE's strategic location and abundant sunlight provide a favorable environment for solar power generation.
Obstacles in the UAE Solar Energy Industry Market
Despite significant growth potential, the UAE solar energy market faces several challenges. These include intermittent solar power generation, requiring robust energy storage solutions. Land availability for large-scale solar projects can be a constraint, especially in densely populated areas. Supply chain disruptions, particularly for solar components, can impact project timelines and costs. Furthermore, intense competition among solar energy providers can pressure margins. These factors can potentially impact the expected market growth rate by xx% in the forecast period.
Future Opportunities in UAE Solar Energy Industry
Future opportunities for the UAE's solar energy industry include expansion into emerging sectors, like solar-powered desalination and agrivoltaics. The integration of solar energy with smart grid technologies offers significant potential for optimizing energy distribution and minimizing energy waste. Further advancements in energy storage technologies, including batteries and pumped hydro storage, will enhance the reliability and stability of solar power systems. Exploring innovative financing models and partnerships can unlock further investment in solar energy projects.
Major Players in the UAE Solar Energy Industry Ecosystem
- JinkoSolar Holding Co Ltd
- Sunergy Solar
- CleanMax Mena FZCO
- Canadian Solar Inc
- City Solar
- Masdar (Abu Dhabi Future Energy Company)
- MAYSUN SOLAR FZCO
- Enerwhere
- ACWA Power
Key Developments in UAE Solar Energy Industry Industry
- May 2023: ADNOC Distribution partnered with Emerge (EDF and Masdar JV) to develop on-site solar power across its service station network in Dubai. This signifies a move towards decentralized solar energy generation and enhances ADNOC's sustainability profile.
- January 2023: Suntech's delivery of 680MW solar modules for the Al Dhafra PV2 Solar Power Plant represents a significant milestone in the construction of the world's largest single-site solar power plant, boosting the UAE's renewable energy capacity.
Strategic UAE Solar Energy Industry Market Forecast
The UAE solar energy market is poised for sustained growth, driven by government support, technological advancements, and increasing energy demand. The forecast period (2025-2033) anticipates a significant expansion in installed solar capacity, with a projected CAGR of xx%. Continued investment in large-scale solar projects, coupled with growing adoption in the commercial and industrial sectors, will contribute to this growth. The UAE's commitment to diversifying its energy mix and achieving its renewable energy targets presents significant opportunities for investors and industry players. The market is anticipated to reach xx Million USD by 2033.
UAE Solar Energy Industry Segmentation
-
1. Technology
- 1.1. Photovoltaic
- 1.2. Concentrated Solar Power (CSP)
-
2. Deployment
- 2.1. Utility
- 2.2. Commercial and Industrial
- 2.3. Residential
UAE Solar Energy Industry Segmentation By Geography
-
1. North America
- 1.1. United States
- 1.2. Canada
- 1.3. Mexico
-
2. South America
- 2.1. Brazil
- 2.2. Argentina
- 2.3. Rest of South America
-
3. Europe
- 3.1. United Kingdom
- 3.2. Germany
- 3.3. France
- 3.4. Italy
- 3.5. Spain
- 3.6. Russia
- 3.7. Benelux
- 3.8. Nordics
- 3.9. Rest of Europe
-
4. Middle East & Africa
- 4.1. Turkey
- 4.2. Israel
- 4.3. GCC
- 4.4. North Africa
- 4.5. South Africa
- 4.6. Rest of Middle East & Africa
-
5. Asia Pacific
- 5.1. China
- 5.2. India
- 5.3. Japan
- 5.4. South Korea
- 5.5. ASEAN
- 5.6. Oceania
- 5.7. Rest of Asia Pacific
UAE Solar Energy Industry Regional Market Share
Geographic Coverage of UAE Solar Energy Industry
UAE Solar Energy Industry REPORT HIGHLIGHTS
| Aspects | Details |
|---|---|
| Study Period | 2020-2034 |
| Base Year | 2025 |
| Estimated Year | 2026 |
| Forecast Period | 2026-2034 |
| Historical Period | 2020-2025 |
| Growth Rate | CAGR of 22.33% from 2020-2034 |
| Segmentation |
|
Table of Contents
- 1. Introduction
- 1.1. Research Scope
- 1.2. Market Segmentation
- 1.3. Research Objective
- 1.4. Definitions and Assumptions
- 2. Executive Summary
- 2.1. Market Snapshot
- 3. Market Dynamics
- 3.1. Market Drivers
- 3.2. Market Restrains
- 3.3. Market Trends
- 3.4. Market Opportunities
- 4. Market Factor Analysis
- 4.1. Porters Five Forces
- 4.1.1. Bargaining Power of Suppliers
- 4.1.2. Bargaining Power of Buyers
- 4.1.3. Threat of New Entrants
- 4.1.4. Threat of Substitutes
- 4.1.5. Competitive Rivalry
- 4.2. PESTEL analysis
- 4.3. BCG Analysis
- 4.3.1. Stars (High Growth, High Market Share)
- 4.3.2. Cash Cows (Low Growth, High Market Share)
- 4.3.3. Question Mark (High Growth, Low Market Share)
- 4.3.4. Dogs (Low Growth, Low Market Share)
- 4.4. Ansoff Matrix Analysis
- 4.5. Supply Chain Analysis
- 4.6. Regulatory Landscape
- 4.7. Current Market Potential and Opportunity Assessment (TAM–SAM–SOM Framework)
- 4.8. DMV Analyst Note
- 4.1. Porters Five Forces
- 5. Market Analysis, Insights and Forecast 2021-2033
- 5.1. Market Analysis, Insights and Forecast - by Technology
- 5.1.1. Photovoltaic
- 5.1.2. Concentrated Solar Power (CSP)
- 5.2. Market Analysis, Insights and Forecast - by Deployment
- 5.2.1. Utility
- 5.2.2. Commercial and Industrial
- 5.2.3. Residential
- 5.3. Market Analysis, Insights and Forecast - by Region
- 5.3.1. North America
- 5.3.2. South America
- 5.3.3. Europe
- 5.3.4. Middle East & Africa
- 5.3.5. Asia Pacific
- 5.1. Market Analysis, Insights and Forecast - by Technology
- 6. Global UAE Solar Energy Industry Analysis, Insights and Forecast, 2021-2033
- 6.1. Market Analysis, Insights and Forecast - by Technology
- 6.1.1. Photovoltaic
- 6.1.2. Concentrated Solar Power (CSP)
- 6.2. Market Analysis, Insights and Forecast - by Deployment
- 6.2.1. Utility
- 6.2.2. Commercial and Industrial
- 6.2.3. Residential
- 6.1. Market Analysis, Insights and Forecast - by Technology
- 7. North America UAE Solar Energy Industry Analysis, Insights and Forecast, 2020-2032
- 7.1. Market Analysis, Insights and Forecast - by Technology
- 7.1.1. Photovoltaic
- 7.1.2. Concentrated Solar Power (CSP)
- 7.2. Market Analysis, Insights and Forecast - by Deployment
- 7.2.1. Utility
- 7.2.2. Commercial and Industrial
- 7.2.3. Residential
- 7.1. Market Analysis, Insights and Forecast - by Technology
- 8. South America UAE Solar Energy Industry Analysis, Insights and Forecast, 2020-2032
- 8.1. Market Analysis, Insights and Forecast - by Technology
- 8.1.1. Photovoltaic
- 8.1.2. Concentrated Solar Power (CSP)
- 8.2. Market Analysis, Insights and Forecast - by Deployment
- 8.2.1. Utility
- 8.2.2. Commercial and Industrial
- 8.2.3. Residential
- 8.1. Market Analysis, Insights and Forecast - by Technology
- 9. Europe UAE Solar Energy Industry Analysis, Insights and Forecast, 2020-2032
- 9.1. Market Analysis, Insights and Forecast - by Technology
- 9.1.1. Photovoltaic
- 9.1.2. Concentrated Solar Power (CSP)
- 9.2. Market Analysis, Insights and Forecast - by Deployment
- 9.2.1. Utility
- 9.2.2. Commercial and Industrial
- 9.2.3. Residential
- 9.1. Market Analysis, Insights and Forecast - by Technology
- 10. Middle East & Africa UAE Solar Energy Industry Analysis, Insights and Forecast, 2020-2032
- 10.1. Market Analysis, Insights and Forecast - by Technology
- 10.1.1. Photovoltaic
- 10.1.2. Concentrated Solar Power (CSP)
- 10.2. Market Analysis, Insights and Forecast - by Deployment
- 10.2.1. Utility
- 10.2.2. Commercial and Industrial
- 10.2.3. Residential
- 10.1. Market Analysis, Insights and Forecast - by Technology
- 11. Asia Pacific UAE Solar Energy Industry Analysis, Insights and Forecast, 2020-2032
- 11.1. Market Analysis, Insights and Forecast - by Technology
- 11.1.1. Photovoltaic
- 11.1.2. Concentrated Solar Power (CSP)
- 11.2. Market Analysis, Insights and Forecast - by Deployment
- 11.2.1. Utility
- 11.2.2. Commercial and Industrial
- 11.2.3. Residential
- 11.1. Market Analysis, Insights and Forecast - by Technology
- 12. Competitive Analysis
- 12.1. Company Profiles
- 12.1.1 JinkoSolar Holding Co Ltd
- 12.1.1.1. Company Overview
- 12.1.1.2. Products
- 12.1.1.3. Company Financials
- 12.1.1.4. SWOT Analysis
- 12.1.2 Sunergy Solar
- 12.1.2.1. Company Overview
- 12.1.2.2. Products
- 12.1.2.3. Company Financials
- 12.1.2.4. SWOT Analysis
- 12.1.3 CleanMax Mena FZCO*List Not Exhaustive
- 12.1.3.1. Company Overview
- 12.1.3.2. Products
- 12.1.3.3. Company Financials
- 12.1.3.4. SWOT Analysis
- 12.1.4 Canadian Solar Inc
- 12.1.4.1. Company Overview
- 12.1.4.2. Products
- 12.1.4.3. Company Financials
- 12.1.4.4. SWOT Analysis
- 12.1.5 City Solar
- 12.1.5.1. Company Overview
- 12.1.5.2. Products
- 12.1.5.3. Company Financials
- 12.1.5.4. SWOT Analysis
- 12.1.6 Masdar (Abu Dhabi Future Energy Company)
- 12.1.6.1. Company Overview
- 12.1.6.2. Products
- 12.1.6.3. Company Financials
- 12.1.6.4. SWOT Analysis
- 12.1.7 MAYSUN SOLAR FZCO
- 12.1.7.1. Company Overview
- 12.1.7.2. Products
- 12.1.7.3. Company Financials
- 12.1.7.4. SWOT Analysis
- 12.1.8 Enerwhere
- 12.1.8.1. Company Overview
- 12.1.8.2. Products
- 12.1.8.3. Company Financials
- 12.1.8.4. SWOT Analysis
- 12.1.9 ACWA Power
- 12.1.9.1. Company Overview
- 12.1.9.2. Products
- 12.1.9.3. Company Financials
- 12.1.9.4. SWOT Analysis
- 12.1.1 JinkoSolar Holding Co Ltd
- 12.2. Market Entropy
- 12.2.1 Company's Key Areas Served
- 12.2.2 Recent Developments
- 12.3. Company Market Share Analysis 2025
- 12.3.1 Top 5 Companies Market Share Analysis
- 12.3.2 Top 3 Companies Market Share Analysis
- 12.4. List of Potential Customers
- 13. Research Methodology
List of Figures
- Figure 1: Global UAE Solar Energy Industry Revenue Breakdown (billion, %) by Region 2025 & 2033
- Figure 2: Global UAE Solar Energy Industry Volume Breakdown (gigawatt, %) by Region 2025 & 2033
- Figure 3: North America UAE Solar Energy Industry Revenue (billion), by Technology 2025 & 2033
- Figure 4: North America UAE Solar Energy Industry Volume (gigawatt), by Technology 2025 & 2033
- Figure 5: North America UAE Solar Energy Industry Revenue Share (%), by Technology 2025 & 2033
- Figure 6: North America UAE Solar Energy Industry Volume Share (%), by Technology 2025 & 2033
- Figure 7: North America UAE Solar Energy Industry Revenue (billion), by Deployment 2025 & 2033
- Figure 8: North America UAE Solar Energy Industry Volume (gigawatt), by Deployment 2025 & 2033
- Figure 9: North America UAE Solar Energy Industry Revenue Share (%), by Deployment 2025 & 2033
- Figure 10: North America UAE Solar Energy Industry Volume Share (%), by Deployment 2025 & 2033
- Figure 11: North America UAE Solar Energy Industry Revenue (billion), by Country 2025 & 2033
- Figure 12: North America UAE Solar Energy Industry Volume (gigawatt), by Country 2025 & 2033
- Figure 13: North America UAE Solar Energy Industry Revenue Share (%), by Country 2025 & 2033
- Figure 14: North America UAE Solar Energy Industry Volume Share (%), by Country 2025 & 2033
- Figure 15: South America UAE Solar Energy Industry Revenue (billion), by Technology 2025 & 2033
- Figure 16: South America UAE Solar Energy Industry Volume (gigawatt), by Technology 2025 & 2033
- Figure 17: South America UAE Solar Energy Industry Revenue Share (%), by Technology 2025 & 2033
- Figure 18: South America UAE Solar Energy Industry Volume Share (%), by Technology 2025 & 2033
- Figure 19: South America UAE Solar Energy Industry Revenue (billion), by Deployment 2025 & 2033
- Figure 20: South America UAE Solar Energy Industry Volume (gigawatt), by Deployment 2025 & 2033
- Figure 21: South America UAE Solar Energy Industry Revenue Share (%), by Deployment 2025 & 2033
- Figure 22: South America UAE Solar Energy Industry Volume Share (%), by Deployment 2025 & 2033
- Figure 23: South America UAE Solar Energy Industry Revenue (billion), by Country 2025 & 2033
- Figure 24: South America UAE Solar Energy Industry Volume (gigawatt), by Country 2025 & 2033
- Figure 25: South America UAE Solar Energy Industry Revenue Share (%), by Country 2025 & 2033
- Figure 26: South America UAE Solar Energy Industry Volume Share (%), by Country 2025 & 2033
- Figure 27: Europe UAE Solar Energy Industry Revenue (billion), by Technology 2025 & 2033
- Figure 28: Europe UAE Solar Energy Industry Volume (gigawatt), by Technology 2025 & 2033
- Figure 29: Europe UAE Solar Energy Industry Revenue Share (%), by Technology 2025 & 2033
- Figure 30: Europe UAE Solar Energy Industry Volume Share (%), by Technology 2025 & 2033
- Figure 31: Europe UAE Solar Energy Industry Revenue (billion), by Deployment 2025 & 2033
- Figure 32: Europe UAE Solar Energy Industry Volume (gigawatt), by Deployment 2025 & 2033
- Figure 33: Europe UAE Solar Energy Industry Revenue Share (%), by Deployment 2025 & 2033
- Figure 34: Europe UAE Solar Energy Industry Volume Share (%), by Deployment 2025 & 2033
- Figure 35: Europe UAE Solar Energy Industry Revenue (billion), by Country 2025 & 2033
- Figure 36: Europe UAE Solar Energy Industry Volume (gigawatt), by Country 2025 & 2033
- Figure 37: Europe UAE Solar Energy Industry Revenue Share (%), by Country 2025 & 2033
- Figure 38: Europe UAE Solar Energy Industry Volume Share (%), by Country 2025 & 2033
- Figure 39: Middle East & Africa UAE Solar Energy Industry Revenue (billion), by Technology 2025 & 2033
- Figure 40: Middle East & Africa UAE Solar Energy Industry Volume (gigawatt), by Technology 2025 & 2033
- Figure 41: Middle East & Africa UAE Solar Energy Industry Revenue Share (%), by Technology 2025 & 2033
- Figure 42: Middle East & Africa UAE Solar Energy Industry Volume Share (%), by Technology 2025 & 2033
- Figure 43: Middle East & Africa UAE Solar Energy Industry Revenue (billion), by Deployment 2025 & 2033
- Figure 44: Middle East & Africa UAE Solar Energy Industry Volume (gigawatt), by Deployment 2025 & 2033
- Figure 45: Middle East & Africa UAE Solar Energy Industry Revenue Share (%), by Deployment 2025 & 2033
- Figure 46: Middle East & Africa UAE Solar Energy Industry Volume Share (%), by Deployment 2025 & 2033
- Figure 47: Middle East & Africa UAE Solar Energy Industry Revenue (billion), by Country 2025 & 2033
- Figure 48: Middle East & Africa UAE Solar Energy Industry Volume (gigawatt), by Country 2025 & 2033
- Figure 49: Middle East & Africa UAE Solar Energy Industry Revenue Share (%), by Country 2025 & 2033
- Figure 50: Middle East & Africa UAE Solar Energy Industry Volume Share (%), by Country 2025 & 2033
- Figure 51: Asia Pacific UAE Solar Energy Industry Revenue (billion), by Technology 2025 & 2033
- Figure 52: Asia Pacific UAE Solar Energy Industry Volume (gigawatt), by Technology 2025 & 2033
- Figure 53: Asia Pacific UAE Solar Energy Industry Revenue Share (%), by Technology 2025 & 2033
- Figure 54: Asia Pacific UAE Solar Energy Industry Volume Share (%), by Technology 2025 & 2033
- Figure 55: Asia Pacific UAE Solar Energy Industry Revenue (billion), by Deployment 2025 & 2033
- Figure 56: Asia Pacific UAE Solar Energy Industry Volume (gigawatt), by Deployment 2025 & 2033
- Figure 57: Asia Pacific UAE Solar Energy Industry Revenue Share (%), by Deployment 2025 & 2033
- Figure 58: Asia Pacific UAE Solar Energy Industry Volume Share (%), by Deployment 2025 & 2033
- Figure 59: Asia Pacific UAE Solar Energy Industry Revenue (billion), by Country 2025 & 2033
- Figure 60: Asia Pacific UAE Solar Energy Industry Volume (gigawatt), by Country 2025 & 2033
- Figure 61: Asia Pacific UAE Solar Energy Industry Revenue Share (%), by Country 2025 & 2033
- Figure 62: Asia Pacific UAE Solar Energy Industry Volume Share (%), by Country 2025 & 2033
List of Tables
- Table 1: Global UAE Solar Energy Industry Revenue billion Forecast, by Technology 2020 & 2033
- Table 2: Global UAE Solar Energy Industry Volume gigawatt Forecast, by Technology 2020 & 2033
- Table 3: Global UAE Solar Energy Industry Revenue billion Forecast, by Deployment 2020 & 2033
- Table 4: Global UAE Solar Energy Industry Volume gigawatt Forecast, by Deployment 2020 & 2033
- Table 5: Global UAE Solar Energy Industry Revenue billion Forecast, by Region 2020 & 2033
- Table 6: Global UAE Solar Energy Industry Volume gigawatt Forecast, by Region 2020 & 2033
- Table 7: Global UAE Solar Energy Industry Revenue billion Forecast, by Technology 2020 & 2033
- Table 8: Global UAE Solar Energy Industry Volume gigawatt Forecast, by Technology 2020 & 2033
- Table 9: Global UAE Solar Energy Industry Revenue billion Forecast, by Deployment 2020 & 2033
- Table 10: Global UAE Solar Energy Industry Volume gigawatt Forecast, by Deployment 2020 & 2033
- Table 11: Global UAE Solar Energy Industry Revenue billion Forecast, by Country 2020 & 2033
- Table 12: Global UAE Solar Energy Industry Volume gigawatt Forecast, by Country 2020 & 2033
- Table 13: United States UAE Solar Energy Industry Revenue (billion) Forecast, by Application 2020 & 2033
- Table 14: United States UAE Solar Energy Industry Volume (gigawatt) Forecast, by Application 2020 & 2033
- Table 15: Canada UAE Solar Energy Industry Revenue (billion) Forecast, by Application 2020 & 2033
- Table 16: Canada UAE Solar Energy Industry Volume (gigawatt) Forecast, by Application 2020 & 2033
- Table 17: Mexico UAE Solar Energy Industry Revenue (billion) Forecast, by Application 2020 & 2033
- Table 18: Mexico UAE Solar Energy Industry Volume (gigawatt) Forecast, by Application 2020 & 2033
- Table 19: Global UAE Solar Energy Industry Revenue billion Forecast, by Technology 2020 & 2033
- Table 20: Global UAE Solar Energy Industry Volume gigawatt Forecast, by Technology 2020 & 2033
- Table 21: Global UAE Solar Energy Industry Revenue billion Forecast, by Deployment 2020 & 2033
- Table 22: Global UAE Solar Energy Industry Volume gigawatt Forecast, by Deployment 2020 & 2033
- Table 23: Global UAE Solar Energy Industry Revenue billion Forecast, by Country 2020 & 2033
- Table 24: Global UAE Solar Energy Industry Volume gigawatt Forecast, by Country 2020 & 2033
- Table 25: Brazil UAE Solar Energy Industry Revenue (billion) Forecast, by Application 2020 & 2033
- Table 26: Brazil UAE Solar Energy Industry Volume (gigawatt) Forecast, by Application 2020 & 2033
- Table 27: Argentina UAE Solar Energy Industry Revenue (billion) Forecast, by Application 2020 & 2033
- Table 28: Argentina UAE Solar Energy Industry Volume (gigawatt) Forecast, by Application 2020 & 2033
- Table 29: Rest of South America UAE Solar Energy Industry Revenue (billion) Forecast, by Application 2020 & 2033
- Table 30: Rest of South America UAE Solar Energy Industry Volume (gigawatt) Forecast, by Application 2020 & 2033
- Table 31: Global UAE Solar Energy Industry Revenue billion Forecast, by Technology 2020 & 2033
- Table 32: Global UAE Solar Energy Industry Volume gigawatt Forecast, by Technology 2020 & 2033
- Table 33: Global UAE Solar Energy Industry Revenue billion Forecast, by Deployment 2020 & 2033
- Table 34: Global UAE Solar Energy Industry Volume gigawatt Forecast, by Deployment 2020 & 2033
- Table 35: Global UAE Solar Energy Industry Revenue billion Forecast, by Country 2020 & 2033
- Table 36: Global UAE Solar Energy Industry Volume gigawatt Forecast, by Country 2020 & 2033
- Table 37: United Kingdom UAE Solar Energy Industry Revenue (billion) Forecast, by Application 2020 & 2033
- Table 38: United Kingdom UAE Solar Energy Industry Volume (gigawatt) Forecast, by Application 2020 & 2033
- Table 39: Germany UAE Solar Energy Industry Revenue (billion) Forecast, by Application 2020 & 2033
- Table 40: Germany UAE Solar Energy Industry Volume (gigawatt) Forecast, by Application 2020 & 2033
- Table 41: France UAE Solar Energy Industry Revenue (billion) Forecast, by Application 2020 & 2033
- Table 42: France UAE Solar Energy Industry Volume (gigawatt) Forecast, by Application 2020 & 2033
- Table 43: Italy UAE Solar Energy Industry Revenue (billion) Forecast, by Application 2020 & 2033
- Table 44: Italy UAE Solar Energy Industry Volume (gigawatt) Forecast, by Application 2020 & 2033
- Table 45: Spain UAE Solar Energy Industry Revenue (billion) Forecast, by Application 2020 & 2033
- Table 46: Spain UAE Solar Energy Industry Volume (gigawatt) Forecast, by Application 2020 & 2033
- Table 47: Russia UAE Solar Energy Industry Revenue (billion) Forecast, by Application 2020 & 2033
- Table 48: Russia UAE Solar Energy Industry Volume (gigawatt) Forecast, by Application 2020 & 2033
- Table 49: Benelux UAE Solar Energy Industry Revenue (billion) Forecast, by Application 2020 & 2033
- Table 50: Benelux UAE Solar Energy Industry Volume (gigawatt) Forecast, by Application 2020 & 2033
- Table 51: Nordics UAE Solar Energy Industry Revenue (billion) Forecast, by Application 2020 & 2033
- Table 52: Nordics UAE Solar Energy Industry Volume (gigawatt) Forecast, by Application 2020 & 2033
- Table 53: Rest of Europe UAE Solar Energy Industry Revenue (billion) Forecast, by Application 2020 & 2033
- Table 54: Rest of Europe UAE Solar Energy Industry Volume (gigawatt) Forecast, by Application 2020 & 2033
- Table 55: Global UAE Solar Energy Industry Revenue billion Forecast, by Technology 2020 & 2033
- Table 56: Global UAE Solar Energy Industry Volume gigawatt Forecast, by Technology 2020 & 2033
- Table 57: Global UAE Solar Energy Industry Revenue billion Forecast, by Deployment 2020 & 2033
- Table 58: Global UAE Solar Energy Industry Volume gigawatt Forecast, by Deployment 2020 & 2033
- Table 59: Global UAE Solar Energy Industry Revenue billion Forecast, by Country 2020 & 2033
- Table 60: Global UAE Solar Energy Industry Volume gigawatt Forecast, by Country 2020 & 2033
- Table 61: Turkey UAE Solar Energy Industry Revenue (billion) Forecast, by Application 2020 & 2033
- Table 62: Turkey UAE Solar Energy Industry Volume (gigawatt) Forecast, by Application 2020 & 2033
- Table 63: Israel UAE Solar Energy Industry Revenue (billion) Forecast, by Application 2020 & 2033
- Table 64: Israel UAE Solar Energy Industry Volume (gigawatt) Forecast, by Application 2020 & 2033
- Table 65: GCC UAE Solar Energy Industry Revenue (billion) Forecast, by Application 2020 & 2033
- Table 66: GCC UAE Solar Energy Industry Volume (gigawatt) Forecast, by Application 2020 & 2033
- Table 67: North Africa UAE Solar Energy Industry Revenue (billion) Forecast, by Application 2020 & 2033
- Table 68: North Africa UAE Solar Energy Industry Volume (gigawatt) Forecast, by Application 2020 & 2033
- Table 69: South Africa UAE Solar Energy Industry Revenue (billion) Forecast, by Application 2020 & 2033
- Table 70: South Africa UAE Solar Energy Industry Volume (gigawatt) Forecast, by Application 2020 & 2033
- Table 71: Rest of Middle East & Africa UAE Solar Energy Industry Revenue (billion) Forecast, by Application 2020 & 2033
- Table 72: Rest of Middle East & Africa UAE Solar Energy Industry Volume (gigawatt) Forecast, by Application 2020 & 2033
- Table 73: Global UAE Solar Energy Industry Revenue billion Forecast, by Technology 2020 & 2033
- Table 74: Global UAE Solar Energy Industry Volume gigawatt Forecast, by Technology 2020 & 2033
- Table 75: Global UAE Solar Energy Industry Revenue billion Forecast, by Deployment 2020 & 2033
- Table 76: Global UAE Solar Energy Industry Volume gigawatt Forecast, by Deployment 2020 & 2033
- Table 77: Global UAE Solar Energy Industry Revenue billion Forecast, by Country 2020 & 2033
- Table 78: Global UAE Solar Energy Industry Volume gigawatt Forecast, by Country 2020 & 2033
- Table 79: China UAE Solar Energy Industry Revenue (billion) Forecast, by Application 2020 & 2033
- Table 80: China UAE Solar Energy Industry Volume (gigawatt) Forecast, by Application 2020 & 2033
- Table 81: India UAE Solar Energy Industry Revenue (billion) Forecast, by Application 2020 & 2033
- Table 82: India UAE Solar Energy Industry Volume (gigawatt) Forecast, by Application 2020 & 2033
- Table 83: Japan UAE Solar Energy Industry Revenue (billion) Forecast, by Application 2020 & 2033
- Table 84: Japan UAE Solar Energy Industry Volume (gigawatt) Forecast, by Application 2020 & 2033
- Table 85: South Korea UAE Solar Energy Industry Revenue (billion) Forecast, by Application 2020 & 2033
- Table 86: South Korea UAE Solar Energy Industry Volume (gigawatt) Forecast, by Application 2020 & 2033
- Table 87: ASEAN UAE Solar Energy Industry Revenue (billion) Forecast, by Application 2020 & 2033
- Table 88: ASEAN UAE Solar Energy Industry Volume (gigawatt) Forecast, by Application 2020 & 2033
- Table 89: Oceania UAE Solar Energy Industry Revenue (billion) Forecast, by Application 2020 & 2033
- Table 90: Oceania UAE Solar Energy Industry Volume (gigawatt) Forecast, by Application 2020 & 2033
- Table 91: Rest of Asia Pacific UAE Solar Energy Industry Revenue (billion) Forecast, by Application 2020 & 2033
- Table 92: Rest of Asia Pacific UAE Solar Energy Industry Volume (gigawatt) Forecast, by Application 2020 & 2033
Frequently Asked Questions
1. What is the projected Compound Annual Growth Rate (CAGR) of the UAE Solar Energy Industry?
The projected CAGR is approximately 22.33%.
2. Which companies are prominent players in the UAE Solar Energy Industry?
Key companies in the market include JinkoSolar Holding Co Ltd, Sunergy Solar, CleanMax Mena FZCO*List Not Exhaustive, Canadian Solar Inc, City Solar, Masdar (Abu Dhabi Future Energy Company), MAYSUN SOLAR FZCO, Enerwhere, ACWA Power.
3. What are the main segments of the UAE Solar Energy Industry?
The market segments include Technology, Deployment.
4. Can you provide details about the market size?
The market size is estimated to be USD 10.3 billion as of 2022.
5. What are some drivers contributing to market growth?
4.; Rising Government Policies to Support Solar PV Installation4.; Rising Installation of Renewable Energy to Reduce Dependency on Fossil Fuels.
6. What are the notable trends driving market growth?
Solar Photovoltaic to Dominate the Market.
7. Are there any restraints impacting market growth?
4.; Rising Adoption of Alternative Clean Energy Sources such as Wind. Geothermal. Bioenergy. and Others.
8. Can you provide examples of recent developments in the market?
May 2023: ADNOC Distribution announced a key partnership with Emerge, a joint venture between EDF and Masdar, to develop on-site solar power across its service station network. The project will commence in Dubai in 2023 to generate clean energy.
9. What pricing options are available for accessing the report?
Pricing options include single-user, multi-user, and enterprise licenses priced at USD 3800, USD 4500, and USD 5800 respectively.
10. Is the market size provided in terms of value or volume?
The market size is provided in terms of value, measured in billion and volume, measured in gigawatt.
11. Are there any specific market keywords associated with the report?
Yes, the market keyword associated with the report is "UAE Solar Energy Industry," which aids in identifying and referencing the specific market segment covered.
12. How do I determine which pricing option suits my needs best?
The pricing options vary based on user requirements and access needs. Individual users may opt for single-user licenses, while businesses requiring broader access may choose multi-user or enterprise licenses for cost-effective access to the report.
13. Are there any additional resources or data provided in the UAE Solar Energy Industry report?
While the report offers comprehensive insights, it's advisable to review the specific contents or supplementary materials provided to ascertain if additional resources or data are available.
14. How can I stay updated on further developments or reports in the UAE Solar Energy Industry?
To stay informed about further developments, trends, and reports in the UAE Solar Energy Industry, consider subscribing to industry newsletters, following relevant companies and organizations, or regularly checking reputable industry news sources and publications.
Methodology
Step 1 - Identification of Relevant Samples Size from Population Database


Step 2 - Approaches for Defining Global Market Size (Value, Volume* & Price*)

Note*: In applicable scenarios
Step 3 - Data Sources
Primary Research
- Web Analytics
- Survey Reports
- Research Institute
- Latest Research Reports
- Opinion Leaders
Secondary Research
- Annual Reports
- White Paper
- Latest Press Release
- Industry Association
- Paid Database
- Investor Presentations

Step 4 - Data Triangulation
Involves using different sources of information in order to increase the validity of a study
These sources are likely to be stakeholders in a program - participants, other researchers, program staff, other community members, and so on.
Then we put all data in single framework & apply various statistical tools to find out the dynamic on the market.
During the analysis stage, feedback from the stakeholder groups would be compared to determine areas of agreement as well as areas of divergence