

Key Insights
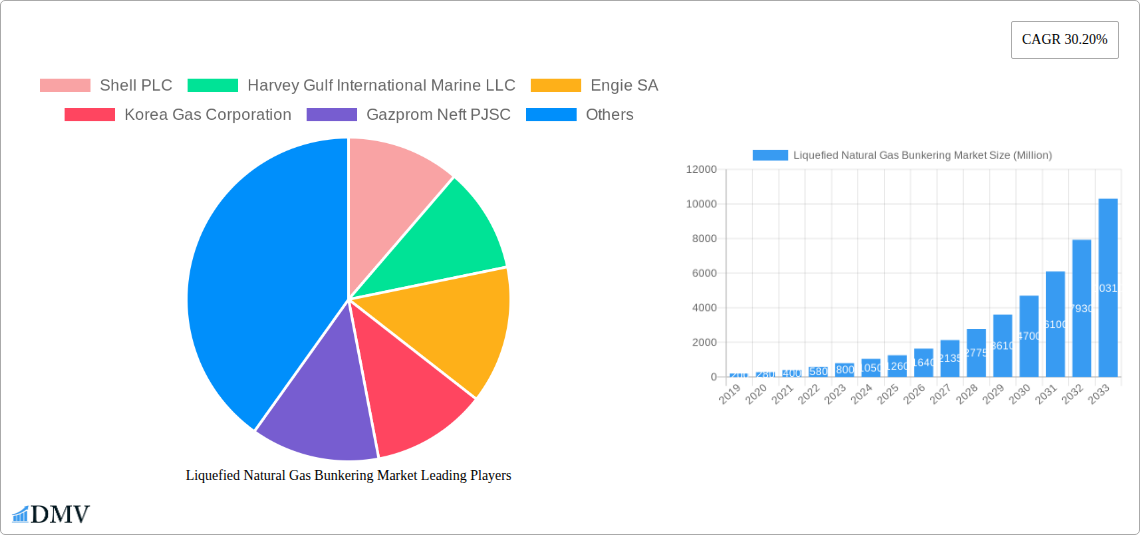
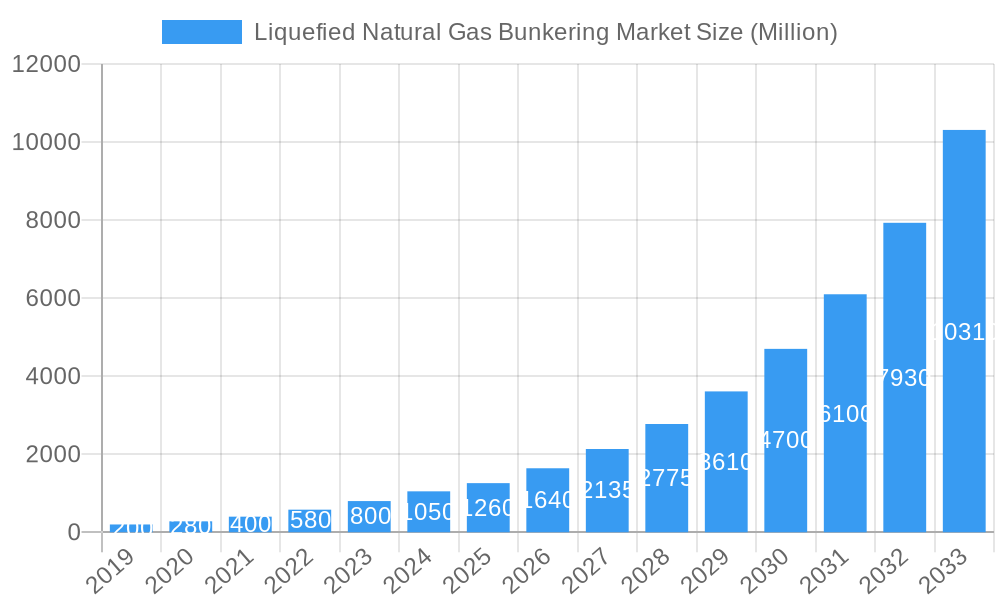
The global Liquefied Natural Gas (LNG) Bunkering Market is experiencing unprecedented growth, projected to reach an estimated $1.26 billion by 2025. This remarkable expansion is fueled by a substantial Compound Annual Growth Rate (CAGR) of 30.20%, indicating a robust and sustained upward trajectory for the foreseeable future, extending through 2033. The primary driver behind this surge is the increasing global demand for cleaner maritime fuels, spurred by stringent environmental regulations and a growing industry commitment to reducing greenhouse gas emissions. Shipping companies are actively seeking alternatives to traditional heavy fuel oil, and LNG offers a compelling solution with significantly lower sulfur dioxide and nitrogen oxide emissions, making it a vital component of the decarbonization efforts within the maritime sector. The development of new LNG bunkering infrastructure, including specialized terminals and vessels, is rapidly expanding, further facilitating the adoption of LNG as a marine fuel.
Liquefied Natural Gas Bunkering Market Market Size (In Million)
The market is segmented across various end-user fleets, with the Tanker Fleet and Container Fleet segments expected to dominate demand due to their significant fuel consumption and the increasing pressure on these segments to comply with environmental standards. Bulk and General Cargo Fleet, Ferries and OSV (Offshore Support Vessels) also represent crucial growth areas, as more operators within these categories embrace LNG. Key industry players, including global energy giants like Shell PLC, TotalEnergies SE, and Engie SA, alongside specialized maritime companies such as Harvey Gulf International Marine LLC, are heavily investing in LNG bunkering solutions, signaling strong market confidence. The strategic expansion of LNG bunkering facilities across key global shipping routes, particularly in regions with high maritime traffic and stringent environmental policies, will be critical for realizing the full market potential. While the transition presents significant opportunities, challenges such as the initial capital investment for infrastructure and the need for standardized bunkering protocols will need to be addressed to ensure seamless market penetration and widespread adoption.
Liquefied Natural Gas Bunkering Market Company Market Share
This comprehensive report delves deep into the global Liquefied Natural Gas (LNG) bunkering market, a rapidly evolving sector poised for substantial growth. Examining trends, innovations, and strategic developments from 2019 to 2033, with a focus on the base and estimated year of 2025 and the forecast period of 2025-2033, this analysis provides critical insights for stakeholders navigating the transition to cleaner maritime fuels. We dissect market dynamics, competitive landscapes, and emerging opportunities within the LNG marine fuel industry, highlighting the pivotal role of LNG as a bunker fuel in achieving decarbonization goals.
Liquefied Natural Gas Bunkering Market Market Composition & Trends
The LNG bunkering market exhibits a moderate concentration, with leading players like Shell PLC, Harvey Gulf International Marine LLC, and Engie SA driving innovation and infrastructure development. The market's evolution is fueled by a strong impetus towards environmental sustainability, propelled by stringent IMO regulations and growing pressure from consumers for greener shipping solutions. Substitute products, such as methanol and ammonia, are emerging, but LNG currently holds a significant advantage due to its established infrastructure and relatively lower greenhouse gas emissions compared to traditional heavy fuel oil. End-user profiles reveal a strong demand from the Tanker Fleet, Container Fleet, and Bulk and General Cargo Fleet, with the Ferries and OSV segment also showing increasing adoption. Mergers and acquisitions (M&A) activities are becoming more prevalent, as companies strategically position themselves to capture market share. For instance, recent M&A deals in the maritime fuel sector have seen valuations in the range of $50 Million to $500 Million, indicating significant investment interest. Key market share distributors are the major energy companies and specialized bunkering service providers, with a projected market share distribution shifting towards LNG by an estimated 15% within the forecast period.
Liquefied Natural Gas Bunkering Market Industry Evolution
The LNG bunkering industry has undergone a remarkable transformation over the study period of 2019–2033. Initially a nascent market, it has matured significantly, driven by a confluence of factors including increasingly stringent environmental regulations, a growing awareness of the need for cleaner maritime fuels, and technological advancements in LNG handling and liquefaction. The historical period (2019-2024) witnessed the foundational development of bunkering infrastructure and the initial adoption of LNG-powered vessels by a few forward-thinking shipping companies. This period saw a modest compound annual growth rate (CAGR) of approximately 8%. As the industry moved into the base year of 2025, the market solidified its growth trajectory.
Technological advancements have been instrumental in this evolution. The development of more efficient and safer LNG bunkering vessels, alongside improvements in shore-based receiving and storage facilities, has reduced operational costs and enhanced the overall appeal of LNG as a maritime fuel. Furthermore, the dual-fuel engine technology has become more sophisticated, allowing vessels to seamlessly switch between LNG and other fuels, thereby providing operational flexibility.
Shifting consumer demands, particularly from cargo owners and charterers, have also played a crucial role. The increasing focus on supply chain sustainability and corporate social responsibility has led to a preference for shipping partners who demonstrate a commitment to reducing their environmental footprint. This has translated into a growing demand for vessels that utilize cleaner fuels like LNG. The adoption rate of LNG-powered vessels has accelerated, with an estimated 25% increase in new vessel orders utilizing LNG propulsion by 2025. Projections indicate that by 2033, the LNG bunkering market is expected to achieve a CAGR of 12%, driven by further technological refinements, expanded global bunkering networks, and continued regulatory support for decarbonization efforts in the shipping industry. The market is moving beyond early adopters towards mainstream acceptance as a viable and sustainable alternative to conventional marine fuels, with market size anticipated to reach $XXX Billion by 2033.
Leading Regions, Countries, or Segments in Liquefied Natural Gas Bunkering Market
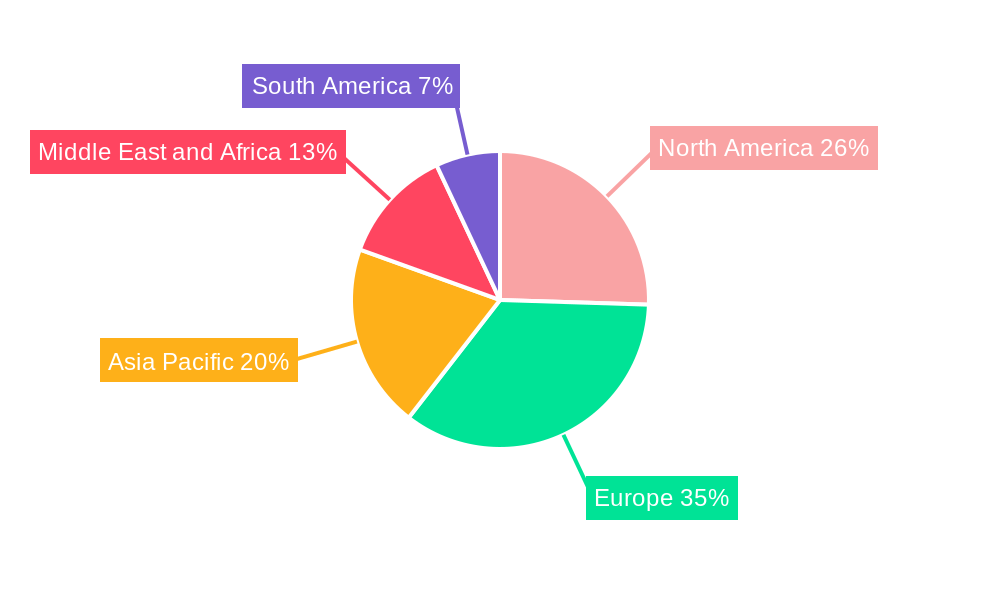
The Liquefied Natural Gas Bunkering Market is witnessing a significant shift in dominance, with Asia-Pacific emerging as the leading region, driven by strong governmental support, extensive port infrastructure, and a burgeoning shipping industry. Within this region, China stands out as a key player, propelled by its ambitious maritime decarbonization goals and substantial investments in LNG bunkering facilities. The Container Fleet segment is currently the most dominant end-user, accounting for an estimated 35% of the total LNG bunkering demand. This is largely attributed to major container shipping lines, such as CMA CGM, actively investing in dual-fuel vessels powered by LNG to meet environmental targets and reduce operational costs.
Key Drivers for Asia-Pacific Dominance:
- Regulatory Support: Governments in countries like China, South Korea, and Japan are implementing favorable policies, subsidies, and emissions standards that encourage the adoption of LNG as a marine fuel.
- Port Infrastructure Development: Significant investments are being made in developing state-of-the-art LNG bunkering terminals and hubs in major Asian ports, facilitating efficient and cost-effective refueling operations. For example, Shanghai Port has been a pioneer in establishing comprehensive LNG bunkering services.
- Growing Maritime Trade: The region's status as a global manufacturing and trading hub leads to a high volume of maritime traffic, creating a substantial demand for cleaner bunker fuels.
- Environmental Consciousness: Increasing awareness of air pollution and climate change concerns among both consumers and corporations is pushing shipping companies to adopt greener alternatives.
Dominance of the Container Fleet Segment:
- Long-Haul Routes and Vessel Size: Container ships, particularly large ones, operate on long-haul routes where the availability of LNG bunkering infrastructure is becoming more widespread. The fuel efficiency of LNG over extended voyages makes it an attractive option.
- Fleet Modernization Initiatives: Major container shipping companies are actively retrofitting existing vessels and ordering new builds with dual-fuel capabilities, signaling a clear commitment to LNG adoption.
- Cost Competitiveness: In many regions, the price of LNG has become increasingly competitive compared to very low sulfur fuel oil (VLSFO), making it economically viable for large fleets.
While the Container Fleet currently leads, the Tanker Fleet and Bulk and General Cargo Fleet segments are projected to experience substantial growth in LNG adoption over the forecast period, driven by similar environmental and economic imperatives. The ongoing development of LNG bunkering infrastructure in key trading routes and the increasing availability of LNG-powered vessels across all segments are key indicators of the market's robust expansion in the coming years.
Liquefied Natural Gas Bunkering Market Product Innovations
Product innovation in the LNG bunkering market is primarily focused on enhancing the efficiency, safety, and accessibility of LNG as a marine fuel. Advancements include the development of modular and scalable bunkering facilities, reducing the capital expenditure for port operators. Innovations in LNG bunkering vessels are leading to faster and more flexible ship-to-ship refueling capabilities. Furthermore, smart technology integration is improving supply chain management and real-time monitoring of LNG quality and quantity. Applications are expanding beyond traditional vessel types to include offshore support vessels and even smaller harbor craft. Performance metrics are being refined to demonstrate reduced emissions (SOx, NOx, and CO2) and improved operational economics for shipping companies, solidifying LNG's position as a leading alternative marine fuel.
Propelling Factors for Liquefied Natural Gas Bunkering Market Growth
Several key factors are propelling the Liquefied Natural Gas Bunkering Market forward. Stringent International Maritime Organization (IMO) regulations on sulfur emissions and greenhouse gases are a primary driver, pushing the industry towards cleaner alternatives. The growing environmental consciousness among consumers and charterers is also influencing shipping companies to adopt sustainable practices. Technological advancements in LNG-powered engines and bunkering infrastructure have made LNG a more viable and accessible fuel option. Furthermore, the competitive pricing of LNG compared to traditional fuels, coupled with the increasing global availability of LNG, contributes significantly to its adoption. The strategic investments by major energy companies and shipping lines in developing LNG supply chains and fleets further solidify its growth trajectory.
Obstacles in the Liquefied Natural Gas Bunkering Market Market
Despite its promising growth, the Liquefied Natural Gas Bunkering Market faces several obstacles. The high initial cost of LNG-powered vessels remains a significant barrier for some shipowners, especially for smaller operators. The limited global availability of LNG bunkering infrastructure, particularly in certain regions and smaller ports, can create logistical challenges and restrict operational flexibility. Fluctuations in LNG prices and the availability of supply can also pose a risk. Furthermore, concerns regarding methane slip (unburned methane escaping into the atmosphere) are a subject of ongoing research and regulatory scrutiny, requiring continuous technological advancements to mitigate. Complex regulatory frameworks and certification processes in different countries can also create hurdles for market expansion.
Future Opportunities in Liquefied Natural Gas Bunkering Market
The Liquefied Natural Gas Bunkering Market is ripe with future opportunities. The expansion of bunkering infrastructure into emerging markets and lesser-serviced trade routes presents a significant growth avenue. Continued innovation in bunkering technology, such as the development of smaller, more agile bunkering vessels and shore-side solutions, can cater to a wider range of vessel types and port sizes. The increasing demand for sustainable shipping solutions is expected to drive greater adoption of LNG as a transitional fuel towards zero-emission alternatives. Strategic partnerships between energy providers, shipbuilders, and port authorities will be crucial in unlocking new markets and developing integrated LNG supply solutions. The potential for bio-LNG and synthetic LNG also offers long-term prospects for further decarbonization.
Major Players in the Liquefied Natural Gas Bunkering Market Ecosystem
- Shell PLC
- Harvey Gulf International Marine LLC
- Engie SA
- Korea Gas Corporation
- Gazprom Neft PJSC
- ENN Energy Holdings Ltd
- Gasum Oy
- Naturgy Energy Group SA
- TotalEnergies SE
Key Developments in Liquefied Natural Gas Bunkering Market Industry
- January 2022: CMA CGM signed a ten-year contract with Shanghai International Port Group to use LNG as a bunker fuel in the Yangshan port area. CMA CGM's dual-fuelled 15,000 TEU box ships on the Pearl River Express route from China to Los Angeles will bunker in the Yangshan area, showcasing a significant commitment to LNG adoption in major shipping routes.
- August 2021: Gazprom Neft completed the construction of Russia's first LNG bunkering vessel. The bunkering vessel will provide ship-to-ship LNG transportation and refueling at ports throughout the Gulf of Finland and the Baltic Sea, enhancing LNG supply capabilities in a key European maritime region.
Strategic Liquefied Natural Gas Bunkering Market Market Forecast
The strategic outlook for the Liquefied Natural Gas Bunkering Market is exceptionally positive, driven by an intensified global focus on maritime decarbonization and the inherent environmental benefits of LNG. Regulatory tailwinds, particularly from the IMO, will continue to mandate cleaner fuels, making LNG an increasingly attractive and compliant option for a wide range of vessel types. The ongoing expansion of bunkering infrastructure across major global shipping lanes, coupled with advancements in vessel technology, will further de-risk investments and broaden accessibility. The market is poised for robust growth, with a projected CAGR of 12% over the forecast period, signaling substantial opportunities for market participants involved in supply, distribution, and vessel conversion. The increasing fleet of dual-fuel vessels and growing demand from charterers prioritizing sustainability will act as powerful catalysts for market expansion, solidifying LNG's role as a vital component of the future maritime fuel landscape.
Liquefied Natural Gas Bunkering Market Segmentation
-
1. End User
- 1.1. Tanker Fleet
- 1.2. Container Fleet
- 1.3. Bulk and General Cargo Fleet
- 1.4. Ferries and OSV
- 1.5. Other End Users
Liquefied Natural Gas Bunkering Market Segmentation By Geography
- 1. North America
- 2. Europe
- 3. Asia Pacific
- 4. Middle East and Africa
- 5. South America
Liquefied Natural Gas Bunkering Market Regional Market Share
Geographic Coverage of Liquefied Natural Gas Bunkering Market
Liquefied Natural Gas Bunkering Market REPORT HIGHLIGHTS
| Aspects | Details |
|---|---|
| Study Period | 2020-2034 |
| Base Year | 2025 |
| Estimated Year | 2026 |
| Forecast Period | 2026-2034 |
| Historical Period | 2020-2025 |
| Growth Rate | CAGR of 30.20% from 2020-2034 |
| Segmentation |
|
Table of Contents
- 1. Introduction
- 1.1. Research Scope
- 1.2. Market Segmentation
- 1.3. Research Objective
- 1.4. Definitions and Assumptions
- 2. Executive Summary
- 2.1. Market Snapshot
- 3. Market Dynamics
- 3.1. Market Drivers
- 3.2. Market Restrains
- 3.3. Market Trends
- 3.4. Market Opportunities
- 4. Market Factor Analysis
- 4.1. Porters Five Forces
- 4.1.1. Bargaining Power of Suppliers
- 4.1.2. Bargaining Power of Buyers
- 4.1.3. Threat of New Entrants
- 4.1.4. Threat of Substitutes
- 4.1.5. Competitive Rivalry
- 4.2. PESTEL analysis
- 4.3. BCG Analysis
- 4.3.1. Stars (High Growth, High Market Share)
- 4.3.2. Cash Cows (Low Growth, High Market Share)
- 4.3.3. Question Mark (High Growth, Low Market Share)
- 4.3.4. Dogs (Low Growth, Low Market Share)
- 4.4. Ansoff Matrix Analysis
- 4.5. Supply Chain Analysis
- 4.6. Regulatory Landscape
- 4.7. Current Market Potential and Opportunity Assessment (TAM–SAM–SOM Framework)
- 4.8. DMV Analyst Note
- 4.1. Porters Five Forces
- 5. Market Analysis, Insights and Forecast 2021-2033
- 5.1. Market Analysis, Insights and Forecast - by End User
- 5.1.1. Tanker Fleet
- 5.1.2. Container Fleet
- 5.1.3. Bulk and General Cargo Fleet
- 5.1.4. Ferries and OSV
- 5.1.5. Other End Users
- 5.2. Market Analysis, Insights and Forecast - by Region
- 5.2.1. North America
- 5.2.2. Europe
- 5.2.3. Asia Pacific
- 5.2.4. Middle East and Africa
- 5.2.5. South America
- 5.1. Market Analysis, Insights and Forecast - by End User
- 6. Global Liquefied Natural Gas Bunkering Market Analysis, Insights and Forecast, 2021-2033
- 6.1. Market Analysis, Insights and Forecast - by End User
- 6.1.1. Tanker Fleet
- 6.1.2. Container Fleet
- 6.1.3. Bulk and General Cargo Fleet
- 6.1.4. Ferries and OSV
- 6.1.5. Other End Users
- 6.1. Market Analysis, Insights and Forecast - by End User
- 7. North America Liquefied Natural Gas Bunkering Market Analysis, Insights and Forecast, 2020-2032
- 7.1. Market Analysis, Insights and Forecast - by End User
- 7.1.1. Tanker Fleet
- 7.1.2. Container Fleet
- 7.1.3. Bulk and General Cargo Fleet
- 7.1.4. Ferries and OSV
- 7.1.5. Other End Users
- 7.1. Market Analysis, Insights and Forecast - by End User
- 8. Europe Liquefied Natural Gas Bunkering Market Analysis, Insights and Forecast, 2020-2032
- 8.1. Market Analysis, Insights and Forecast - by End User
- 8.1.1. Tanker Fleet
- 8.1.2. Container Fleet
- 8.1.3. Bulk and General Cargo Fleet
- 8.1.4. Ferries and OSV
- 8.1.5. Other End Users
- 8.1. Market Analysis, Insights and Forecast - by End User
- 9. Asia Pacific Liquefied Natural Gas Bunkering Market Analysis, Insights and Forecast, 2020-2032
- 9.1. Market Analysis, Insights and Forecast - by End User
- 9.1.1. Tanker Fleet
- 9.1.2. Container Fleet
- 9.1.3. Bulk and General Cargo Fleet
- 9.1.4. Ferries and OSV
- 9.1.5. Other End Users
- 9.1. Market Analysis, Insights and Forecast - by End User
- 10. Middle East and Africa Liquefied Natural Gas Bunkering Market Analysis, Insights and Forecast, 2020-2032
- 10.1. Market Analysis, Insights and Forecast - by End User
- 10.1.1. Tanker Fleet
- 10.1.2. Container Fleet
- 10.1.3. Bulk and General Cargo Fleet
- 10.1.4. Ferries and OSV
- 10.1.5. Other End Users
- 10.1. Market Analysis, Insights and Forecast - by End User
- 11. South America Liquefied Natural Gas Bunkering Market Analysis, Insights and Forecast, 2020-2032
- 11.1. Market Analysis, Insights and Forecast - by End User
- 11.1.1. Tanker Fleet
- 11.1.2. Container Fleet
- 11.1.3. Bulk and General Cargo Fleet
- 11.1.4. Ferries and OSV
- 11.1.5. Other End Users
- 11.1. Market Analysis, Insights and Forecast - by End User
- 12. Competitive Analysis
- 12.1. Company Profiles
- 12.1.1 Shell PLC
- 12.1.1.1. Company Overview
- 12.1.1.2. Products
- 12.1.1.3. Company Financials
- 12.1.1.4. SWOT Analysis
- 12.1.2 Harvey Gulf International Marine LLC
- 12.1.2.1. Company Overview
- 12.1.2.2. Products
- 12.1.2.3. Company Financials
- 12.1.2.4. SWOT Analysis
- 12.1.3 Engie SA
- 12.1.3.1. Company Overview
- 12.1.3.2. Products
- 12.1.3.3. Company Financials
- 12.1.3.4. SWOT Analysis
- 12.1.4 Korea Gas Corporation
- 12.1.4.1. Company Overview
- 12.1.4.2. Products
- 12.1.4.3. Company Financials
- 12.1.4.4. SWOT Analysis
- 12.1.5 Gazprom Neft PJSC
- 12.1.5.1. Company Overview
- 12.1.5.2. Products
- 12.1.5.3. Company Financials
- 12.1.5.4. SWOT Analysis
- 12.1.6 ENN Energy Holdings Ltd
- 12.1.6.1. Company Overview
- 12.1.6.2. Products
- 12.1.6.3. Company Financials
- 12.1.6.4. SWOT Analysis
- 12.1.7 Gasum Oy
- 12.1.7.1. Company Overview
- 12.1.7.2. Products
- 12.1.7.3. Company Financials
- 12.1.7.4. SWOT Analysis
- 12.1.8 Naturgy Energy Group SA
- 12.1.8.1. Company Overview
- 12.1.8.2. Products
- 12.1.8.3. Company Financials
- 12.1.8.4. SWOT Analysis
- 12.1.9 TotalEnergies SE
- 12.1.9.1. Company Overview
- 12.1.9.2. Products
- 12.1.9.3. Company Financials
- 12.1.9.4. SWOT Analysis
- 12.1.1 Shell PLC
- 12.2. Market Entropy
- 12.2.1 Company's Key Areas Served
- 12.2.2 Recent Developments
- 12.3. Company Market Share Analysis 2025
- 12.3.1 Top 5 Companies Market Share Analysis
- 12.3.2 Top 3 Companies Market Share Analysis
- 12.4. List of Potential Customers
- 13. Research Methodology
List of Figures
- Figure 1: Global Liquefied Natural Gas Bunkering Market Revenue Breakdown (Million, %) by Region 2025 & 2033
- Figure 2: Global Liquefied Natural Gas Bunkering Market Volume Breakdown (K Unit, %) by Region 2025 & 2033
- Figure 3: North America Liquefied Natural Gas Bunkering Market Revenue (Million), by End User 2025 & 2033
- Figure 4: North America Liquefied Natural Gas Bunkering Market Volume (K Unit), by End User 2025 & 2033
- Figure 5: North America Liquefied Natural Gas Bunkering Market Revenue Share (%), by End User 2025 & 2033
- Figure 6: North America Liquefied Natural Gas Bunkering Market Volume Share (%), by End User 2025 & 2033
- Figure 7: North America Liquefied Natural Gas Bunkering Market Revenue (Million), by Country 2025 & 2033
- Figure 8: North America Liquefied Natural Gas Bunkering Market Volume (K Unit), by Country 2025 & 2033
- Figure 9: North America Liquefied Natural Gas Bunkering Market Revenue Share (%), by Country 2025 & 2033
- Figure 10: North America Liquefied Natural Gas Bunkering Market Volume Share (%), by Country 2025 & 2033
- Figure 11: Europe Liquefied Natural Gas Bunkering Market Revenue (Million), by End User 2025 & 2033
- Figure 12: Europe Liquefied Natural Gas Bunkering Market Volume (K Unit), by End User 2025 & 2033
- Figure 13: Europe Liquefied Natural Gas Bunkering Market Revenue Share (%), by End User 2025 & 2033
- Figure 14: Europe Liquefied Natural Gas Bunkering Market Volume Share (%), by End User 2025 & 2033
- Figure 15: Europe Liquefied Natural Gas Bunkering Market Revenue (Million), by Country 2025 & 2033
- Figure 16: Europe Liquefied Natural Gas Bunkering Market Volume (K Unit), by Country 2025 & 2033
- Figure 17: Europe Liquefied Natural Gas Bunkering Market Revenue Share (%), by Country 2025 & 2033
- Figure 18: Europe Liquefied Natural Gas Bunkering Market Volume Share (%), by Country 2025 & 2033
- Figure 19: Asia Pacific Liquefied Natural Gas Bunkering Market Revenue (Million), by End User 2025 & 2033
- Figure 20: Asia Pacific Liquefied Natural Gas Bunkering Market Volume (K Unit), by End User 2025 & 2033
- Figure 21: Asia Pacific Liquefied Natural Gas Bunkering Market Revenue Share (%), by End User 2025 & 2033
- Figure 22: Asia Pacific Liquefied Natural Gas Bunkering Market Volume Share (%), by End User 2025 & 2033
- Figure 23: Asia Pacific Liquefied Natural Gas Bunkering Market Revenue (Million), by Country 2025 & 2033
- Figure 24: Asia Pacific Liquefied Natural Gas Bunkering Market Volume (K Unit), by Country 2025 & 2033
- Figure 25: Asia Pacific Liquefied Natural Gas Bunkering Market Revenue Share (%), by Country 2025 & 2033
- Figure 26: Asia Pacific Liquefied Natural Gas Bunkering Market Volume Share (%), by Country 2025 & 2033
- Figure 27: Middle East and Africa Liquefied Natural Gas Bunkering Market Revenue (Million), by End User 2025 & 2033
- Figure 28: Middle East and Africa Liquefied Natural Gas Bunkering Market Volume (K Unit), by End User 2025 & 2033
- Figure 29: Middle East and Africa Liquefied Natural Gas Bunkering Market Revenue Share (%), by End User 2025 & 2033
- Figure 30: Middle East and Africa Liquefied Natural Gas Bunkering Market Volume Share (%), by End User 2025 & 2033
- Figure 31: Middle East and Africa Liquefied Natural Gas Bunkering Market Revenue (Million), by Country 2025 & 2033
- Figure 32: Middle East and Africa Liquefied Natural Gas Bunkering Market Volume (K Unit), by Country 2025 & 2033
- Figure 33: Middle East and Africa Liquefied Natural Gas Bunkering Market Revenue Share (%), by Country 2025 & 2033
- Figure 34: Middle East and Africa Liquefied Natural Gas Bunkering Market Volume Share (%), by Country 2025 & 2033
- Figure 35: South America Liquefied Natural Gas Bunkering Market Revenue (Million), by End User 2025 & 2033
- Figure 36: South America Liquefied Natural Gas Bunkering Market Volume (K Unit), by End User 2025 & 2033
- Figure 37: South America Liquefied Natural Gas Bunkering Market Revenue Share (%), by End User 2025 & 2033
- Figure 38: South America Liquefied Natural Gas Bunkering Market Volume Share (%), by End User 2025 & 2033
- Figure 39: South America Liquefied Natural Gas Bunkering Market Revenue (Million), by Country 2025 & 2033
- Figure 40: South America Liquefied Natural Gas Bunkering Market Volume (K Unit), by Country 2025 & 2033
- Figure 41: South America Liquefied Natural Gas Bunkering Market Revenue Share (%), by Country 2025 & 2033
- Figure 42: South America Liquefied Natural Gas Bunkering Market Volume Share (%), by Country 2025 & 2033
List of Tables
- Table 1: Global Liquefied Natural Gas Bunkering Market Revenue Million Forecast, by End User 2020 & 2033
- Table 2: Global Liquefied Natural Gas Bunkering Market Volume K Unit Forecast, by End User 2020 & 2033
- Table 3: Global Liquefied Natural Gas Bunkering Market Revenue Million Forecast, by Region 2020 & 2033
- Table 4: Global Liquefied Natural Gas Bunkering Market Volume K Unit Forecast, by Region 2020 & 2033
- Table 5: Global Liquefied Natural Gas Bunkering Market Revenue Million Forecast, by End User 2020 & 2033
- Table 6: Global Liquefied Natural Gas Bunkering Market Volume K Unit Forecast, by End User 2020 & 2033
- Table 7: Global Liquefied Natural Gas Bunkering Market Revenue Million Forecast, by Country 2020 & 2033
- Table 8: Global Liquefied Natural Gas Bunkering Market Volume K Unit Forecast, by Country 2020 & 2033
- Table 9: Global Liquefied Natural Gas Bunkering Market Revenue Million Forecast, by End User 2020 & 2033
- Table 10: Global Liquefied Natural Gas Bunkering Market Volume K Unit Forecast, by End User 2020 & 2033
- Table 11: Global Liquefied Natural Gas Bunkering Market Revenue Million Forecast, by Country 2020 & 2033
- Table 12: Global Liquefied Natural Gas Bunkering Market Volume K Unit Forecast, by Country 2020 & 2033
- Table 13: Global Liquefied Natural Gas Bunkering Market Revenue Million Forecast, by End User 2020 & 2033
- Table 14: Global Liquefied Natural Gas Bunkering Market Volume K Unit Forecast, by End User 2020 & 2033
- Table 15: Global Liquefied Natural Gas Bunkering Market Revenue Million Forecast, by Country 2020 & 2033
- Table 16: Global Liquefied Natural Gas Bunkering Market Volume K Unit Forecast, by Country 2020 & 2033
- Table 17: Global Liquefied Natural Gas Bunkering Market Revenue Million Forecast, by End User 2020 & 2033
- Table 18: Global Liquefied Natural Gas Bunkering Market Volume K Unit Forecast, by End User 2020 & 2033
- Table 19: Global Liquefied Natural Gas Bunkering Market Revenue Million Forecast, by Country 2020 & 2033
- Table 20: Global Liquefied Natural Gas Bunkering Market Volume K Unit Forecast, by Country 2020 & 2033
- Table 21: Global Liquefied Natural Gas Bunkering Market Revenue Million Forecast, by End User 2020 & 2033
- Table 22: Global Liquefied Natural Gas Bunkering Market Volume K Unit Forecast, by End User 2020 & 2033
- Table 23: Global Liquefied Natural Gas Bunkering Market Revenue Million Forecast, by Country 2020 & 2033
- Table 24: Global Liquefied Natural Gas Bunkering Market Volume K Unit Forecast, by Country 2020 & 2033
Frequently Asked Questions
1. What is the projected Compound Annual Growth Rate (CAGR) of the Liquefied Natural Gas Bunkering Market?
The projected CAGR is approximately 30.20%.
2. Which companies are prominent players in the Liquefied Natural Gas Bunkering Market?
Key companies in the market include Shell PLC, Harvey Gulf International Marine LLC, Engie SA, Korea Gas Corporation, Gazprom Neft PJSC, ENN Energy Holdings Ltd, Gasum Oy, Naturgy Energy Group SA, TotalEnergies SE.
3. What are the main segments of the Liquefied Natural Gas Bunkering Market?
The market segments include End User.
4. Can you provide details about the market size?
The market size is estimated to be USD 1.26 Million as of 2022.
5. What are some drivers contributing to market growth?
4.; Modernization and Upgrades of Existing Military Aircraft Fleets4.; Increasing Defense Budgets.
6. What are the notable trends driving market growth?
Tanker Fleet to Witness Significant Growth.
7. Are there any restraints impacting market growth?
4.; Shift Toward Unmanned Aircraft.
8. Can you provide examples of recent developments in the market?
In January 2022, CMA CGM signed a ten-year contract with Shanghai International Port Group to use LNG as a bunker fuel in the Yangshan port area. CMA CGM's dual-fuelled 15,000 TEU box ships on the Pearl River Express route from China to Los Angeles will bunker in the Yangshan area.
9. What pricing options are available for accessing the report?
Pricing options include single-user, multi-user, and enterprise licenses priced at USD 4750, USD 5250, and USD 8750 respectively.
10. Is the market size provided in terms of value or volume?
The market size is provided in terms of value, measured in Million and volume, measured in K Unit.
11. Are there any specific market keywords associated with the report?
Yes, the market keyword associated with the report is "Liquefied Natural Gas Bunkering Market," which aids in identifying and referencing the specific market segment covered.
12. How do I determine which pricing option suits my needs best?
The pricing options vary based on user requirements and access needs. Individual users may opt for single-user licenses, while businesses requiring broader access may choose multi-user or enterprise licenses for cost-effective access to the report.
13. Are there any additional resources or data provided in the Liquefied Natural Gas Bunkering Market report?
While the report offers comprehensive insights, it's advisable to review the specific contents or supplementary materials provided to ascertain if additional resources or data are available.
14. How can I stay updated on further developments or reports in the Liquefied Natural Gas Bunkering Market?
To stay informed about further developments, trends, and reports in the Liquefied Natural Gas Bunkering Market, consider subscribing to industry newsletters, following relevant companies and organizations, or regularly checking reputable industry news sources and publications.
Methodology
Step 1 - Identification of Relevant Samples Size from Population Database


Step 2 - Approaches for Defining Global Market Size (Value, Volume* & Price*)

Note*: In applicable scenarios
Step 3 - Data Sources
Primary Research
- Web Analytics
- Survey Reports
- Research Institute
- Latest Research Reports
- Opinion Leaders
Secondary Research
- Annual Reports
- White Paper
- Latest Press Release
- Industry Association
- Paid Database
- Investor Presentations

Step 4 - Data Triangulation
Involves using different sources of information in order to increase the validity of a study
These sources are likely to be stakeholders in a program - participants, other researchers, program staff, other community members, and so on.
Then we put all data in single framework & apply various statistical tools to find out the dynamic on the market.
During the analysis stage, feedback from the stakeholder groups would be compared to determine areas of agreement as well as areas of divergence