

Key Insights
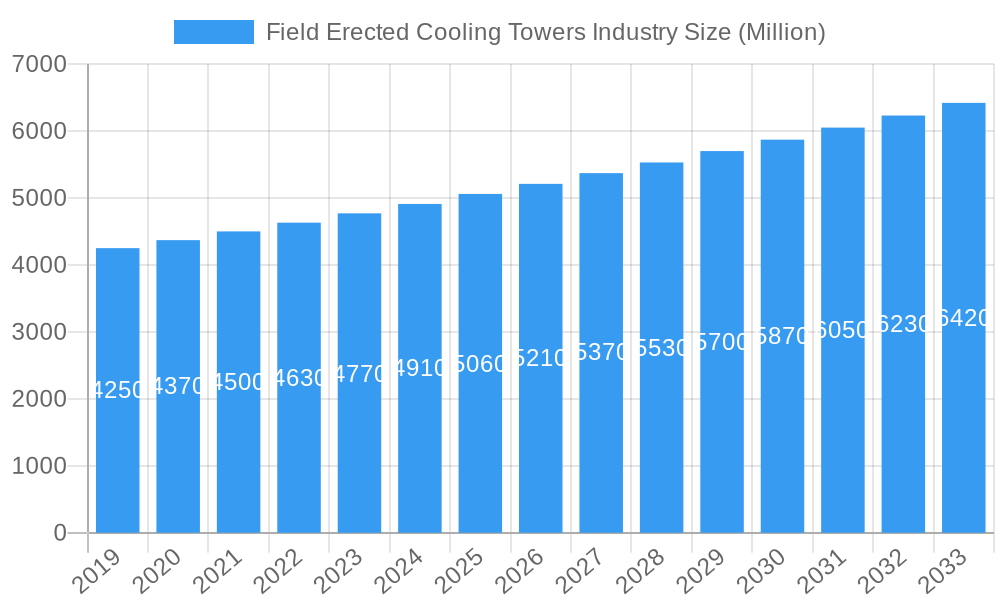
The global Field Erected Cooling Towers market is projected for significant growth, driven by increasing demand for advanced thermal management solutions in core industrial sectors. The market, valued at approximately USD 2.93 billion in the base year of 2025, is anticipated to expand at a Compound Annual Growth Rate (CAGR) of 5.65% through 2033. This expansion is directly linked to rising energy consumption in power generation, petrochemicals, and oil & gas industries, which depend on cooling towers for operational efficiency and regulatory adherence. Infrastructure development and the modernization of industrial facilities to incorporate energy-efficient cooling technologies are key growth catalysts. Furthermore, technological innovations focused on water conservation, reduced energy usage, and enhanced material longevity are crucial in driving market adoption.
Field Erected Cooling Towers Industry Market Size (In Billion)
Market segmentation highlights a diverse landscape with varying preferences for cooling tower types and designs. While wet cooling towers remain dominant due to their cost-effectiveness and heat rejection capabilities, dry and hybrid cooling towers are gaining prominence, especially in regions facing water scarcity or requiring plume mitigation. Induced draft towers are the most common design, offering a balance of performance and operational flexibility. The primary end-user sectors—power generation, petrochemicals, and oil & gas—account for the largest market share due to their continuous, high-volume heat rejection needs. Emerging applications in other industries, spurred by evolving environmental standards and process optimization, are contributing to market diversification. Geographically, North America and Europe represent mature markets with substantial installed capacities and ongoing upgrades. The Asia Pacific region is identified as a high-growth area, fueled by rapid industrialization and escalating energy demands.
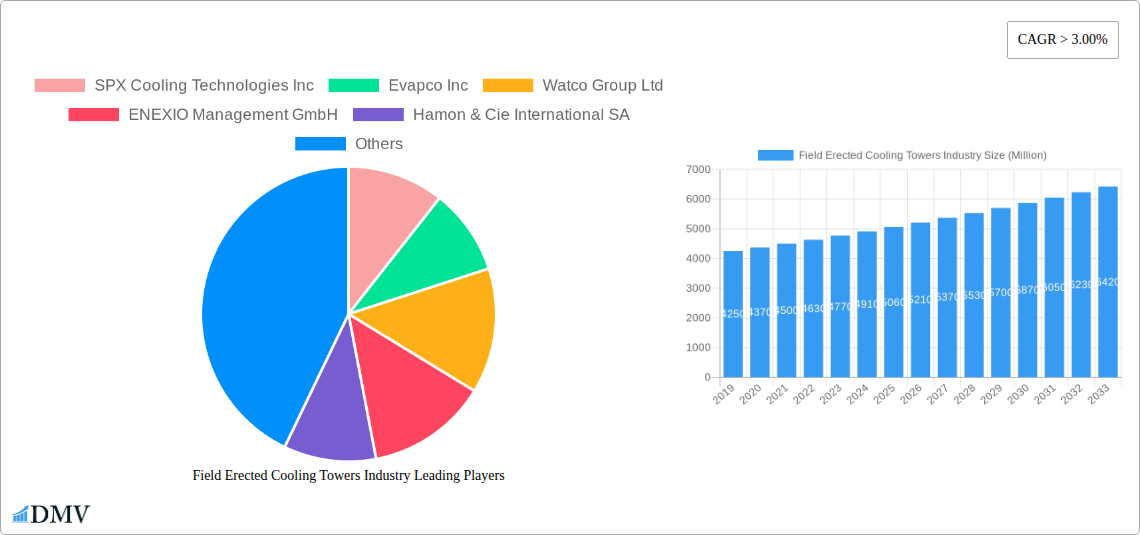
Field Erected Cooling Towers Industry Company Market Share
Field Erected Cooling Towers Industry Market Composition & Trends
The global Field Erected Cooling Towers industry is characterized by a moderate to high level of market concentration, with a few dominant players holding significant market share. This dynamic is fueled by substantial capital investments required for manufacturing and installation, alongside stringent quality and safety regulations. Innovation is a key differentiator, with companies continuously investing in R&D to enhance efficiency, reduce environmental impact, and improve operational lifespan. Regulatory landscapes are evolving, pushing for more sustainable and energy-efficient cooling solutions, impacting product design and material selection. Substitute products, such as alternative cooling methods or more localized cooling units, pose a competitive threat, necessitating ongoing differentiation. End-user profiles span a diverse range of sectors, each with unique operational demands and thermal management needs. Mergers and acquisitions (M&A) activities are a significant trend, as larger entities seek to consolidate market presence, acquire innovative technologies, and expand their geographical reach. M&A deal values are projected to be in the hundreds of millions of dollars, reflecting the strategic importance of this sector.
- Market Share Distribution: Dominated by key players, with a fragmented segment for smaller, specialized providers.
- Innovation Catalysts: Growing demand for energy efficiency, environmental compliance, and advanced thermal management.
- Regulatory Landscapes: Increasingly stringent emission standards and water conservation mandates.
- Substitute Products: Localized cooling systems, advanced heat exchangers, and alternative process optimization techniques.
- End-User Profiles: Varied needs from the Power Generation sector's high-capacity requirements to the Petrochemicals and Oil & Gas industries' complex process demands.
- M&A Activities: Strategic acquisitions and consolidations to gain market share and technological expertise.
Field Erected Cooling Towers Industry Industry Evolution
The Field Erected Cooling Towers industry has witnessed a significant evolutionary trajectory driven by relentless technological advancements, escalating demand from a burgeoning industrial landscape, and an increasing global awareness of environmental sustainability. From their nascent stages of basic functionality, these towers have transformed into sophisticated, highly engineered systems crucial for various industrial processes. The historical period from 2019 to 2024 laid the groundwork for current market dynamics, characterized by steady growth in key end-user industries such as power generation and petrochemicals, which require substantial thermal management. During this phase, companies focused on incremental improvements in efficiency and reliability.
The base year, 2025, marks a pivotal point where the market is poised for accelerated expansion. This growth is propelled by the integration of smart technologies, predictive maintenance capabilities, and the adoption of advanced materials that enhance durability and reduce water consumption. For instance, the adoption of advanced materials like corrosion-resistant composites has seen a growth rate of approximately 8-10% annually in specialized applications. The forecast period, 2025–2033, is anticipated to be a golden era for field erected cooling towers, with an estimated Compound Annual Growth Rate (CAGR) of 5-7%. This surge is attributed to several interconnected factors.
Firstly, the escalating global energy demand, particularly from developing economies, necessitates increased output from power plants, which in turn drives the demand for robust cooling solutions. The power generation segment alone accounts for an estimated 40-45% of the market in terms of volume and value. Secondly, the petrochemical and oil & gas sectors are undergoing significant expansion, especially with the growing emphasis on refining and processing crude oil and natural gas into higher-value products. These industries are inherently intensive in their thermal management needs, making field erected cooling towers indispensable. The market for these towers within the oil & gas sector is projected to grow at a CAGR of 6-8% during the forecast period.
Technological advancements are at the forefront of this evolution. The introduction of hybrid cooling towers, which offer the advantages of both wet and dry cooling, is a prime example of innovation catering to diverse environmental and operational requirements. These hybrid systems are gaining traction due to their ability to reduce water usage and operate efficiently in varying climatic conditions. Furthermore, the integration of Internet of Things (IoT) sensors and advanced analytics allows for real-time monitoring, performance optimization, and proactive maintenance, significantly reducing downtime and operational costs. The adoption of these digital solutions is estimated to be increasing at a rate of over 15% annually.
Shifting consumer demands, particularly from environmental regulatory bodies and the public, are also a significant driver. There is a palpable move towards solutions that minimize water discharge, reduce energy consumption, and have a lower carbon footprint. This has led to the development and widespread adoption of closed-loop systems and advanced water treatment technologies within cooling tower operations. The increasing focus on sustainability and corporate social responsibility is pushing industries to invest in the most efficient and environmentally friendly cooling solutions available, solidifying the market position of field erected cooling towers designed with these principles in mind.
Leading Regions, Countries, or Segments in Field Erected Cooling Towers Industry
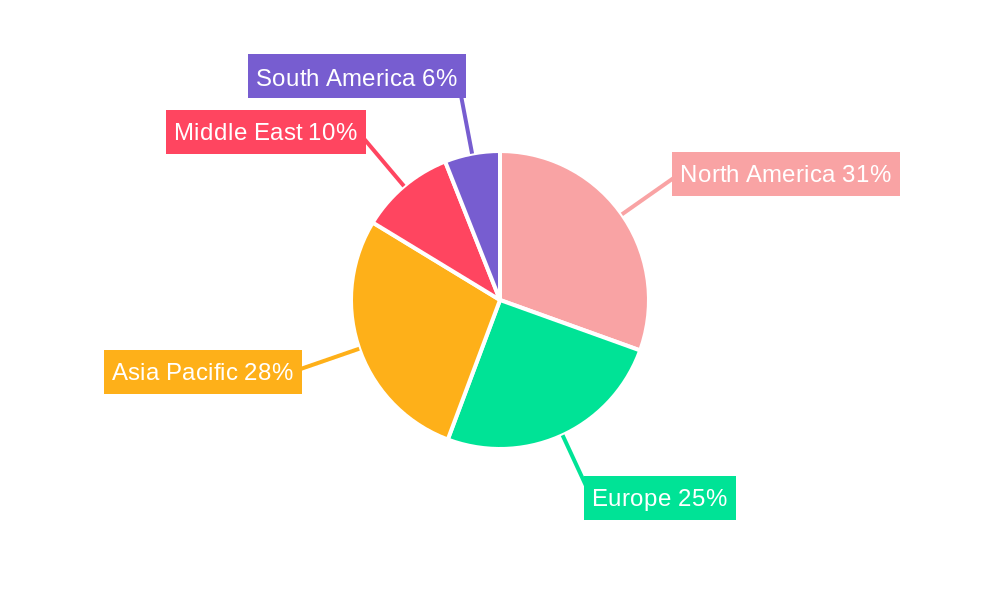
The Field Erected Cooling Towers industry exhibits a pronounced dominance in specific regions and segments, driven by a confluence of industrial growth, regulatory frameworks, and investment trends. North America, particularly the United States, consistently emerges as a leading region, primarily due to its mature industrial base, extensive presence of power generation facilities, and significant activity within the oil and gas sectors. The region's strong emphasis on infrastructure development and ongoing upgrades to existing industrial plants further bolster demand. Countries like Germany and the UK in Europe also represent substantial markets, propelled by stringent environmental regulations that necessitate advanced and efficient cooling solutions.
In Asia Pacific, the market is experiencing the most rapid growth, fueled by burgeoning economies, rapid industrialization, and substantial investments in power generation, petrochemicals, and manufacturing. China and India, with their massive populations and expanding industrial capacities, are pivotal growth engines for the region. The Middle East, with its vast oil and gas reserves and significant investments in downstream processing, also presents a substantial and growing market.
Analyzing by Type, Wet cooling towers are currently the dominant segment. This is largely due to their high efficiency in heat rejection and relatively lower initial cost compared to other types, making them a preferred choice for many large-scale industrial applications, especially in regions with abundant water resources. The global market share for wet cooling towers is estimated to be around 60-65%.
- Wet Cooling Towers: Dominant due to high thermal efficiency and cost-effectiveness for large-scale operations.
- Dry Cooling Towers: Growing in demand due to water scarcity concerns, especially in arid regions, and their ability to operate without water.
- Hybrid Cooling Towers: Emerging as a significant segment, offering a balance between water usage and thermal performance, catering to a wider range of environmental conditions.
By Design, Induced draft and Forced draft cooling towers are the most prevalent. Induced draft towers, with their fans positioned at the top, are favored for their energy efficiency and ability to handle large airflow volumes, making them ideal for power generation and heavy industries. Forced draft towers, with fans at the air inlet, are often chosen for their compact footprint and suitability for applications where noise is a concern or where space is limited. Natural draft towers, while less common in new installations due to their significant civil engineering requirements and land footprint, remain critical in very large power plants where their passive operation is advantageous.
- Induced Draft: Leading design due to energy efficiency and high airflow capacity, suitable for large industrial needs.
- Forced Draft: Preferred for its compact design and suitability for specific applications where noise or space constraints are critical.
- Natural Draft: Historically significant in very large power plants, but less common in new installations due to infrastructure demands.
In terms of End User, Power Generation consistently represents the largest and most significant segment. The immense thermal loads generated by power plants, whether conventional thermal, nuclear, or renewable sources requiring supplementary cooling, make them a primary consumer of field erected cooling towers. The sheer scale of operations in this sector necessitates robust and highly efficient cooling solutions.
- Power Generation: The largest end-user segment, requiring massive cooling capacities for electricity production.
- Petrochemicals: Second largest segment, with complex processes demanding precise temperature control and high heat rejection rates.
- Oil & Gas: Significant demand driven by refining, extraction, and processing operations.
- Other End Users: Includes sectors like HVAC for large commercial buildings, manufacturing, chemical processing, and food & beverage industries.
The dominance of these segments is underpinned by specific drivers: the continuous need for reliable power supply worldwide, the global demand for refined petroleum products and petrochemicals, and the ongoing industrialization in emerging economies. Regulatory support for energy efficiency and environmental protection also plays a crucial role in segment selection, pushing for more advanced and sustainable cooling technologies.
Field Erected Cooling Towers Industry Product Innovations
Product innovations in the Field Erected Cooling Towers industry are increasingly focused on enhancing energy efficiency, reducing water consumption, and improving operational lifespan. Manufacturers are developing advanced fill materials that maximize heat transfer surface area while minimizing airflow resistance, leading to lower fan power consumption. Smart monitoring systems, incorporating IoT sensors and predictive analytics, are being integrated to optimize performance in real-time, anticipate maintenance needs, and prevent costly downtime. Furthermore, there's a growing emphasis on modular designs for faster installation and greater flexibility, as well as the use of advanced composite materials that offer superior corrosion resistance and structural integrity, especially in harsh industrial environments. These innovations not only improve the environmental footprint but also provide significant operational cost savings for end-users.
Propelling Factors for Field Erected Cooling Towers Industry Growth
Several key factors are propelling the growth of the Field Erected Cooling Towers industry. The ever-increasing global demand for energy, particularly from developing nations, necessitates the expansion and modernization of power generation facilities, which are major consumers of cooling towers. Simultaneously, the robust growth in the petrochemical and oil & gas sectors, driven by the need for refined products and energy resources, further fuels demand. Environmental regulations are also playing a crucial role; stricter mandates on water conservation and emissions reduction are pushing industries towards more efficient and sustainable cooling solutions, such as hybrid and closed-loop systems. Technological advancements, including the integration of smart technologies for enhanced efficiency and predictive maintenance, are making these towers more attractive and cost-effective over their lifecycle.
Obstacles in the Field Erected Cooling Towers Industry Market
Despite robust growth prospects, the Field Erected Cooling Towers industry faces several obstacles. High initial capital investment for the design, manufacturing, and installation of these large-scale systems can be a significant barrier for smaller companies or those in rapidly developing regions. Stringent and evolving environmental regulations, while a driver for innovation, can also increase compliance costs and complexity. Fluctuations in raw material prices, particularly for steel and specialized plastics, can impact manufacturing costs and profit margins. Furthermore, the availability of skilled labor for installation and maintenance can be a constraint in certain geographical areas. Competition from alternative cooling technologies and a growing awareness of water scarcity in some regions can also pose challenges, necessitating continuous innovation to maintain market share.
Future Opportunities in Field Erected Cooling Towers Industry
Emerging opportunities in the Field Erected Cooling Towers industry are primarily driven by the global push for sustainability and technological advancement. The increasing adoption of renewable energy sources, such as concentrated solar power (CSP) and geothermal energy, which often require efficient thermal management, presents a new avenue for growth. The development and widespread implementation of advanced water-saving technologies, including enhanced drift eliminators and optimized water treatment systems, will cater to regions facing water scarcity. Furthermore, the integration of artificial intelligence (AI) and machine learning for predictive maintenance and performance optimization of cooling towers offers significant potential for enhanced operational efficiency and reduced lifecycle costs. The growing demand for retrofitting and upgrading existing cooling infrastructure in aging industrial plants also presents a substantial market opportunity.
Major Players in the Field Erected Cooling Towers Industry Ecosystem
- SPX Cooling Technologies Inc
- Evapco Inc
- Watco Group Ltd
- ENEXIO Management GmbH
- Hamon & Cie International SA
- Towertech Cooling System Pvt Ltd
- Paharpur Cooling Towers Ltd
- Cyrco Inc
- Babcock & Wilcox Enterprises Inc
- Marley Flow Control Pty Ltd
Key Developments in Field Erected Cooling Towers Industry Industry
- February 2020: SPX Cooling Technologies Inc. launched its new Marley MH Element Fluid Cooler, an induced-draft, crossflow closed-circuit cooling tower suitable for heating, ventilation, air conditioning (HVAC), industrial, and process cooling applications, enhancing its product portfolio with advanced closed-circuit technology.
- December 2021: Specialty Welding and Turnarounds, LLC (SWAT) announced the acquisition of Midwest Cooling Tower Services (MWCTS) from Dorilton Capital. This strategic move by SWAT, a provider of technical maintenance services, signifies consolidation in the aftermarket services sector, aiming to expand critical cooling tower solutions, including inspection, maintenance, repair, distribution, and rental across the United States.
Strategic Field Erected Cooling Towers Industry Market Forecast
The strategic forecast for the Field Erected Cooling Towers industry indicates robust and sustained growth throughout the 2025–2033 period, driven by escalating global industrial output and a strong emphasis on energy efficiency and environmental stewardship. Key growth catalysts include the continuous expansion of the power generation sector, especially in emerging economies, and the ongoing demand from the petrochemical and oil & gas industries for reliable thermal management solutions. The increasing adoption of advanced technologies, such as hybrid cooling systems and smart monitoring capabilities, will further propel market penetration by offering superior operational efficiency and reduced environmental impact. Regulatory drivers favoring water conservation and energy savings will continue to incentivize investments in modern, high-performance cooling towers, solidifying the market's potential.
Field Erected Cooling Towers Industry Segmentation
-
1. Type
- 1.1. Wet
- 1.2. Dry
- 1.3. Hybrid
-
2. Design
- 2.1. Natural
- 2.2. Induced
- 2.3. Forced
-
3. End User
- 3.1. Power Generation
- 3.2. Petrochemicals
- 3.3. Oil & Gas
- 3.4. Other End Users
Field Erected Cooling Towers Industry Segmentation By Geography
- 1. North America
- 2. Europe
- 3. Asia Pacific
- 4. Middle East
- 5. South America
Field Erected Cooling Towers Industry Regional Market Share
Geographic Coverage of Field Erected Cooling Towers Industry
Field Erected Cooling Towers Industry REPORT HIGHLIGHTS
| Aspects | Details |
|---|---|
| Study Period | 2020-2034 |
| Base Year | 2025 |
| Estimated Year | 2026 |
| Forecast Period | 2026-2034 |
| Historical Period | 2020-2025 |
| Growth Rate | CAGR of 5.65% from 2020-2034 |
| Segmentation |
|
Table of Contents
- 1. Introduction
- 1.1. Research Scope
- 1.2. Market Segmentation
- 1.3. Research Objective
- 1.4. Definitions and Assumptions
- 2. Executive Summary
- 2.1. Market Snapshot
- 3. Market Dynamics
- 3.1. Market Drivers
- 3.2. Market Restrains
- 3.3. Market Trends
- 3.4. Market Opportunities
- 4. Market Factor Analysis
- 4.1. Porters Five Forces
- 4.1.1. Bargaining Power of Suppliers
- 4.1.2. Bargaining Power of Buyers
- 4.1.3. Threat of New Entrants
- 4.1.4. Threat of Substitutes
- 4.1.5. Competitive Rivalry
- 4.2. PESTEL analysis
- 4.3. BCG Analysis
- 4.3.1. Stars (High Growth, High Market Share)
- 4.3.2. Cash Cows (Low Growth, High Market Share)
- 4.3.3. Question Mark (High Growth, Low Market Share)
- 4.3.4. Dogs (Low Growth, Low Market Share)
- 4.4. Ansoff Matrix Analysis
- 4.5. Supply Chain Analysis
- 4.6. Regulatory Landscape
- 4.7. Current Market Potential and Opportunity Assessment (TAM–SAM–SOM Framework)
- 4.8. DMV Analyst Note
- 4.1. Porters Five Forces
- 5. Market Analysis, Insights and Forecast 2021-2033
- 5.1. Market Analysis, Insights and Forecast - by Type
- 5.1.1. Wet
- 5.1.2. Dry
- 5.1.3. Hybrid
- 5.2. Market Analysis, Insights and Forecast - by Design
- 5.2.1. Natural
- 5.2.2. Induced
- 5.2.3. Forced
- 5.3. Market Analysis, Insights and Forecast - by End User
- 5.3.1. Power Generation
- 5.3.2. Petrochemicals
- 5.3.3. Oil & Gas
- 5.3.4. Other End Users
- 5.4. Market Analysis, Insights and Forecast - by Region
- 5.4.1. North America
- 5.4.2. Europe
- 5.4.3. Asia Pacific
- 5.4.4. Middle East
- 5.4.5. South America
- 5.1. Market Analysis, Insights and Forecast - by Type
- 6. Global Field Erected Cooling Towers Industry Analysis, Insights and Forecast, 2021-2033
- 6.1. Market Analysis, Insights and Forecast - by Type
- 6.1.1. Wet
- 6.1.2. Dry
- 6.1.3. Hybrid
- 6.2. Market Analysis, Insights and Forecast - by Design
- 6.2.1. Natural
- 6.2.2. Induced
- 6.2.3. Forced
- 6.3. Market Analysis, Insights and Forecast - by End User
- 6.3.1. Power Generation
- 6.3.2. Petrochemicals
- 6.3.3. Oil & Gas
- 6.3.4. Other End Users
- 6.1. Market Analysis, Insights and Forecast - by Type
- 7. North America Field Erected Cooling Towers Industry Analysis, Insights and Forecast, 2020-2032
- 7.1. Market Analysis, Insights and Forecast - by Type
- 7.1.1. Wet
- 7.1.2. Dry
- 7.1.3. Hybrid
- 7.2. Market Analysis, Insights and Forecast - by Design
- 7.2.1. Natural
- 7.2.2. Induced
- 7.2.3. Forced
- 7.3. Market Analysis, Insights and Forecast - by End User
- 7.3.1. Power Generation
- 7.3.2. Petrochemicals
- 7.3.3. Oil & Gas
- 7.3.4. Other End Users
- 7.1. Market Analysis, Insights and Forecast - by Type
- 8. Europe Field Erected Cooling Towers Industry Analysis, Insights and Forecast, 2020-2032
- 8.1. Market Analysis, Insights and Forecast - by Type
- 8.1.1. Wet
- 8.1.2. Dry
- 8.1.3. Hybrid
- 8.2. Market Analysis, Insights and Forecast - by Design
- 8.2.1. Natural
- 8.2.2. Induced
- 8.2.3. Forced
- 8.3. Market Analysis, Insights and Forecast - by End User
- 8.3.1. Power Generation
- 8.3.2. Petrochemicals
- 8.3.3. Oil & Gas
- 8.3.4. Other End Users
- 8.1. Market Analysis, Insights and Forecast - by Type
- 9. Asia Pacific Field Erected Cooling Towers Industry Analysis, Insights and Forecast, 2020-2032
- 9.1. Market Analysis, Insights and Forecast - by Type
- 9.1.1. Wet
- 9.1.2. Dry
- 9.1.3. Hybrid
- 9.2. Market Analysis, Insights and Forecast - by Design
- 9.2.1. Natural
- 9.2.2. Induced
- 9.2.3. Forced
- 9.3. Market Analysis, Insights and Forecast - by End User
- 9.3.1. Power Generation
- 9.3.2. Petrochemicals
- 9.3.3. Oil & Gas
- 9.3.4. Other End Users
- 9.1. Market Analysis, Insights and Forecast - by Type
- 10. Middle East Field Erected Cooling Towers Industry Analysis, Insights and Forecast, 2020-2032
- 10.1. Market Analysis, Insights and Forecast - by Type
- 10.1.1. Wet
- 10.1.2. Dry
- 10.1.3. Hybrid
- 10.2. Market Analysis, Insights and Forecast - by Design
- 10.2.1. Natural
- 10.2.2. Induced
- 10.2.3. Forced
- 10.3. Market Analysis, Insights and Forecast - by End User
- 10.3.1. Power Generation
- 10.3.2. Petrochemicals
- 10.3.3. Oil & Gas
- 10.3.4. Other End Users
- 10.1. Market Analysis, Insights and Forecast - by Type
- 11. South America Field Erected Cooling Towers Industry Analysis, Insights and Forecast, 2020-2032
- 11.1. Market Analysis, Insights and Forecast - by Type
- 11.1.1. Wet
- 11.1.2. Dry
- 11.1.3. Hybrid
- 11.2. Market Analysis, Insights and Forecast - by Design
- 11.2.1. Natural
- 11.2.2. Induced
- 11.2.3. Forced
- 11.3. Market Analysis, Insights and Forecast - by End User
- 11.3.1. Power Generation
- 11.3.2. Petrochemicals
- 11.3.3. Oil & Gas
- 11.3.4. Other End Users
- 11.1. Market Analysis, Insights and Forecast - by Type
- 12. Competitive Analysis
- 12.1. Company Profiles
- 12.1.1 SPX Cooling Technologies Inc
- 12.1.1.1. Company Overview
- 12.1.1.2. Products
- 12.1.1.3. Company Financials
- 12.1.1.4. SWOT Analysis
- 12.1.2 Evapco Inc
- 12.1.2.1. Company Overview
- 12.1.2.2. Products
- 12.1.2.3. Company Financials
- 12.1.2.4. SWOT Analysis
- 12.1.3 Watco Group Ltd
- 12.1.3.1. Company Overview
- 12.1.3.2. Products
- 12.1.3.3. Company Financials
- 12.1.3.4. SWOT Analysis
- 12.1.4 ENEXIO Management GmbH
- 12.1.4.1. Company Overview
- 12.1.4.2. Products
- 12.1.4.3. Company Financials
- 12.1.4.4. SWOT Analysis
- 12.1.5 Hamon & Cie International SA
- 12.1.5.1. Company Overview
- 12.1.5.2. Products
- 12.1.5.3. Company Financials
- 12.1.5.4. SWOT Analysis
- 12.1.6 Towertech Cooling System Pvt Ltd
- 12.1.6.1. Company Overview
- 12.1.6.2. Products
- 12.1.6.3. Company Financials
- 12.1.6.4. SWOT Analysis
- 12.1.7 Paharpur Cooling Towers Ltd
- 12.1.7.1. Company Overview
- 12.1.7.2. Products
- 12.1.7.3. Company Financials
- 12.1.7.4. SWOT Analysis
- 12.1.8 Cyrco Inc
- 12.1.8.1. Company Overview
- 12.1.8.2. Products
- 12.1.8.3. Company Financials
- 12.1.8.4. SWOT Analysis
- 12.1.9 Babcock & Wilcox Enterprises Inc
- 12.1.9.1. Company Overview
- 12.1.9.2. Products
- 12.1.9.3. Company Financials
- 12.1.9.4. SWOT Analysis
- 12.1.10 Marley Flow Control Pty Ltd*List Not Exhaustive
- 12.1.10.1. Company Overview
- 12.1.10.2. Products
- 12.1.10.3. Company Financials
- 12.1.10.4. SWOT Analysis
- 12.1.1 SPX Cooling Technologies Inc
- 12.2. Market Entropy
- 12.2.1 Company's Key Areas Served
- 12.2.2 Recent Developments
- 12.3. Company Market Share Analysis 2025
- 12.3.1 Top 5 Companies Market Share Analysis
- 12.3.2 Top 3 Companies Market Share Analysis
- 12.4. List of Potential Customers
- 13. Research Methodology
List of Figures
- Figure 1: Global Field Erected Cooling Towers Industry Revenue Breakdown (billion, %) by Region 2025 & 2033
- Figure 2: Global Field Erected Cooling Towers Industry Volume Breakdown (Gigawatt, %) by Region 2025 & 2033
- Figure 3: North America Field Erected Cooling Towers Industry Revenue (billion), by Type 2025 & 2033
- Figure 4: North America Field Erected Cooling Towers Industry Volume (Gigawatt), by Type 2025 & 2033
- Figure 5: North America Field Erected Cooling Towers Industry Revenue Share (%), by Type 2025 & 2033
- Figure 6: North America Field Erected Cooling Towers Industry Volume Share (%), by Type 2025 & 2033
- Figure 7: North America Field Erected Cooling Towers Industry Revenue (billion), by Design 2025 & 2033
- Figure 8: North America Field Erected Cooling Towers Industry Volume (Gigawatt), by Design 2025 & 2033
- Figure 9: North America Field Erected Cooling Towers Industry Revenue Share (%), by Design 2025 & 2033
- Figure 10: North America Field Erected Cooling Towers Industry Volume Share (%), by Design 2025 & 2033
- Figure 11: North America Field Erected Cooling Towers Industry Revenue (billion), by End User 2025 & 2033
- Figure 12: North America Field Erected Cooling Towers Industry Volume (Gigawatt), by End User 2025 & 2033
- Figure 13: North America Field Erected Cooling Towers Industry Revenue Share (%), by End User 2025 & 2033
- Figure 14: North America Field Erected Cooling Towers Industry Volume Share (%), by End User 2025 & 2033
- Figure 15: North America Field Erected Cooling Towers Industry Revenue (billion), by Country 2025 & 2033
- Figure 16: North America Field Erected Cooling Towers Industry Volume (Gigawatt), by Country 2025 & 2033
- Figure 17: North America Field Erected Cooling Towers Industry Revenue Share (%), by Country 2025 & 2033
- Figure 18: North America Field Erected Cooling Towers Industry Volume Share (%), by Country 2025 & 2033
- Figure 19: Europe Field Erected Cooling Towers Industry Revenue (billion), by Type 2025 & 2033
- Figure 20: Europe Field Erected Cooling Towers Industry Volume (Gigawatt), by Type 2025 & 2033
- Figure 21: Europe Field Erected Cooling Towers Industry Revenue Share (%), by Type 2025 & 2033
- Figure 22: Europe Field Erected Cooling Towers Industry Volume Share (%), by Type 2025 & 2033
- Figure 23: Europe Field Erected Cooling Towers Industry Revenue (billion), by Design 2025 & 2033
- Figure 24: Europe Field Erected Cooling Towers Industry Volume (Gigawatt), by Design 2025 & 2033
- Figure 25: Europe Field Erected Cooling Towers Industry Revenue Share (%), by Design 2025 & 2033
- Figure 26: Europe Field Erected Cooling Towers Industry Volume Share (%), by Design 2025 & 2033
- Figure 27: Europe Field Erected Cooling Towers Industry Revenue (billion), by End User 2025 & 2033
- Figure 28: Europe Field Erected Cooling Towers Industry Volume (Gigawatt), by End User 2025 & 2033
- Figure 29: Europe Field Erected Cooling Towers Industry Revenue Share (%), by End User 2025 & 2033
- Figure 30: Europe Field Erected Cooling Towers Industry Volume Share (%), by End User 2025 & 2033
- Figure 31: Europe Field Erected Cooling Towers Industry Revenue (billion), by Country 2025 & 2033
- Figure 32: Europe Field Erected Cooling Towers Industry Volume (Gigawatt), by Country 2025 & 2033
- Figure 33: Europe Field Erected Cooling Towers Industry Revenue Share (%), by Country 2025 & 2033
- Figure 34: Europe Field Erected Cooling Towers Industry Volume Share (%), by Country 2025 & 2033
- Figure 35: Asia Pacific Field Erected Cooling Towers Industry Revenue (billion), by Type 2025 & 2033
- Figure 36: Asia Pacific Field Erected Cooling Towers Industry Volume (Gigawatt), by Type 2025 & 2033
- Figure 37: Asia Pacific Field Erected Cooling Towers Industry Revenue Share (%), by Type 2025 & 2033
- Figure 38: Asia Pacific Field Erected Cooling Towers Industry Volume Share (%), by Type 2025 & 2033
- Figure 39: Asia Pacific Field Erected Cooling Towers Industry Revenue (billion), by Design 2025 & 2033
- Figure 40: Asia Pacific Field Erected Cooling Towers Industry Volume (Gigawatt), by Design 2025 & 2033
- Figure 41: Asia Pacific Field Erected Cooling Towers Industry Revenue Share (%), by Design 2025 & 2033
- Figure 42: Asia Pacific Field Erected Cooling Towers Industry Volume Share (%), by Design 2025 & 2033
- Figure 43: Asia Pacific Field Erected Cooling Towers Industry Revenue (billion), by End User 2025 & 2033
- Figure 44: Asia Pacific Field Erected Cooling Towers Industry Volume (Gigawatt), by End User 2025 & 2033
- Figure 45: Asia Pacific Field Erected Cooling Towers Industry Revenue Share (%), by End User 2025 & 2033
- Figure 46: Asia Pacific Field Erected Cooling Towers Industry Volume Share (%), by End User 2025 & 2033
- Figure 47: Asia Pacific Field Erected Cooling Towers Industry Revenue (billion), by Country 2025 & 2033
- Figure 48: Asia Pacific Field Erected Cooling Towers Industry Volume (Gigawatt), by Country 2025 & 2033
- Figure 49: Asia Pacific Field Erected Cooling Towers Industry Revenue Share (%), by Country 2025 & 2033
- Figure 50: Asia Pacific Field Erected Cooling Towers Industry Volume Share (%), by Country 2025 & 2033
- Figure 51: Middle East Field Erected Cooling Towers Industry Revenue (billion), by Type 2025 & 2033
- Figure 52: Middle East Field Erected Cooling Towers Industry Volume (Gigawatt), by Type 2025 & 2033
- Figure 53: Middle East Field Erected Cooling Towers Industry Revenue Share (%), by Type 2025 & 2033
- Figure 54: Middle East Field Erected Cooling Towers Industry Volume Share (%), by Type 2025 & 2033
- Figure 55: Middle East Field Erected Cooling Towers Industry Revenue (billion), by Design 2025 & 2033
- Figure 56: Middle East Field Erected Cooling Towers Industry Volume (Gigawatt), by Design 2025 & 2033
- Figure 57: Middle East Field Erected Cooling Towers Industry Revenue Share (%), by Design 2025 & 2033
- Figure 58: Middle East Field Erected Cooling Towers Industry Volume Share (%), by Design 2025 & 2033
- Figure 59: Middle East Field Erected Cooling Towers Industry Revenue (billion), by End User 2025 & 2033
- Figure 60: Middle East Field Erected Cooling Towers Industry Volume (Gigawatt), by End User 2025 & 2033
- Figure 61: Middle East Field Erected Cooling Towers Industry Revenue Share (%), by End User 2025 & 2033
- Figure 62: Middle East Field Erected Cooling Towers Industry Volume Share (%), by End User 2025 & 2033
- Figure 63: Middle East Field Erected Cooling Towers Industry Revenue (billion), by Country 2025 & 2033
- Figure 64: Middle East Field Erected Cooling Towers Industry Volume (Gigawatt), by Country 2025 & 2033
- Figure 65: Middle East Field Erected Cooling Towers Industry Revenue Share (%), by Country 2025 & 2033
- Figure 66: Middle East Field Erected Cooling Towers Industry Volume Share (%), by Country 2025 & 2033
- Figure 67: South America Field Erected Cooling Towers Industry Revenue (billion), by Type 2025 & 2033
- Figure 68: South America Field Erected Cooling Towers Industry Volume (Gigawatt), by Type 2025 & 2033
- Figure 69: South America Field Erected Cooling Towers Industry Revenue Share (%), by Type 2025 & 2033
- Figure 70: South America Field Erected Cooling Towers Industry Volume Share (%), by Type 2025 & 2033
- Figure 71: South America Field Erected Cooling Towers Industry Revenue (billion), by Design 2025 & 2033
- Figure 72: South America Field Erected Cooling Towers Industry Volume (Gigawatt), by Design 2025 & 2033
- Figure 73: South America Field Erected Cooling Towers Industry Revenue Share (%), by Design 2025 & 2033
- Figure 74: South America Field Erected Cooling Towers Industry Volume Share (%), by Design 2025 & 2033
- Figure 75: South America Field Erected Cooling Towers Industry Revenue (billion), by End User 2025 & 2033
- Figure 76: South America Field Erected Cooling Towers Industry Volume (Gigawatt), by End User 2025 & 2033
- Figure 77: South America Field Erected Cooling Towers Industry Revenue Share (%), by End User 2025 & 2033
- Figure 78: South America Field Erected Cooling Towers Industry Volume Share (%), by End User 2025 & 2033
- Figure 79: South America Field Erected Cooling Towers Industry Revenue (billion), by Country 2025 & 2033
- Figure 80: South America Field Erected Cooling Towers Industry Volume (Gigawatt), by Country 2025 & 2033
- Figure 81: South America Field Erected Cooling Towers Industry Revenue Share (%), by Country 2025 & 2033
- Figure 82: South America Field Erected Cooling Towers Industry Volume Share (%), by Country 2025 & 2033
List of Tables
- Table 1: Global Field Erected Cooling Towers Industry Revenue billion Forecast, by Type 2020 & 2033
- Table 2: Global Field Erected Cooling Towers Industry Volume Gigawatt Forecast, by Type 2020 & 2033
- Table 3: Global Field Erected Cooling Towers Industry Revenue billion Forecast, by Design 2020 & 2033
- Table 4: Global Field Erected Cooling Towers Industry Volume Gigawatt Forecast, by Design 2020 & 2033
- Table 5: Global Field Erected Cooling Towers Industry Revenue billion Forecast, by End User 2020 & 2033
- Table 6: Global Field Erected Cooling Towers Industry Volume Gigawatt Forecast, by End User 2020 & 2033
- Table 7: Global Field Erected Cooling Towers Industry Revenue billion Forecast, by Region 2020 & 2033
- Table 8: Global Field Erected Cooling Towers Industry Volume Gigawatt Forecast, by Region 2020 & 2033
- Table 9: Global Field Erected Cooling Towers Industry Revenue billion Forecast, by Type 2020 & 2033
- Table 10: Global Field Erected Cooling Towers Industry Volume Gigawatt Forecast, by Type 2020 & 2033
- Table 11: Global Field Erected Cooling Towers Industry Revenue billion Forecast, by Design 2020 & 2033
- Table 12: Global Field Erected Cooling Towers Industry Volume Gigawatt Forecast, by Design 2020 & 2033
- Table 13: Global Field Erected Cooling Towers Industry Revenue billion Forecast, by End User 2020 & 2033
- Table 14: Global Field Erected Cooling Towers Industry Volume Gigawatt Forecast, by End User 2020 & 2033
- Table 15: Global Field Erected Cooling Towers Industry Revenue billion Forecast, by Country 2020 & 2033
- Table 16: Global Field Erected Cooling Towers Industry Volume Gigawatt Forecast, by Country 2020 & 2033
- Table 17: Global Field Erected Cooling Towers Industry Revenue billion Forecast, by Type 2020 & 2033
- Table 18: Global Field Erected Cooling Towers Industry Volume Gigawatt Forecast, by Type 2020 & 2033
- Table 19: Global Field Erected Cooling Towers Industry Revenue billion Forecast, by Design 2020 & 2033
- Table 20: Global Field Erected Cooling Towers Industry Volume Gigawatt Forecast, by Design 2020 & 2033
- Table 21: Global Field Erected Cooling Towers Industry Revenue billion Forecast, by End User 2020 & 2033
- Table 22: Global Field Erected Cooling Towers Industry Volume Gigawatt Forecast, by End User 2020 & 2033
- Table 23: Global Field Erected Cooling Towers Industry Revenue billion Forecast, by Country 2020 & 2033
- Table 24: Global Field Erected Cooling Towers Industry Volume Gigawatt Forecast, by Country 2020 & 2033
- Table 25: Global Field Erected Cooling Towers Industry Revenue billion Forecast, by Type 2020 & 2033
- Table 26: Global Field Erected Cooling Towers Industry Volume Gigawatt Forecast, by Type 2020 & 2033
- Table 27: Global Field Erected Cooling Towers Industry Revenue billion Forecast, by Design 2020 & 2033
- Table 28: Global Field Erected Cooling Towers Industry Volume Gigawatt Forecast, by Design 2020 & 2033
- Table 29: Global Field Erected Cooling Towers Industry Revenue billion Forecast, by End User 2020 & 2033
- Table 30: Global Field Erected Cooling Towers Industry Volume Gigawatt Forecast, by End User 2020 & 2033
- Table 31: Global Field Erected Cooling Towers Industry Revenue billion Forecast, by Country 2020 & 2033
- Table 32: Global Field Erected Cooling Towers Industry Volume Gigawatt Forecast, by Country 2020 & 2033
- Table 33: Global Field Erected Cooling Towers Industry Revenue billion Forecast, by Type 2020 & 2033
- Table 34: Global Field Erected Cooling Towers Industry Volume Gigawatt Forecast, by Type 2020 & 2033
- Table 35: Global Field Erected Cooling Towers Industry Revenue billion Forecast, by Design 2020 & 2033
- Table 36: Global Field Erected Cooling Towers Industry Volume Gigawatt Forecast, by Design 2020 & 2033
- Table 37: Global Field Erected Cooling Towers Industry Revenue billion Forecast, by End User 2020 & 2033
- Table 38: Global Field Erected Cooling Towers Industry Volume Gigawatt Forecast, by End User 2020 & 2033
- Table 39: Global Field Erected Cooling Towers Industry Revenue billion Forecast, by Country 2020 & 2033
- Table 40: Global Field Erected Cooling Towers Industry Volume Gigawatt Forecast, by Country 2020 & 2033
- Table 41: Global Field Erected Cooling Towers Industry Revenue billion Forecast, by Type 2020 & 2033
- Table 42: Global Field Erected Cooling Towers Industry Volume Gigawatt Forecast, by Type 2020 & 2033
- Table 43: Global Field Erected Cooling Towers Industry Revenue billion Forecast, by Design 2020 & 2033
- Table 44: Global Field Erected Cooling Towers Industry Volume Gigawatt Forecast, by Design 2020 & 2033
- Table 45: Global Field Erected Cooling Towers Industry Revenue billion Forecast, by End User 2020 & 2033
- Table 46: Global Field Erected Cooling Towers Industry Volume Gigawatt Forecast, by End User 2020 & 2033
- Table 47: Global Field Erected Cooling Towers Industry Revenue billion Forecast, by Country 2020 & 2033
- Table 48: Global Field Erected Cooling Towers Industry Volume Gigawatt Forecast, by Country 2020 & 2033
Frequently Asked Questions
1. What is the projected Compound Annual Growth Rate (CAGR) of the Field Erected Cooling Towers Industry?
The projected CAGR is approximately 5.65%.
2. Which companies are prominent players in the Field Erected Cooling Towers Industry?
Key companies in the market include SPX Cooling Technologies Inc, Evapco Inc, Watco Group Ltd, ENEXIO Management GmbH, Hamon & Cie International SA, Towertech Cooling System Pvt Ltd, Paharpur Cooling Towers Ltd, Cyrco Inc, Babcock & Wilcox Enterprises Inc, Marley Flow Control Pty Ltd*List Not Exhaustive.
3. What are the main segments of the Field Erected Cooling Towers Industry?
The market segments include Type, Design, End User.
4. Can you provide details about the market size?
The market size is estimated to be USD 2.93 billion as of 2022.
5. What are some drivers contributing to market growth?
4.; Declining Cost of Lithium Batteries4.; Increased Adoption of Renewable Energy.
6. What are the notable trends driving market growth?
Wet Type Segment to Dominate the Market.
7. Are there any restraints impacting market growth?
4.; Mismatch in Demand and Supply of Raw Materials for Battery Manufacturing.
8. Can you provide examples of recent developments in the market?
In February 2020, SPX Cooling Technologies Inc. launched its new Marley MH Element Fluid Cooler, an induced-draft, crossflow closed-circuit cooling tower suitable for heating, ventilation, air conditioning (HVAC), industrial, and process cooling applications.
9. What pricing options are available for accessing the report?
Pricing options include single-user, multi-user, and enterprise licenses priced at USD 4750, USD 5250, and USD 8750 respectively.
10. Is the market size provided in terms of value or volume?
The market size is provided in terms of value, measured in billion and volume, measured in Gigawatt.
11. Are there any specific market keywords associated with the report?
Yes, the market keyword associated with the report is "Field Erected Cooling Towers Industry," which aids in identifying and referencing the specific market segment covered.
12. How do I determine which pricing option suits my needs best?
The pricing options vary based on user requirements and access needs. Individual users may opt for single-user licenses, while businesses requiring broader access may choose multi-user or enterprise licenses for cost-effective access to the report.
13. Are there any additional resources or data provided in the Field Erected Cooling Towers Industry report?
While the report offers comprehensive insights, it's advisable to review the specific contents or supplementary materials provided to ascertain if additional resources or data are available.
14. How can I stay updated on further developments or reports in the Field Erected Cooling Towers Industry?
To stay informed about further developments, trends, and reports in the Field Erected Cooling Towers Industry, consider subscribing to industry newsletters, following relevant companies and organizations, or regularly checking reputable industry news sources and publications.
Methodology
Step 1 - Identification of Relevant Samples Size from Population Database


Step 2 - Approaches for Defining Global Market Size (Value, Volume* & Price*)

Note*: In applicable scenarios
Step 3 - Data Sources
Primary Research
- Web Analytics
- Survey Reports
- Research Institute
- Latest Research Reports
- Opinion Leaders
Secondary Research
- Annual Reports
- White Paper
- Latest Press Release
- Industry Association
- Paid Database
- Investor Presentations

Step 4 - Data Triangulation
Involves using different sources of information in order to increase the validity of a study
These sources are likely to be stakeholders in a program - participants, other researchers, program staff, other community members, and so on.
Then we put all data in single framework & apply various statistical tools to find out the dynamic on the market.
During the analysis stage, feedback from the stakeholder groups would be compared to determine areas of agreement as well as areas of divergence