

Key Insights
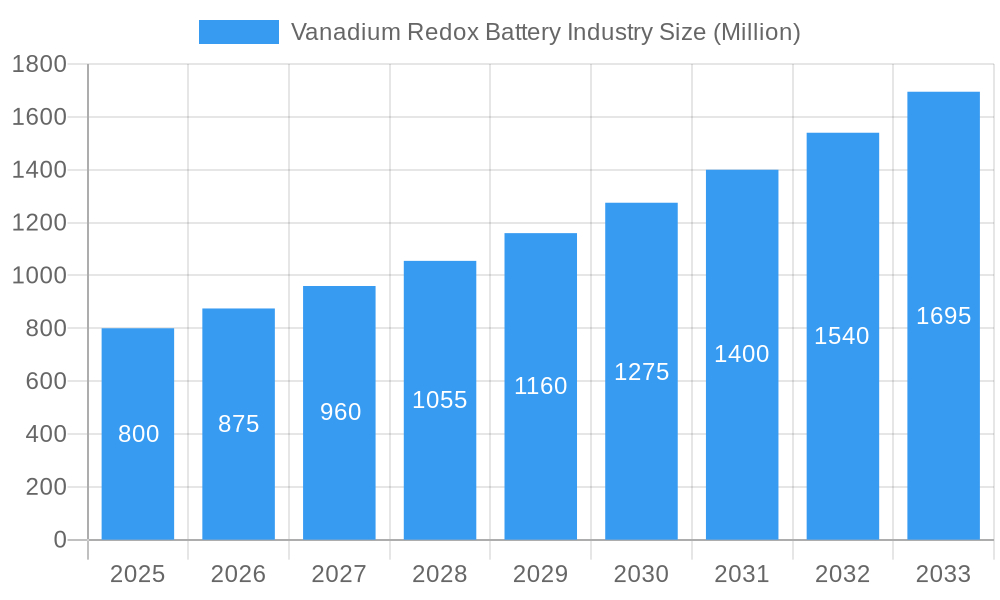
The Vanadium Redox Battery (VRB) market is projected for substantial expansion, driven by escalating global demand for reliable, scalable energy storage. With a projected market size of $262.45 million in the base year 2025, the sector is set to experience a robust Compound Annual Growth Rate (CAGR) exceeding 54.94% over the forecast period. This growth is fueled by the increasing integration of renewable energy sources, necessitating advanced storage to mitigate intermittency, and the growing need for grid stability, load leveling, and microgrid development. VRBs' advantages—long lifespan, high cycle life, inherent safety, and scalability—make them ideal for utility-scale, commercial, and industrial applications. Advancements in electrolyte production and battery design are enhancing cost-effectiveness and performance, accelerating adoption.
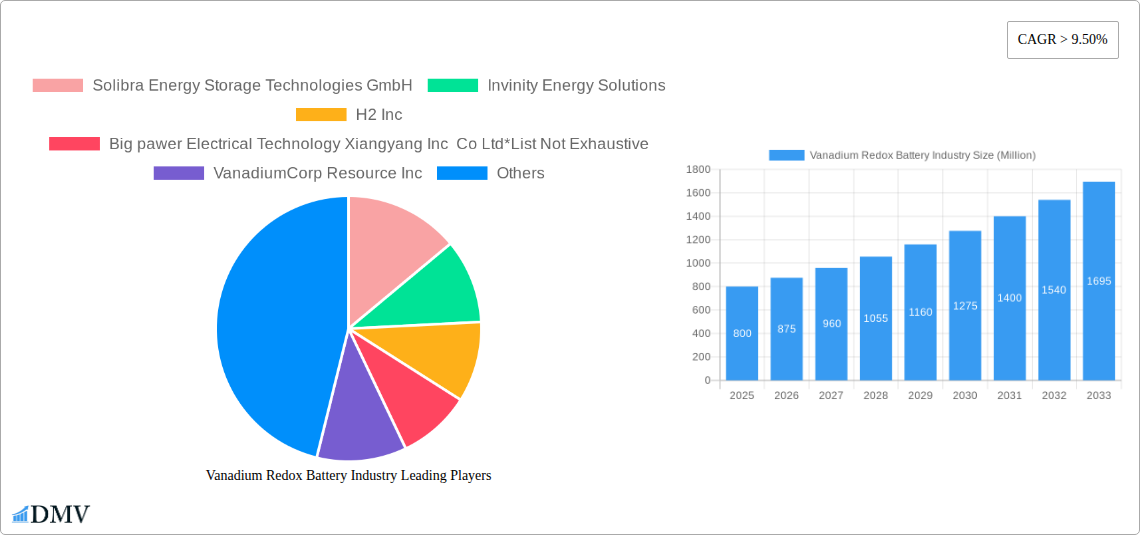
Vanadium Redox Battery Industry Market Size (In Million)
The Vanadium Redox Battery market is shaped by evolving trends and strategic investments. Key trends include VRB adoption for peak shaving and demand charge management in the commercial sector, alongside their growing role in enhancing electricity grid stability for utilities. The "Others" segment, covering industrial backup power and off-grid solutions, also shows promising growth. While established players like Solibra Energy Storage Technologies GmbH and Invinity Energy Solutions dominate, emerging companies such as H2 Inc and UniEnergy Technologies are driving innovation. Initial capital costs and vanadium price volatility are being addressed through technological advancements and strategic sourcing. The outlook is strongly positive, with North America and Europe leading adoption, and the Asia Pacific region poised for significant growth due to rapid industrialization and renewable energy targets.
Vanadium Redox Battery Industry Company Market Share
Unlock critical insights into the Vanadium Redox Battery industry with our comprehensive market research. Discover detailed market size, growth forecasts, and key trends shaping this vital energy storage sector.
Vanadium Redox Battery Industry Market Composition & Trends
The Vanadium Redox Battery (VRB) market is characterized by a dynamic interplay of technological innovation, strategic partnerships, and evolving energy storage needs. While still a niche segment within the broader battery landscape, VRB technology is gaining significant traction due to its inherent advantages in long-duration energy storage, scalability, and long cycle life. Market concentration is moderate, with several key players vying for dominance through continuous R&D and targeted expansion. Innovation catalysts include the increasing demand for grid-scale energy storage solutions to integrate renewable energy sources like solar and wind, alongside the growing need for reliable backup power for critical infrastructure. Regulatory landscapes are increasingly favorable, with governments worldwide offering incentives and mandates for energy storage deployment. Substitute products, primarily lithium-ion batteries, present a competitive challenge, particularly in applications where energy density is paramount. However, VRBs excel in applications demanding consistent power output over extended periods, such as utility-scale storage and industrial backup. End-user profiles are diverse, encompassing utilities seeking grid stability, commercial entities aiming for cost savings and energy independence, and other niche applications requiring dependable, long-duration energy. Mergers and acquisitions (M&A) are becoming more prevalent as companies seek to consolidate market share, acquire complementary technologies, and expand their geographical reach. For instance, a recent M&A deal in the energy storage sector was valued at approximately USD XXX million, reflecting the growing investor confidence in this sector. Key trends include a significant increase in project pipelines, with an estimated XX% growth in announced projects year-over-year, and a projected market share distribution where utility-scale applications are expected to command over XX% of the total market by 2025, followed by commercial and other segments.
- Market Concentration: Moderate, with key players driving innovation and expansion.
- Innovation Catalysts: Renewable energy integration, grid stability, backup power requirements.
- Regulatory Landscape: Increasingly supportive with incentives and mandates for energy storage.
- Substitute Products: Lithium-ion batteries remain a primary competitor.
- End-User Profiles: Utility, Commercial, Others (e.g., microgrids, industrial facilities).
- M&A Activities: Growing trend driven by market consolidation and technology acquisition.
Vanadium Redox Battery Industry Industry Evolution
The Vanadium Redox Battery (VRB) industry has witnessed a transformative evolution over the historical period (2019–2024) and is poised for substantial growth throughout the forecast period (2025–2033). Initial market penetration was driven by niche applications and pilot projects, but significant advancements in electrolyte chemistry, stack design, and manufacturing processes have propelled VRBs into mainstream consideration for large-scale energy storage. The industry's trajectory is closely linked to the global energy transition, with increasing pressure to decarbonize power grids and enhance grid resilience. Technological advancements have focused on improving power density, reducing capital costs, and extending operational lifespan, making VRBs increasingly competitive against established battery technologies. For example, improvements in electrode materials and membrane technologies have led to an estimated XX% increase in energy efficiency and a XX% reduction in degradation rates over the last five years. Consumer demand is shifting towards solutions offering long-duration storage capabilities, a key strength of VRBs, especially as intermittent renewable energy sources become a larger part of the energy mix. The base year (2025) marks a crucial inflection point, with projected annual growth rates expected to accelerate from approximately XX% in 2025 to over XX% by 2030. Adoption metrics, such as the number of megawatt-hours deployed annually, have seen a compounded annual growth rate (CAGR) of XX% from 2019 to 2024, a trend anticipated to continue and intensify. The industry's evolution is further characterized by the diversification of applications, moving beyond simple grid-scale storage to encompass microgrids, industrial process optimization, and even off-grid power solutions. Investment in VRB technology has also seen a significant uptick, with venture capital funding and strategic corporate investments increasing by over XX% in the last two years, signaling strong market confidence in the technology's future potential. The development of more efficient manufacturing techniques has also contributed to a downward trend in the levelized cost of storage (LCOS) for VRBs, making them an increasingly attractive economic proposition for utilities and large-scale energy users. This ongoing evolution underscores the VRB industry's pivotal role in enabling a more sustainable and reliable energy future.
Leading Regions, Countries, or Segments in Vanadium Redox Battery Industry
The Vanadium Redox Battery (VRB) industry is experiencing significant regional and segmental growth, with a clear dominance emerging in specific markets. Among the end-user segments, the Utility sector stands out as the primary driver of VRB adoption. This dominance is fueled by several critical factors, including the increasing need for grid-scale energy storage to balance intermittent renewable energy sources, enhance grid stability, and provide ancillary services. Utilities are investing heavily in long-duration energy storage solutions that VRBs are uniquely positioned to deliver.
- Utility Segment Dominance:
- Grid Stability & Renewable Integration: Utilities require massive storage capacity to smooth out the fluctuations in solar and wind power generation, ensuring a reliable electricity supply. VRBs, with their inherent long-duration capabilities, are ideal for this purpose.
- Peak Shaving & Load Leveling: VRBs enable utilities to store energy during off-peak hours and discharge it during peak demand, optimizing grid operations and reducing reliance on expensive peaker plants.
- Ancillary Services: The ability of VRBs to respond rapidly and consistently to grid demands makes them valuable for providing frequency regulation, voltage support, and other essential grid services.
- Regulatory Support & Incentives: Government mandates and financial incentives for energy storage deployment, particularly for grid-scale projects, directly benefit the utility sector's adoption of VRB technology.
- Project Scale & Longevity: VRB systems can be scaled to gigawatt-hour capacities and offer a lifespan of over 20 years with minimal degradation, aligning perfectly with the long-term infrastructure planning of utility companies.
In terms of geographical influence, North America, particularly the United States, is emerging as a leading region. This leadership is attributed to substantial government funding for energy storage research and deployment, favorable regulatory frameworks, and a proactive approach to integrating renewable energy. States like California have been at the forefront, setting ambitious renewable energy targets and supporting large-scale energy storage projects. Investment trends in North America show a clear bias towards utility-scale VRB installations, often driven by state-level clean energy initiatives and federal grants. Regulatory support, such as tax credits and clean energy portfolio standards, further bolsters the demand for VRBs in this region.
- North America (United States) as a Leading Region:
- Government Funding & Grants: Significant federal and state-level funding programs are accelerating VRB project development. For instance, the USD 31 million grant from the California Energy Commission for a long-duration energy storage system underscores this trend.
- Favorable Regulatory Environment: Policies encouraging renewable energy integration and energy storage deployment create a conducive market for VRBs.
- Strong Utility Investment: Major utilities are actively procuring and deploying large-scale energy storage solutions, with VRBs being a preferred choice for their long-duration capabilities.
- Advancements in Technology Deployment: The region is a hub for the demonstration and commercialization of advanced VRB systems.
While North America is leading, Australia is rapidly gaining prominence, particularly with recent strategic manufacturing agreements. The development of local manufacturing capabilities and the construction of large-scale VRB projects, such as the one planned with CellCube and North Harbour Clean Energy PTY Ltd., signal a strong commitment to the technology. This growing presence in Australia, driven by its abundant renewable energy resources and a clear strategy to support domestic manufacturing, positions it as a significant player in the global VRB market.
Vanadium Redox Battery Industry Product Innovations
Product innovations in the Vanadium Redox Battery (VRB) industry are primarily focused on enhancing performance, reducing costs, and expanding application versatility. Key advancements include the development of novel electrode materials that improve electrochemical kinetics and reduce internal resistance, leading to higher efficiency and faster charge/discharge rates. Improvements in membrane technology are also crucial, focusing on enhanced ion permeability and reduced crossover of vanadium ions, thereby extending battery life and maintaining electrolyte integrity. Furthermore, engineers are innovating in stack design to optimize volumetric energy density and thermal management, making VRB systems more compact and suitable for a wider range of installations. Performance metrics are seeing steady improvements, with typical efficiencies now exceeding XX% round-trip and cycle lives often surpassing 15,000 cycles, with some systems projected for over 20 years of operation. The unique selling proposition of VRBs – their inherent safety, non-flammability, and long-duration energy storage capabilities – is being amplified through these innovations.
Propelling Factors for Vanadium Redox Battery Industry Growth
Several key factors are propelling the growth of the Vanadium Redox Battery (VRB) industry. The accelerating global transition towards renewable energy sources, such as solar and wind power, necessitates robust long-duration energy storage solutions to ensure grid stability and reliability, a role perfectly suited for VRBs. Growing concerns over grid resilience and the need for backup power in the face of extreme weather events and infrastructure vulnerabilities further drive demand. Technological advancements leading to reduced costs and improved performance metrics are making VRBs increasingly competitive. Supportive government policies, including incentives, subsidies, and mandates for energy storage deployment, are also significant growth catalysts. Economic factors, such as the increasing cost-competitiveness of VRB technology compared to fossil fuel-based peaking power plants and the potential for revenue generation through ancillary services, are attracting substantial investment.
- Renewable Energy Integration: Essential for balancing intermittent solar and wind power.
- Grid Modernization & Resilience: Enhancing grid stability and providing backup power.
- Technological Advancements: Reduced costs, improved efficiency, and longer lifespan.
- Supportive Regulatory Frameworks: Government incentives and clean energy mandates.
- Economic Competitiveness: Lower levelized cost of storage (LCOS) and revenue generation opportunities.
Obstacles in the Vanadium Redox Battery Industry Market
Despite its promising outlook, the Vanadium Redox Battery (VRB) industry faces several obstacles. The primary challenge remains the cost of vanadium electrolyte, which is a significant component of the overall system cost, making initial capital expenditure higher compared to some competing technologies, particularly in smaller-scale applications. Supply chain volatility for vanadium, a critical raw material, can also pose a risk, impacting price stability and availability. While VRBs are inherently safe, scaling manufacturing processes to meet rapidly growing demand requires substantial investment and can be complex. Furthermore, limited market awareness and understanding of VRB technology's unique benefits compared to more established battery chemistries can slow adoption rates. Regulatory complexities and permitting processes for large-scale energy storage projects can also introduce delays. Finally, competition from other battery technologies, especially lithium-ion, remains a significant factor, particularly in segments where energy density or faster response times are prioritized over long-duration storage.
Future Opportunities in Vanadium Redox Battery Industry
The future opportunities for the Vanadium Redox Battery (VRB) industry are vast and multifaceted. The continuous expansion of renewable energy portfolios globally will create an ever-increasing demand for long-duration energy storage solutions like VRBs. Emerging markets in developing economies seeking to leapfrog traditional energy infrastructure and build resilient, clean grids present significant untapped potential. Technological advancements in areas such as flow battery design, material science for improved electrode and membrane performance, and system integration are expected to further enhance VRB competitiveness and open new application avenues. The increasing focus on circular economy principles and the potential for vanadium recycling from spent electrolytes or other industrial sources offers a sustainable growth path. Furthermore, the evolving energy landscape, with the rise of microgrids, electric vehicle charging infrastructure, and the need for industrial process optimization, will create diverse and substantial opportunities for VRB deployment.
Major Players in the Vanadium Redox Battery Industry Ecosystem
- Solibra Energy Storage Technologies GmbH
- Invinity Energy Solutions
- H2 Inc
- Big pawer Electrical Technology Xiangyang Inc Co Ltd
- VanadiumCorp Resource Inc
- UniEnergy Technologies
- VRB Energy
- CellCube
Key Developments in Vanadium Redox Battery Industry Industry
- November 2022: North Harbour Clean Energy PTY Ltd. and CellCube signed a strategic manufacturing cooperation agreement to establish an assembly and manufacturing line in Eastern Australia. The initial target for production capacity is 40-160 megawatt hours per year, with aspirations to reach up to 8,000 megawatt hours. This partnership also includes plans to construct Australia's largest vanadium flow battery, with a capacity ranging from 4 to 16 megawatt-hours.
- November 2022: The Viejas Tribe of Kumeyaay Indians was scheduled to receive backup power from a 60 MWh long-duration energy storage system funded by a USD 31 million grant from the California Energy Commission. This project includes a zinc hybrid cathode battery system by Eos Energy Enterprises and a 10 MWh vanadium redox flow battery from Infinity Energy Systems.
Strategic Vanadium Redox Battery Industry Market Forecast
The strategic market forecast for the Vanadium Redox Battery (VRB) industry is overwhelmingly positive, driven by an intensifying global commitment to decarbonization and energy independence. The increasing penetration of renewable energy sources necessitates sophisticated long-duration storage solutions, a role where VRBs excel due to their scalability, longevity, and inherent safety. Technological advancements are continuously improving efficiency and reducing costs, making VRB systems more economically viable for a wider range of applications, from utility-scale grid stabilization to commercial backup power. Supportive government policies, including incentives for clean energy and energy storage deployment, further accelerate market adoption. The projected growth trajectory indicates a substantial increase in installed capacity, with market potential expanding significantly as new applications emerge and existing ones mature. The strategic importance of VRBs in building resilient and sustainable energy infrastructures positions them as a critical technology for the future energy landscape.
Vanadium Redox Battery Industry Segmentation
-
1. End-User
- 1.1. Utility
- 1.2. Commercial
- 1.3. Others
Vanadium Redox Battery Industry Segmentation By Geography
- 1. North America
- 2. Europe
- 3. Asia Pacific
- 4. South America
- 5. Middle East and Africa
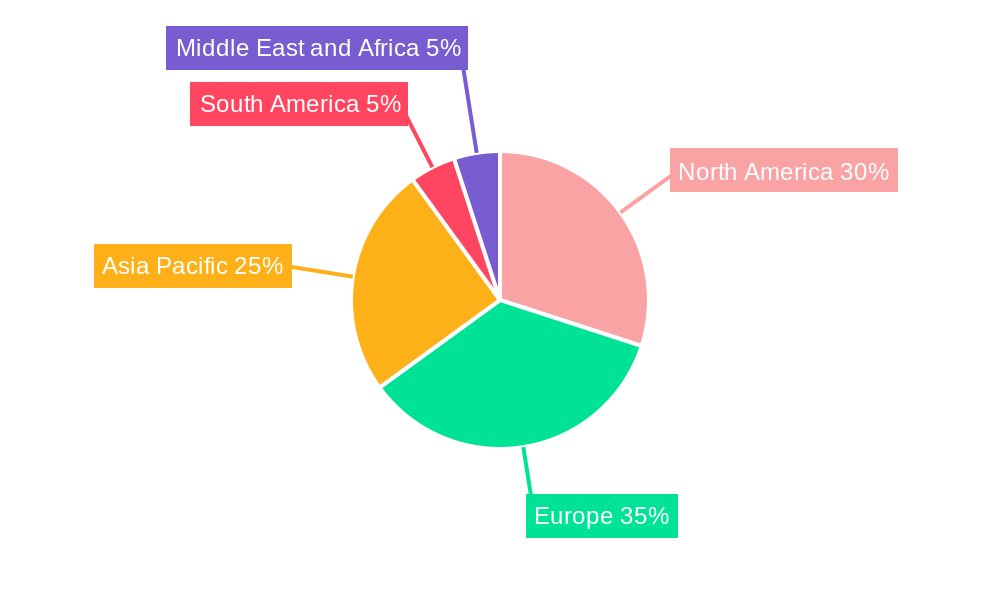
Vanadium Redox Battery Industry Regional Market Share
Geographic Coverage of Vanadium Redox Battery Industry
Vanadium Redox Battery Industry REPORT HIGHLIGHTS
| Aspects | Details |
|---|---|
| Study Period | 2020-2034 |
| Base Year | 2025 |
| Estimated Year | 2026 |
| Forecast Period | 2026-2034 |
| Historical Period | 2020-2025 |
| Growth Rate | CAGR of 54.94% from 2020-2034 |
| Segmentation |
|
Table of Contents
- 1. Introduction
- 1.1. Research Scope
- 1.2. Market Segmentation
- 1.3. Research Objective
- 1.4. Definitions and Assumptions
- 2. Executive Summary
- 2.1. Market Snapshot
- 3. Market Dynamics
- 3.1. Market Drivers
- 3.2. Market Restrains
- 3.3. Market Trends
- 3.4. Market Opportunities
- 4. Market Factor Analysis
- 4.1. Porters Five Forces
- 4.1.1. Bargaining Power of Suppliers
- 4.1.2. Bargaining Power of Buyers
- 4.1.3. Threat of New Entrants
- 4.1.4. Threat of Substitutes
- 4.1.5. Competitive Rivalry
- 4.2. PESTEL analysis
- 4.3. BCG Analysis
- 4.3.1. Stars (High Growth, High Market Share)
- 4.3.2. Cash Cows (Low Growth, High Market Share)
- 4.3.3. Question Mark (High Growth, Low Market Share)
- 4.3.4. Dogs (Low Growth, Low Market Share)
- 4.4. Ansoff Matrix Analysis
- 4.5. Supply Chain Analysis
- 4.6. Regulatory Landscape
- 4.7. Current Market Potential and Opportunity Assessment (TAM–SAM–SOM Framework)
- 4.8. DMV Analyst Note
- 4.1. Porters Five Forces
- 5. Market Analysis, Insights and Forecast 2021-2033
- 5.1. Market Analysis, Insights and Forecast - by End-User
- 5.1.1. Utility
- 5.1.2. Commercial
- 5.1.3. Others
- 5.2. Market Analysis, Insights and Forecast - by Region
- 5.2.1. North America
- 5.2.2. Europe
- 5.2.3. Asia Pacific
- 5.2.4. South America
- 5.2.5. Middle East and Africa
- 5.1. Market Analysis, Insights and Forecast - by End-User
- 6. Global Vanadium Redox Battery Industry Analysis, Insights and Forecast, 2021-2033
- 6.1. Market Analysis, Insights and Forecast - by End-User
- 6.1.1. Utility
- 6.1.2. Commercial
- 6.1.3. Others
- 6.1. Market Analysis, Insights and Forecast - by End-User
- 7. North America Vanadium Redox Battery Industry Analysis, Insights and Forecast, 2020-2032
- 7.1. Market Analysis, Insights and Forecast - by End-User
- 7.1.1. Utility
- 7.1.2. Commercial
- 7.1.3. Others
- 7.1. Market Analysis, Insights and Forecast - by End-User
- 8. Europe Vanadium Redox Battery Industry Analysis, Insights and Forecast, 2020-2032
- 8.1. Market Analysis, Insights and Forecast - by End-User
- 8.1.1. Utility
- 8.1.2. Commercial
- 8.1.3. Others
- 8.1. Market Analysis, Insights and Forecast - by End-User
- 9. Asia Pacific Vanadium Redox Battery Industry Analysis, Insights and Forecast, 2020-2032
- 9.1. Market Analysis, Insights and Forecast - by End-User
- 9.1.1. Utility
- 9.1.2. Commercial
- 9.1.3. Others
- 9.1. Market Analysis, Insights and Forecast - by End-User
- 10. South America Vanadium Redox Battery Industry Analysis, Insights and Forecast, 2020-2032
- 10.1. Market Analysis, Insights and Forecast - by End-User
- 10.1.1. Utility
- 10.1.2. Commercial
- 10.1.3. Others
- 10.1. Market Analysis, Insights and Forecast - by End-User
- 11. Middle East and Africa Vanadium Redox Battery Industry Analysis, Insights and Forecast, 2020-2032
- 11.1. Market Analysis, Insights and Forecast - by End-User
- 11.1.1. Utility
- 11.1.2. Commercial
- 11.1.3. Others
- 11.1. Market Analysis, Insights and Forecast - by End-User
- 12. Competitive Analysis
- 12.1. Company Profiles
- 12.1.1 Solibra Energy Storage Technologies GmbH
- 12.1.1.1. Company Overview
- 12.1.1.2. Products
- 12.1.1.3. Company Financials
- 12.1.1.4. SWOT Analysis
- 12.1.2 Invinity Energy Solutions
- 12.1.2.1. Company Overview
- 12.1.2.2. Products
- 12.1.2.3. Company Financials
- 12.1.2.4. SWOT Analysis
- 12.1.3 H2 Inc
- 12.1.3.1. Company Overview
- 12.1.3.2. Products
- 12.1.3.3. Company Financials
- 12.1.3.4. SWOT Analysis
- 12.1.4 Big pawer Electrical Technology Xiangyang Inc Co Ltd*List Not Exhaustive
- 12.1.4.1. Company Overview
- 12.1.4.2. Products
- 12.1.4.3. Company Financials
- 12.1.4.4. SWOT Analysis
- 12.1.5 VanadiumCorp Resource Inc
- 12.1.5.1. Company Overview
- 12.1.5.2. Products
- 12.1.5.3. Company Financials
- 12.1.5.4. SWOT Analysis
- 12.1.6 UniEnergy Technologies
- 12.1.6.1. Company Overview
- 12.1.6.2. Products
- 12.1.6.3. Company Financials
- 12.1.6.4. SWOT Analysis
- 12.1.7 VRB Energy
- 12.1.7.1. Company Overview
- 12.1.7.2. Products
- 12.1.7.3. Company Financials
- 12.1.7.4. SWOT Analysis
- 12.1.1 Solibra Energy Storage Technologies GmbH
- 12.2. Market Entropy
- 12.2.1 Company's Key Areas Served
- 12.2.2 Recent Developments
- 12.3. Company Market Share Analysis 2025
- 12.3.1 Top 5 Companies Market Share Analysis
- 12.3.2 Top 3 Companies Market Share Analysis
- 12.4. List of Potential Customers
- 13. Research Methodology
List of Figures
- Figure 1: Global Vanadium Redox Battery Industry Revenue Breakdown (million, %) by Region 2025 & 2033
- Figure 2: Global Vanadium Redox Battery Industry Volume Breakdown (K Units, %) by Region 2025 & 2033
- Figure 3: North America Vanadium Redox Battery Industry Revenue (million), by End-User 2025 & 2033
- Figure 4: North America Vanadium Redox Battery Industry Volume (K Units), by End-User 2025 & 2033
- Figure 5: North America Vanadium Redox Battery Industry Revenue Share (%), by End-User 2025 & 2033
- Figure 6: North America Vanadium Redox Battery Industry Volume Share (%), by End-User 2025 & 2033
- Figure 7: North America Vanadium Redox Battery Industry Revenue (million), by Country 2025 & 2033
- Figure 8: North America Vanadium Redox Battery Industry Volume (K Units), by Country 2025 & 2033
- Figure 9: North America Vanadium Redox Battery Industry Revenue Share (%), by Country 2025 & 2033
- Figure 10: North America Vanadium Redox Battery Industry Volume Share (%), by Country 2025 & 2033
- Figure 11: Europe Vanadium Redox Battery Industry Revenue (million), by End-User 2025 & 2033
- Figure 12: Europe Vanadium Redox Battery Industry Volume (K Units), by End-User 2025 & 2033
- Figure 13: Europe Vanadium Redox Battery Industry Revenue Share (%), by End-User 2025 & 2033
- Figure 14: Europe Vanadium Redox Battery Industry Volume Share (%), by End-User 2025 & 2033
- Figure 15: Europe Vanadium Redox Battery Industry Revenue (million), by Country 2025 & 2033
- Figure 16: Europe Vanadium Redox Battery Industry Volume (K Units), by Country 2025 & 2033
- Figure 17: Europe Vanadium Redox Battery Industry Revenue Share (%), by Country 2025 & 2033
- Figure 18: Europe Vanadium Redox Battery Industry Volume Share (%), by Country 2025 & 2033
- Figure 19: Asia Pacific Vanadium Redox Battery Industry Revenue (million), by End-User 2025 & 2033
- Figure 20: Asia Pacific Vanadium Redox Battery Industry Volume (K Units), by End-User 2025 & 2033
- Figure 21: Asia Pacific Vanadium Redox Battery Industry Revenue Share (%), by End-User 2025 & 2033
- Figure 22: Asia Pacific Vanadium Redox Battery Industry Volume Share (%), by End-User 2025 & 2033
- Figure 23: Asia Pacific Vanadium Redox Battery Industry Revenue (million), by Country 2025 & 2033
- Figure 24: Asia Pacific Vanadium Redox Battery Industry Volume (K Units), by Country 2025 & 2033
- Figure 25: Asia Pacific Vanadium Redox Battery Industry Revenue Share (%), by Country 2025 & 2033
- Figure 26: Asia Pacific Vanadium Redox Battery Industry Volume Share (%), by Country 2025 & 2033
- Figure 27: South America Vanadium Redox Battery Industry Revenue (million), by End-User 2025 & 2033
- Figure 28: South America Vanadium Redox Battery Industry Volume (K Units), by End-User 2025 & 2033
- Figure 29: South America Vanadium Redox Battery Industry Revenue Share (%), by End-User 2025 & 2033
- Figure 30: South America Vanadium Redox Battery Industry Volume Share (%), by End-User 2025 & 2033
- Figure 31: South America Vanadium Redox Battery Industry Revenue (million), by Country 2025 & 2033
- Figure 32: South America Vanadium Redox Battery Industry Volume (K Units), by Country 2025 & 2033
- Figure 33: South America Vanadium Redox Battery Industry Revenue Share (%), by Country 2025 & 2033
- Figure 34: South America Vanadium Redox Battery Industry Volume Share (%), by Country 2025 & 2033
- Figure 35: Middle East and Africa Vanadium Redox Battery Industry Revenue (million), by End-User 2025 & 2033
- Figure 36: Middle East and Africa Vanadium Redox Battery Industry Volume (K Units), by End-User 2025 & 2033
- Figure 37: Middle East and Africa Vanadium Redox Battery Industry Revenue Share (%), by End-User 2025 & 2033
- Figure 38: Middle East and Africa Vanadium Redox Battery Industry Volume Share (%), by End-User 2025 & 2033
- Figure 39: Middle East and Africa Vanadium Redox Battery Industry Revenue (million), by Country 2025 & 2033
- Figure 40: Middle East and Africa Vanadium Redox Battery Industry Volume (K Units), by Country 2025 & 2033
- Figure 41: Middle East and Africa Vanadium Redox Battery Industry Revenue Share (%), by Country 2025 & 2033
- Figure 42: Middle East and Africa Vanadium Redox Battery Industry Volume Share (%), by Country 2025 & 2033
List of Tables
- Table 1: Global Vanadium Redox Battery Industry Revenue million Forecast, by End-User 2020 & 2033
- Table 2: Global Vanadium Redox Battery Industry Volume K Units Forecast, by End-User 2020 & 2033
- Table 3: Global Vanadium Redox Battery Industry Revenue million Forecast, by Region 2020 & 2033
- Table 4: Global Vanadium Redox Battery Industry Volume K Units Forecast, by Region 2020 & 2033
- Table 5: Global Vanadium Redox Battery Industry Revenue million Forecast, by End-User 2020 & 2033
- Table 6: Global Vanadium Redox Battery Industry Volume K Units Forecast, by End-User 2020 & 2033
- Table 7: Global Vanadium Redox Battery Industry Revenue million Forecast, by Country 2020 & 2033
- Table 8: Global Vanadium Redox Battery Industry Volume K Units Forecast, by Country 2020 & 2033
- Table 9: Global Vanadium Redox Battery Industry Revenue million Forecast, by End-User 2020 & 2033
- Table 10: Global Vanadium Redox Battery Industry Volume K Units Forecast, by End-User 2020 & 2033
- Table 11: Global Vanadium Redox Battery Industry Revenue million Forecast, by Country 2020 & 2033
- Table 12: Global Vanadium Redox Battery Industry Volume K Units Forecast, by Country 2020 & 2033
- Table 13: Global Vanadium Redox Battery Industry Revenue million Forecast, by End-User 2020 & 2033
- Table 14: Global Vanadium Redox Battery Industry Volume K Units Forecast, by End-User 2020 & 2033
- Table 15: Global Vanadium Redox Battery Industry Revenue million Forecast, by Country 2020 & 2033
- Table 16: Global Vanadium Redox Battery Industry Volume K Units Forecast, by Country 2020 & 2033
- Table 17: Global Vanadium Redox Battery Industry Revenue million Forecast, by End-User 2020 & 2033
- Table 18: Global Vanadium Redox Battery Industry Volume K Units Forecast, by End-User 2020 & 2033
- Table 19: Global Vanadium Redox Battery Industry Revenue million Forecast, by Country 2020 & 2033
- Table 20: Global Vanadium Redox Battery Industry Volume K Units Forecast, by Country 2020 & 2033
- Table 21: Global Vanadium Redox Battery Industry Revenue million Forecast, by End-User 2020 & 2033
- Table 22: Global Vanadium Redox Battery Industry Volume K Units Forecast, by End-User 2020 & 2033
- Table 23: Global Vanadium Redox Battery Industry Revenue million Forecast, by Country 2020 & 2033
- Table 24: Global Vanadium Redox Battery Industry Volume K Units Forecast, by Country 2020 & 2033
Frequently Asked Questions
1. What is the projected Compound Annual Growth Rate (CAGR) of the Vanadium Redox Battery Industry?
The projected CAGR is approximately 54.94%.
2. Which companies are prominent players in the Vanadium Redox Battery Industry?
Key companies in the market include Solibra Energy Storage Technologies GmbH, Invinity Energy Solutions, H2 Inc, Big pawer Electrical Technology Xiangyang Inc Co Ltd*List Not Exhaustive, VanadiumCorp Resource Inc, UniEnergy Technologies, VRB Energy.
3. What are the main segments of the Vanadium Redox Battery Industry?
The market segments include End-User.
4. Can you provide details about the market size?
The market size is estimated to be USD 262.45 million as of 2022.
5. What are some drivers contributing to market growth?
4.; Growing Penetration of the Technology in Long-Duration Energy Storage Applications4.; Increasing Adoption of Renewable Energy.
6. What are the notable trends driving market growth?
Utility Sector to Witness Significant Growth.
7. Are there any restraints impacting market growth?
4.; Low Energy of Battery Cells.
8. Can you provide examples of recent developments in the market?
In November 2022, a strategic manufacturing cooperation agreement was signed between North Harbour Clean Energy PTY Ltd. in Australia and CellCube to build an assembly and manufacturing line in Eastern Australia. A production capacity of 40-160 megawatt hours per year is the initial target on the way to a target of up to 8,000 megawatt hours. In addition, the partners have decided to build Australia's biggest vanadium flow battery, with a capacity of 4 to 16 megawatt-hours.
9. What pricing options are available for accessing the report?
Pricing options include single-user, multi-user, and enterprise licenses priced at USD 4750, USD 5250, and USD 8750 respectively.
10. Is the market size provided in terms of value or volume?
The market size is provided in terms of value, measured in million and volume, measured in K Units.
11. Are there any specific market keywords associated with the report?
Yes, the market keyword associated with the report is "Vanadium Redox Battery Industry," which aids in identifying and referencing the specific market segment covered.
12. How do I determine which pricing option suits my needs best?
The pricing options vary based on user requirements and access needs. Individual users may opt for single-user licenses, while businesses requiring broader access may choose multi-user or enterprise licenses for cost-effective access to the report.
13. Are there any additional resources or data provided in the Vanadium Redox Battery Industry report?
While the report offers comprehensive insights, it's advisable to review the specific contents or supplementary materials provided to ascertain if additional resources or data are available.
14. How can I stay updated on further developments or reports in the Vanadium Redox Battery Industry?
To stay informed about further developments, trends, and reports in the Vanadium Redox Battery Industry, consider subscribing to industry newsletters, following relevant companies and organizations, or regularly checking reputable industry news sources and publications.
Methodology
Step 1 - Identification of Relevant Samples Size from Population Database


Step 2 - Approaches for Defining Global Market Size (Value, Volume* & Price*)

Note*: In applicable scenarios
Step 3 - Data Sources
Primary Research
- Web Analytics
- Survey Reports
- Research Institute
- Latest Research Reports
- Opinion Leaders
Secondary Research
- Annual Reports
- White Paper
- Latest Press Release
- Industry Association
- Paid Database
- Investor Presentations

Step 4 - Data Triangulation
Involves using different sources of information in order to increase the validity of a study
These sources are likely to be stakeholders in a program - participants, other researchers, program staff, other community members, and so on.
Then we put all data in single framework & apply various statistical tools to find out the dynamic on the market.
During the analysis stage, feedback from the stakeholder groups would be compared to determine areas of agreement as well as areas of divergence