

Key Insights
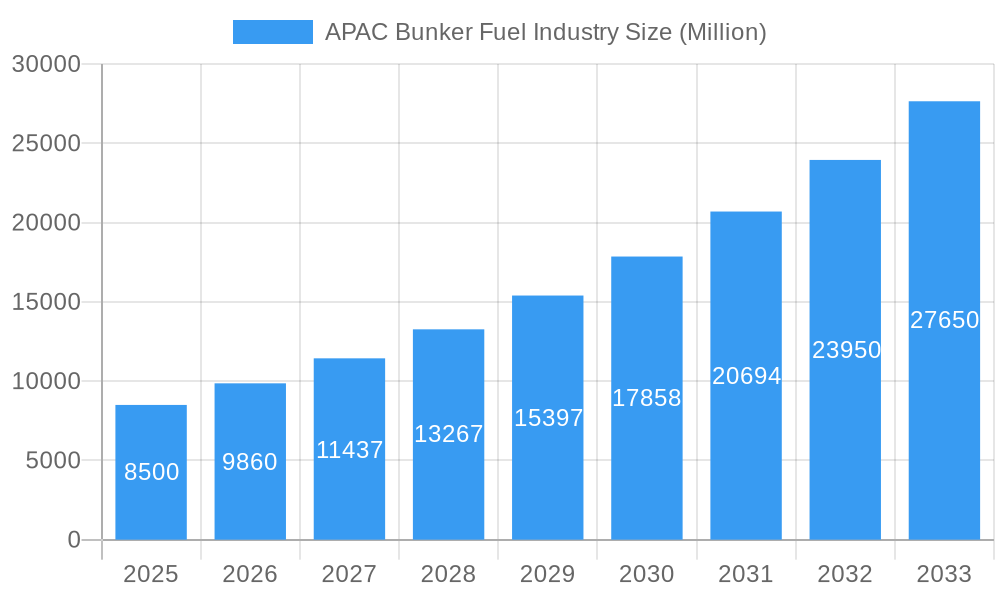
The APAC Bunker Fuel Market is projected for significant growth, driven by expanding global trade, a flourishing maritime industry, and stringent environmental regulations promoting cleaner fuel alternatives. The market is estimated at 83.9 billion in 2025 and is anticipated to expand at a CAGR of 5.8% from 2025 to 2033. A key trend is the increasing adoption of Very-Low Sulfur Fuel Oil (VLSFO) and Liquefied Natural Gas (LNG), largely due to the International Maritime Organization's (IMO) sulfur cap regulations. This transition aims to reduce marine pollution and enhance shipping fleet energy efficiency. Container ships and tankers will remain the primary consumers of bunker fuels, underscoring their critical role in global logistics.
APAC Bunker Fuel Industry Market Size (In Billion)
China, India, and Singapore are becoming pivotal centers for bunker fuel demand and supply, benefiting from their strategic maritime positions and robust port facilities. Continued industrialization and economic expansion across the Rest of Asia-Pacific are also fueling demand for shipping services and, by extension, bunker fuels. Potential challenges include volatile crude oil prices, substantial upfront investments for LNG infrastructure, and geopolitical risks. Nevertheless, the global push for decarbonization and ongoing advancements in fuel technology are expected to support a dynamic and evolving APAC Bunker Fuel Industry.
APAC Bunker Fuel Industry Company Market Share
APAC Bunker Fuel Industry Market Composition & Trends
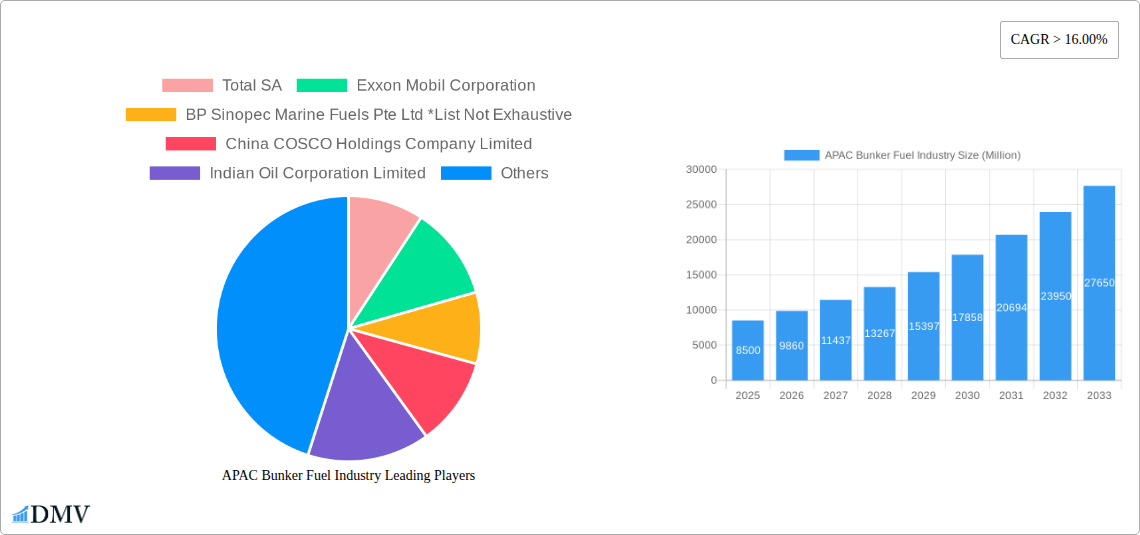
The APAC bunker fuel industry is a dynamic and evolving sector, critical to global maritime trade. Market concentration is notably influenced by the presence of major integrated energy companies and specialized marine fuel providers. Key players like Total SA, Exxon Mobil Corporation, BP Sinopec Marine Fuels Pte Ltd, China COSCO Holdings Company Limited, Indian Oil Corporation Limited, Royal Dutch Shell PLC, Ocean Network Express PTE Ltd, and Chimbusco Pan Nation Petro-Chemical Co Ltd are shaping the competitive landscape. Innovation is driven by the urgent need for cleaner fuel alternatives, spurred by stringent environmental regulations such as IMO 2020 and ongoing discussions around decarbonization. Regulatory landscapes are characterized by a patchwork of national and regional mandates concerning sulfur content, emissions, and port regulations. Substitute products, primarily focusing on Liquefied Natural Gas (LNG) and emerging alternative fuels like methanol and ammonia, are gaining traction. End-user profiles are diverse, encompassing container ships, tankers, general cargo vessels, and bulk carriers, each with unique fuel consumption patterns and preferences. Merger and acquisition (M&A) activities are indicative of strategic consolidation and expansion, with estimated deal values in the billions of dollars over the study period. This ongoing evolution underscores a market poised for significant transformation.
- Market Share Distribution: Driven by demand from major maritime hubs like Singapore, China, and India, alongside the broader Rest of Asia-Pacific region.
- M&A Deal Values: Anticipated to exceed $XX Million within the forecast period, reflecting strategic investments and consolidation among key market participants.
- Regulatory Impact: Significant influence on fuel type adoption, particularly the shift towards Very-Low Sulfur Fuel Oil (VLSFO) and the exploration of cleaner alternatives.
APAC Bunker Fuel Industry Industry Evolution
The APAC bunker fuel industry has witnessed a profound evolution over the historical period of 2019–2024, driven by a confluence of regulatory pressures, technological advancements, and shifting consumer demands. The implementation of the International Maritime Organization's (IMO) 2020 regulation, mandating a global sulfur cap of 0.5%, served as a watershed moment, fundamentally altering fuel consumption patterns and market dynamics. This led to a significant reduction in the demand for High Sulfur Fuel Oil (HSFO) and a surge in the adoption of Very-Low Sulfur Fuel Oil (VLSFO). The base year of 2025 is a crucial juncture, representing a mature phase of VLSFO dominance and the accelerating exploration and adoption of alternative fuels. Market growth trajectories, meticulously analyzed through the study period extending to 2033, are projected to experience a compound annual growth rate (CAGR) of approximately 4-6%, fueled by the expansion of global trade and the increasing size of vessel fleets.
Technological advancements have been pivotal. The development of scrubbers for exhaust gas cleaning has allowed some vessels to continue using HSFO, though its market share has diminished. More importantly, the industry is witnessing substantial investment in infrastructure and technology to support the bunkering of Liquefied Natural Gas (LNG), which has seen its adoption rate climb steadily. Marine Gas Oil (MGO) remains a significant segment, particularly for smaller vessels and in specific regulatory zones. Consumer demand is increasingly prioritizing not just cost-effectiveness but also environmental compliance and the long-term sustainability of fuel options. Shipping companies are actively seeking fuel solutions that align with their environmental, social, and governance (ESG) commitments. This evolving demand landscape is pushing fuel suppliers to diversify their offerings and invest in research and development for future-proof fuels like methanol and ammonia. The forecast period (2025–2033) is anticipated to see a more pronounced shift towards decarbonization, with LNG gaining further traction and the initial stages of adoption for next-generation alternative fuels becoming more evident. The industry's ability to adapt to these technological shifts and anticipate future regulatory changes will be paramount to its sustained growth and success.
Leading Regions, Countries, or Segments in APAC Bunker Fuel Industry
The APAC bunker fuel industry landscape is dominated by several key regions and countries, with specific fuel types and vessel segments playing crucial roles in its overall composition. Singapore stands out as the preeminent global bunkering hub, consistently handling the largest volumes of bunker fuel in the Asia-Pacific region and often worldwide. Its strategic location, world-class port infrastructure, competitive pricing, and robust regulatory framework make it an indispensable player. China, with its massive manufacturing base and expanding maritime trade, is another colossal market for bunker fuels. Its significant investments in port modernization and a growing domestic shipping fleet contribute to its substantial demand. India, also a major maritime nation with a burgeoning economy, represents another critical growth region, with increasing demand across its major ports. The "Rest of Asia-Pacific" encompasses a diverse array of rapidly developing economies and maritime nations, each contributing to the aggregate demand for bunker fuel.
Within this geographical expanse, the fuel type segments are undergoing significant transformation. While High Sulfur Fuel Oil (HSFO) was historically dominant, its market share has dramatically declined due to stringent environmental regulations like IMO 2020. Very-Low Sulfur Fuel Oil (VLSFO) has emerged as the current workhorse, mandated for widespread use and representing a substantial portion of the market. Marine Gas Oil (MGO) continues to be a vital segment, especially for certain vessel types and in emissions control areas. Liquefied Natural Gas (LNG) is experiencing rapid growth as a cleaner-burning alternative, with significant investments in bunkering infrastructure across major ports in China and Singapore. The "Others" category, encompassing emerging fuels like methanol and ammonia, is still in its nascent stages but holds immense future potential.
The dominant vessel types contributing to this demand are Containers and Tankers, driven by the global trade of manufactured goods and the transportation of oil and gas respectively. Bulk Carriers, vital for the movement of raw materials like iron ore and coal, also represent a significant demand segment. General Cargo vessels, while comprising a larger number of individual units, generally have lower individual fuel consumption compared to the larger vessel classes.
- Key Drivers in Singapore:
- Strategic Location: Situated on major shipping lanes, offering unparalleled access for vessels traversing the Indo-Pacific.
- World-Class Infrastructure: Advanced port facilities, efficient bunkering operations, and a deep natural harbor.
- Competitive Pricing and Availability: A highly competitive market with diverse suppliers ensures attractive pricing and consistent availability.
- Regulatory Excellence: A stable and transparent regulatory environment that fosters trust and efficiency.
- Key Drivers in China:
- Massive Manufacturing Hub: Drives significant inbound and outbound cargo, requiring extensive shipping activity.
- Growing Domestic Fleet: Significant investment in expanding and modernizing China's national shipping capabilities.
- Port Modernization: Continuous upgrades to port infrastructure, including advanced bunkering facilities.
- Government Support: Strategic initiatives and policies aimed at bolstering the maritime sector.
- Key Drivers for VLSFO:
- IMO 2020 Compliance: The primary driver for the widespread adoption of VLSFO as a regulatory necessity.
- Availability and Infrastructure: Established global supply chains and bunkering infrastructure readily support VLSFO.
- Cost-Effectiveness (Relative to Alternatives): While more expensive than HSFO, it has remained a cost-effective compliance solution compared to some newer alternatives.
- Key Drivers for LNG:
- Environmental Regulations: Increasingly stringent emissions standards drive demand for cleaner fuels.
- Lower Emissions Profile: Significantly reduces SOx, NOx, and particulate matter emissions compared to traditional fuels.
- Growing LNG Bunkering Infrastructure: Investments in LNG terminals and bunkering vessels are expanding availability.
- Long-Term Sustainability Goals: Shipping companies looking to meet future decarbonization targets.
APAC Bunker Fuel Industry Product Innovations
Product innovations in the APAC bunker fuel industry are primarily focused on enhancing sustainability and efficiency. The transition to Very-Low Sulfur Fuel Oil (VLSFO) has been a significant innovation, driven by regulatory mandates, offering a compliant alternative to traditional high-sulfur fuels. Further advancements are seen in the development and optimization of Liquefied Natural Gas (LNG) as a marine fuel, with innovations in storage, handling, and bunkering technologies. Emerging research and development are dedicated to alternative fuels such as methanol and ammonia, with pilot projects and strategic partnerships exploring their viability for large-scale maritime application. These innovations aim to reduce greenhouse gas emissions, improve air quality, and provide a pathway towards decarbonization for the shipping sector. Performance metrics are increasingly evaluated not just on energy content and price, but also on their environmental footprint and operational safety.
Propelling Factors for APAC Bunker Fuel Industry Growth
The APAC bunker fuel industry is propelled by several key growth drivers, fundamentally reshaping its trajectory. Technologically, the ongoing development and adoption of cleaner fuels like LNG, methanol, and ammonia are creating new market opportunities and driving demand for specialized bunkering infrastructure. Economically, the robust growth of global trade, with Asia-Pacific at its epicenter, continues to fuel the demand for maritime transport, thus increasing the need for bunker fuels. Government policies and regulations play a crucial role; stringent environmental mandates, such as those aimed at reducing sulfur emissions and greenhouse gases, are accelerating the transition to more sustainable fuel options. For instance, the widespread adoption of VLSFO was a direct consequence of IMO 2020. Furthermore, investments in port infrastructure and logistical networks across the region are enhancing the efficiency and capacity of the bunker fuel supply chain.
Obstacles in the APAC Bunker Fuel Industry Market
Despite robust growth, the APAC bunker fuel industry faces significant obstacles. Regulatory challenges persist, particularly the varying pace and interpretation of environmental regulations across different countries, creating compliance complexities for global shipping fleets. Supply chain disruptions, exacerbated by geopolitical events and logistical bottlenecks, can lead to price volatility and availability issues for critical fuel types. The high cost of transitioning to cleaner fuels, such as LNG and emerging alternatives, presents a considerable barrier for many operators, requiring substantial capital investment in new vessel designs and bunkering infrastructure. Furthermore, the limited availability of alternative fuel bunkering facilities in certain regions restricts their widespread adoption. The competitive pressure from established players and the need to develop robust safety protocols for new fuel types also contribute to market restraints.
Future Opportunities in APAC Bunker Fuel Industry
The APAC bunker fuel industry is ripe with future opportunities, largely driven by the global imperative for decarbonization. The increasing adoption of Liquefied Natural Gas (LNG) presents a significant near-to-medium term opportunity, with ongoing investments in bunkering infrastructure across key Asian ports. The development and eventual large-scale adoption of methanol and ammonia as marine fuels represent substantial long-term opportunities, creating demand for new supply chains, handling technologies, and specialized bunkering services. The expansion of "green" shipping corridors and the growing demand for sustainable shipping practices by cargo owners are also creating lucrative market niches. Furthermore, advancements in fuel cell technology for maritime applications could revolutionize fuel consumption patterns. Embracing these emerging technologies and adapting to evolving consumer trends towards sustainability will be crucial for capitalizing on future market potential.
Major Players in the APAC Bunker Fuel Industry Ecosystem
- Total SA
- Exxon Mobil Corporation
- BP Sinopec Marine Fuels Pte Ltd
- China COSCO Holdings Company Limited
- Indian Oil Corporation Limited
- Royal Dutch Shell PLC
- Ocean Network Express PTE Ltd
- Chimbusco Pan Nation Petro-Chemical Co Ltd
Key Developments in APAC Bunker Fuel Industry Industry
- 2023/11: Major shipping lines announce increased investment in methanol-powered vessels, signaling growing confidence in the fuel's future.
- 2023/10: Singapore expands its LNG bunkering capabilities with the launch of a new bunkering vessel, enhancing supply for cleaner fuels.
- 2023/09: Several Asian ports collaborate to establish emission reduction targets and promote the adoption of sustainable marine fuels.
- 2023/08: An agreement is reached on the development of ammonia bunkering standards in a key Asian maritime hub.
- 2023/07: Indian Oil Corporation Limited announces significant expansion plans for its marine fuel network to support growing demand.
- 2023/06: Shell and Exxon Mobil form strategic partnerships to explore and develop low-carbon fuel solutions for the maritime sector.
- 2023/05: China COSCO Holdings Company Limited deploys new dual-fuel vessels capable of running on LNG, reflecting its commitment to cleaner shipping.
- 2022/12: IMO further discusses stricter greenhouse gas emission reduction targets for the shipping industry, intensifying the push for alternative fuels.
- 2022/08: Very-Low Sulfur Fuel Oil (VLSFO) cements its position as the dominant fuel type following widespread compliance with IMO 2020 regulations.
- 2022/04: Ocean Network Express PTE Ltd announces its commitment to exploring sustainable fuel options, including biofuels and LNG.
Strategic APAC Bunker Fuel Industry Market Forecast
The strategic APAC bunker fuel industry forecast indicates a period of sustained growth and significant transformation, driven by an accelerated shift towards decarbonization and technological innovation. The increasing adoption of Liquefied Natural Gas (LNG) will continue to be a dominant trend, supported by expanding bunkering infrastructure across key maritime hubs like Singapore and China. Emerging alternative fuels, including methanol and ammonia, are poised to gain traction, presenting substantial long-term market potential as research, development, and infrastructure capabilities mature. Enhanced regulatory frameworks and a growing demand for green shipping solutions from cargo owners will further propel the adoption of these cleaner fuels. Investments in port modernization and the optimization of supply chains will be critical for supporting this evolving market landscape. The industry is expected to witness strategic collaborations and consolidations among major players to secure market share and drive innovation in sustainable fuel solutions, ensuring a more environmentally conscious and resilient maritime future.
APAC Bunker Fuel Industry Segmentation
-
1. Fuel Type
- 1.1. High Sulfur Fuel Oil (HSFO)
- 1.2. Very-Low Sulfur Fuel Oil (VLSFO)
- 1.3. Marine Gas Oil (MGO)
- 1.4. Liquefied Natural Gas (MGO)
- 1.5. Others
-
2. Vessel Type
- 2.1. Containers
- 2.2. Tankers
- 2.3. General Cargo
- 2.4. Bulk Carrier
- 2.5. Others
-
3. Geography
- 3.1. China
- 3.2. India
- 3.3. Singapore
- 3.4. Rest of Asia-Pacific
APAC Bunker Fuel Industry Segmentation By Geography
- 1. China
- 2. India
- 3. Singapore
- 4. Rest of Asia Pacific
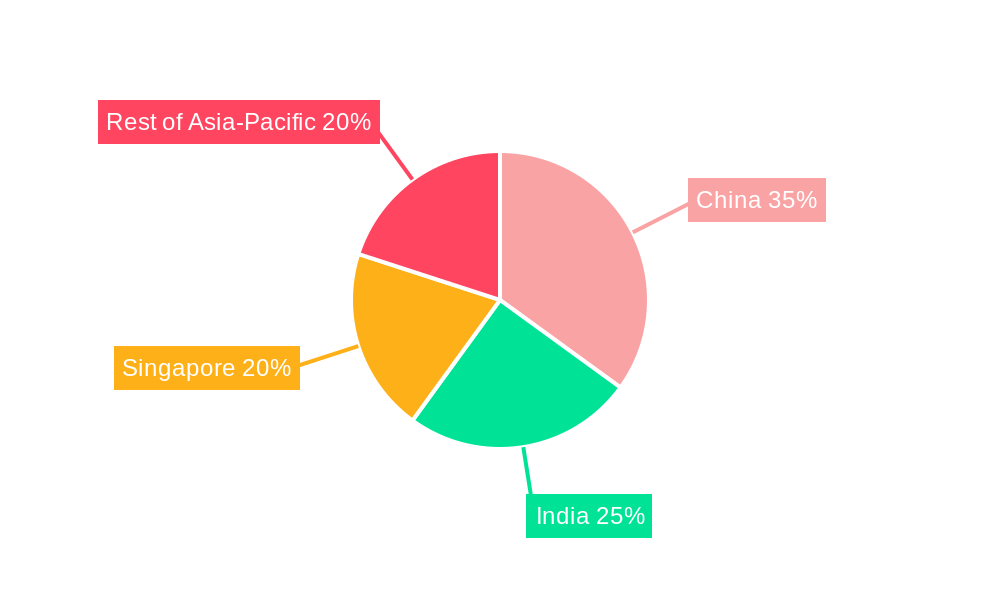
APAC Bunker Fuel Industry Regional Market Share
Geographic Coverage of APAC Bunker Fuel Industry
APAC Bunker Fuel Industry REPORT HIGHLIGHTS
| Aspects | Details |
|---|---|
| Study Period | 2020-2034 |
| Base Year | 2025 |
| Estimated Year | 2026 |
| Forecast Period | 2026-2034 |
| Historical Period | 2020-2025 |
| Growth Rate | CAGR of 5.8% from 2020-2034 |
| Segmentation |
|
Table of Contents
- 1. Introduction
- 1.1. Research Scope
- 1.2. Market Segmentation
- 1.3. Research Objective
- 1.4. Definitions and Assumptions
- 2. Executive Summary
- 2.1. Market Snapshot
- 3. Market Dynamics
- 3.1. Market Drivers
- 3.2. Market Restrains
- 3.3. Market Trends
- 3.4. Market Opportunities
- 4. Market Factor Analysis
- 4.1. Porters Five Forces
- 4.1.1. Bargaining Power of Suppliers
- 4.1.2. Bargaining Power of Buyers
- 4.1.3. Threat of New Entrants
- 4.1.4. Threat of Substitutes
- 4.1.5. Competitive Rivalry
- 4.2. PESTEL analysis
- 4.3. BCG Analysis
- 4.3.1. Stars (High Growth, High Market Share)
- 4.3.2. Cash Cows (Low Growth, High Market Share)
- 4.3.3. Question Mark (High Growth, Low Market Share)
- 4.3.4. Dogs (Low Growth, Low Market Share)
- 4.4. Ansoff Matrix Analysis
- 4.5. Supply Chain Analysis
- 4.6. Regulatory Landscape
- 4.7. Current Market Potential and Opportunity Assessment (TAM–SAM–SOM Framework)
- 4.8. DMV Analyst Note
- 4.1. Porters Five Forces
- 5. Market Analysis, Insights and Forecast 2021-2033
- 5.1. Market Analysis, Insights and Forecast - by Fuel Type
- 5.1.1. High Sulfur Fuel Oil (HSFO)
- 5.1.2. Very-Low Sulfur Fuel Oil (VLSFO)
- 5.1.3. Marine Gas Oil (MGO)
- 5.1.4. Liquefied Natural Gas (MGO)
- 5.1.5. Others
- 5.2. Market Analysis, Insights and Forecast - by Vessel Type
- 5.2.1. Containers
- 5.2.2. Tankers
- 5.2.3. General Cargo
- 5.2.4. Bulk Carrier
- 5.2.5. Others
- 5.3. Market Analysis, Insights and Forecast - by Geography
- 5.3.1. China
- 5.3.2. India
- 5.3.3. Singapore
- 5.3.4. Rest of Asia-Pacific
- 5.4. Market Analysis, Insights and Forecast - by Region
- 5.4.1. China
- 5.4.2. India
- 5.4.3. Singapore
- 5.4.4. Rest of Asia Pacific
- 5.1. Market Analysis, Insights and Forecast - by Fuel Type
- 6. Global APAC Bunker Fuel Industry Analysis, Insights and Forecast, 2021-2033
- 6.1. Market Analysis, Insights and Forecast - by Fuel Type
- 6.1.1. High Sulfur Fuel Oil (HSFO)
- 6.1.2. Very-Low Sulfur Fuel Oil (VLSFO)
- 6.1.3. Marine Gas Oil (MGO)
- 6.1.4. Liquefied Natural Gas (MGO)
- 6.1.5. Others
- 6.2. Market Analysis, Insights and Forecast - by Vessel Type
- 6.2.1. Containers
- 6.2.2. Tankers
- 6.2.3. General Cargo
- 6.2.4. Bulk Carrier
- 6.2.5. Others
- 6.3. Market Analysis, Insights and Forecast - by Geography
- 6.3.1. China
- 6.3.2. India
- 6.3.3. Singapore
- 6.3.4. Rest of Asia-Pacific
- 6.1. Market Analysis, Insights and Forecast - by Fuel Type
- 7. China APAC Bunker Fuel Industry Analysis, Insights and Forecast, 2020-2032
- 7.1. Market Analysis, Insights and Forecast - by Fuel Type
- 7.1.1. High Sulfur Fuel Oil (HSFO)
- 7.1.2. Very-Low Sulfur Fuel Oil (VLSFO)
- 7.1.3. Marine Gas Oil (MGO)
- 7.1.4. Liquefied Natural Gas (MGO)
- 7.1.5. Others
- 7.2. Market Analysis, Insights and Forecast - by Vessel Type
- 7.2.1. Containers
- 7.2.2. Tankers
- 7.2.3. General Cargo
- 7.2.4. Bulk Carrier
- 7.2.5. Others
- 7.3. Market Analysis, Insights and Forecast - by Geography
- 7.3.1. China
- 7.3.2. India
- 7.3.3. Singapore
- 7.3.4. Rest of Asia-Pacific
- 7.1. Market Analysis, Insights and Forecast - by Fuel Type
- 8. India APAC Bunker Fuel Industry Analysis, Insights and Forecast, 2020-2032
- 8.1. Market Analysis, Insights and Forecast - by Fuel Type
- 8.1.1. High Sulfur Fuel Oil (HSFO)
- 8.1.2. Very-Low Sulfur Fuel Oil (VLSFO)
- 8.1.3. Marine Gas Oil (MGO)
- 8.1.4. Liquefied Natural Gas (MGO)
- 8.1.5. Others
- 8.2. Market Analysis, Insights and Forecast - by Vessel Type
- 8.2.1. Containers
- 8.2.2. Tankers
- 8.2.3. General Cargo
- 8.2.4. Bulk Carrier
- 8.2.5. Others
- 8.3. Market Analysis, Insights and Forecast - by Geography
- 8.3.1. China
- 8.3.2. India
- 8.3.3. Singapore
- 8.3.4. Rest of Asia-Pacific
- 8.1. Market Analysis, Insights and Forecast - by Fuel Type
- 9. Singapore APAC Bunker Fuel Industry Analysis, Insights and Forecast, 2020-2032
- 9.1. Market Analysis, Insights and Forecast - by Fuel Type
- 9.1.1. High Sulfur Fuel Oil (HSFO)
- 9.1.2. Very-Low Sulfur Fuel Oil (VLSFO)
- 9.1.3. Marine Gas Oil (MGO)
- 9.1.4. Liquefied Natural Gas (MGO)
- 9.1.5. Others
- 9.2. Market Analysis, Insights and Forecast - by Vessel Type
- 9.2.1. Containers
- 9.2.2. Tankers
- 9.2.3. General Cargo
- 9.2.4. Bulk Carrier
- 9.2.5. Others
- 9.3. Market Analysis, Insights and Forecast - by Geography
- 9.3.1. China
- 9.3.2. India
- 9.3.3. Singapore
- 9.3.4. Rest of Asia-Pacific
- 9.1. Market Analysis, Insights and Forecast - by Fuel Type
- 10. Rest of Asia Pacific APAC Bunker Fuel Industry Analysis, Insights and Forecast, 2020-2032
- 10.1. Market Analysis, Insights and Forecast - by Fuel Type
- 10.1.1. High Sulfur Fuel Oil (HSFO)
- 10.1.2. Very-Low Sulfur Fuel Oil (VLSFO)
- 10.1.3. Marine Gas Oil (MGO)
- 10.1.4. Liquefied Natural Gas (MGO)
- 10.1.5. Others
- 10.2. Market Analysis, Insights and Forecast - by Vessel Type
- 10.2.1. Containers
- 10.2.2. Tankers
- 10.2.3. General Cargo
- 10.2.4. Bulk Carrier
- 10.2.5. Others
- 10.3. Market Analysis, Insights and Forecast - by Geography
- 10.3.1. China
- 10.3.2. India
- 10.3.3. Singapore
- 10.3.4. Rest of Asia-Pacific
- 10.1. Market Analysis, Insights and Forecast - by Fuel Type
- 11. Competitive Analysis
- 11.1. Company Profiles
- 11.1.1 Total SA
- 11.1.1.1. Company Overview
- 11.1.1.2. Products
- 11.1.1.3. Company Financials
- 11.1.1.4. SWOT Analysis
- 11.1.2 Exxon Mobil Corporation
- 11.1.2.1. Company Overview
- 11.1.2.2. Products
- 11.1.2.3. Company Financials
- 11.1.2.4. SWOT Analysis
- 11.1.3 BP Sinopec Marine Fuels Pte Ltd *List Not Exhaustive
- 11.1.3.1. Company Overview
- 11.1.3.2. Products
- 11.1.3.3. Company Financials
- 11.1.3.4. SWOT Analysis
- 11.1.4 China COSCO Holdings Company Limited
- 11.1.4.1. Company Overview
- 11.1.4.2. Products
- 11.1.4.3. Company Financials
- 11.1.4.4. SWOT Analysis
- 11.1.5 Indian Oil Corporation Limited
- 11.1.5.1. Company Overview
- 11.1.5.2. Products
- 11.1.5.3. Company Financials
- 11.1.5.4. SWOT Analysis
- 11.1.6 Royal Dutch Shell PLC
- 11.1.6.1. Company Overview
- 11.1.6.2. Products
- 11.1.6.3. Company Financials
- 11.1.6.4. SWOT Analysis
- 11.1.7 Ocean Network Express PTE Ltd
- 11.1.7.1. Company Overview
- 11.1.7.2. Products
- 11.1.7.3. Company Financials
- 11.1.7.4. SWOT Analysis
- 11.1.8 Chimbusco Pan Nation Petro-Chemical Co Ltd
- 11.1.8.1. Company Overview
- 11.1.8.2. Products
- 11.1.8.3. Company Financials
- 11.1.8.4. SWOT Analysis
- 11.1.1 Total SA
- 11.2. Market Entropy
- 11.2.1 Company's Key Areas Served
- 11.2.2 Recent Developments
- 11.3. Company Market Share Analysis 2025
- 11.3.1 Top 5 Companies Market Share Analysis
- 11.3.2 Top 3 Companies Market Share Analysis
- 11.4. List of Potential Customers
- 12. Research Methodology
List of Figures
- Figure 1: Global APAC Bunker Fuel Industry Revenue Breakdown (billion, %) by Region 2025 & 2033
- Figure 2: China APAC Bunker Fuel Industry Revenue (billion), by Fuel Type 2025 & 2033
- Figure 3: China APAC Bunker Fuel Industry Revenue Share (%), by Fuel Type 2025 & 2033
- Figure 4: China APAC Bunker Fuel Industry Revenue (billion), by Vessel Type 2025 & 2033
- Figure 5: China APAC Bunker Fuel Industry Revenue Share (%), by Vessel Type 2025 & 2033
- Figure 6: China APAC Bunker Fuel Industry Revenue (billion), by Geography 2025 & 2033
- Figure 7: China APAC Bunker Fuel Industry Revenue Share (%), by Geography 2025 & 2033
- Figure 8: China APAC Bunker Fuel Industry Revenue (billion), by Country 2025 & 2033
- Figure 9: China APAC Bunker Fuel Industry Revenue Share (%), by Country 2025 & 2033
- Figure 10: India APAC Bunker Fuel Industry Revenue (billion), by Fuel Type 2025 & 2033
- Figure 11: India APAC Bunker Fuel Industry Revenue Share (%), by Fuel Type 2025 & 2033
- Figure 12: India APAC Bunker Fuel Industry Revenue (billion), by Vessel Type 2025 & 2033
- Figure 13: India APAC Bunker Fuel Industry Revenue Share (%), by Vessel Type 2025 & 2033
- Figure 14: India APAC Bunker Fuel Industry Revenue (billion), by Geography 2025 & 2033
- Figure 15: India APAC Bunker Fuel Industry Revenue Share (%), by Geography 2025 & 2033
- Figure 16: India APAC Bunker Fuel Industry Revenue (billion), by Country 2025 & 2033
- Figure 17: India APAC Bunker Fuel Industry Revenue Share (%), by Country 2025 & 2033
- Figure 18: Singapore APAC Bunker Fuel Industry Revenue (billion), by Fuel Type 2025 & 2033
- Figure 19: Singapore APAC Bunker Fuel Industry Revenue Share (%), by Fuel Type 2025 & 2033
- Figure 20: Singapore APAC Bunker Fuel Industry Revenue (billion), by Vessel Type 2025 & 2033
- Figure 21: Singapore APAC Bunker Fuel Industry Revenue Share (%), by Vessel Type 2025 & 2033
- Figure 22: Singapore APAC Bunker Fuel Industry Revenue (billion), by Geography 2025 & 2033
- Figure 23: Singapore APAC Bunker Fuel Industry Revenue Share (%), by Geography 2025 & 2033
- Figure 24: Singapore APAC Bunker Fuel Industry Revenue (billion), by Country 2025 & 2033
- Figure 25: Singapore APAC Bunker Fuel Industry Revenue Share (%), by Country 2025 & 2033
- Figure 26: Rest of Asia Pacific APAC Bunker Fuel Industry Revenue (billion), by Fuel Type 2025 & 2033
- Figure 27: Rest of Asia Pacific APAC Bunker Fuel Industry Revenue Share (%), by Fuel Type 2025 & 2033
- Figure 28: Rest of Asia Pacific APAC Bunker Fuel Industry Revenue (billion), by Vessel Type 2025 & 2033
- Figure 29: Rest of Asia Pacific APAC Bunker Fuel Industry Revenue Share (%), by Vessel Type 2025 & 2033
- Figure 30: Rest of Asia Pacific APAC Bunker Fuel Industry Revenue (billion), by Geography 2025 & 2033
- Figure 31: Rest of Asia Pacific APAC Bunker Fuel Industry Revenue Share (%), by Geography 2025 & 2033
- Figure 32: Rest of Asia Pacific APAC Bunker Fuel Industry Revenue (billion), by Country 2025 & 2033
- Figure 33: Rest of Asia Pacific APAC Bunker Fuel Industry Revenue Share (%), by Country 2025 & 2033
List of Tables
- Table 1: Global APAC Bunker Fuel Industry Revenue billion Forecast, by Fuel Type 2020 & 2033
- Table 2: Global APAC Bunker Fuel Industry Revenue billion Forecast, by Vessel Type 2020 & 2033
- Table 3: Global APAC Bunker Fuel Industry Revenue billion Forecast, by Geography 2020 & 2033
- Table 4: Global APAC Bunker Fuel Industry Revenue billion Forecast, by Region 2020 & 2033
- Table 5: Global APAC Bunker Fuel Industry Revenue billion Forecast, by Fuel Type 2020 & 2033
- Table 6: Global APAC Bunker Fuel Industry Revenue billion Forecast, by Vessel Type 2020 & 2033
- Table 7: Global APAC Bunker Fuel Industry Revenue billion Forecast, by Geography 2020 & 2033
- Table 8: Global APAC Bunker Fuel Industry Revenue billion Forecast, by Country 2020 & 2033
- Table 9: Global APAC Bunker Fuel Industry Revenue billion Forecast, by Fuel Type 2020 & 2033
- Table 10: Global APAC Bunker Fuel Industry Revenue billion Forecast, by Vessel Type 2020 & 2033
- Table 11: Global APAC Bunker Fuel Industry Revenue billion Forecast, by Geography 2020 & 2033
- Table 12: Global APAC Bunker Fuel Industry Revenue billion Forecast, by Country 2020 & 2033
- Table 13: Global APAC Bunker Fuel Industry Revenue billion Forecast, by Fuel Type 2020 & 2033
- Table 14: Global APAC Bunker Fuel Industry Revenue billion Forecast, by Vessel Type 2020 & 2033
- Table 15: Global APAC Bunker Fuel Industry Revenue billion Forecast, by Geography 2020 & 2033
- Table 16: Global APAC Bunker Fuel Industry Revenue billion Forecast, by Country 2020 & 2033
- Table 17: Global APAC Bunker Fuel Industry Revenue billion Forecast, by Fuel Type 2020 & 2033
- Table 18: Global APAC Bunker Fuel Industry Revenue billion Forecast, by Vessel Type 2020 & 2033
- Table 19: Global APAC Bunker Fuel Industry Revenue billion Forecast, by Geography 2020 & 2033
- Table 20: Global APAC Bunker Fuel Industry Revenue billion Forecast, by Country 2020 & 2033
Frequently Asked Questions
1. What is the projected Compound Annual Growth Rate (CAGR) of the APAC Bunker Fuel Industry?
The projected CAGR is approximately 5.8%.
2. Which companies are prominent players in the APAC Bunker Fuel Industry?
Key companies in the market include Total SA, Exxon Mobil Corporation, BP Sinopec Marine Fuels Pte Ltd *List Not Exhaustive, China COSCO Holdings Company Limited, Indian Oil Corporation Limited, Royal Dutch Shell PLC, Ocean Network Express PTE Ltd, Chimbusco Pan Nation Petro-Chemical Co Ltd.
3. What are the main segments of the APAC Bunker Fuel Industry?
The market segments include Fuel Type, Vessel Type, Geography.
4. Can you provide details about the market size?
The market size is estimated to be USD 83.9 billion as of 2022.
5. What are some drivers contributing to market growth?
Increasing Demand for Oil and Gas4.; Presence of Proven Oil and Gas Reserves.
6. What are the notable trends driving market growth?
VLSFO to Witness Significant Growth.
7. Are there any restraints impacting market growth?
Volatile Oil and Gas Prices.
8. Can you provide examples of recent developments in the market?
N/A
9. What pricing options are available for accessing the report?
Pricing options include single-user, multi-user, and enterprise licenses priced at USD 4750, USD 5250, and USD 8750 respectively.
10. Is the market size provided in terms of value or volume?
The market size is provided in terms of value, measured in billion.
11. Are there any specific market keywords associated with the report?
Yes, the market keyword associated with the report is "APAC Bunker Fuel Industry," which aids in identifying and referencing the specific market segment covered.
12. How do I determine which pricing option suits my needs best?
The pricing options vary based on user requirements and access needs. Individual users may opt for single-user licenses, while businesses requiring broader access may choose multi-user or enterprise licenses for cost-effective access to the report.
13. Are there any additional resources or data provided in the APAC Bunker Fuel Industry report?
While the report offers comprehensive insights, it's advisable to review the specific contents or supplementary materials provided to ascertain if additional resources or data are available.
14. How can I stay updated on further developments or reports in the APAC Bunker Fuel Industry?
To stay informed about further developments, trends, and reports in the APAC Bunker Fuel Industry, consider subscribing to industry newsletters, following relevant companies and organizations, or regularly checking reputable industry news sources and publications.
Methodology
Step 1 - Identification of Relevant Samples Size from Population Database


Step 2 - Approaches for Defining Global Market Size (Value, Volume* & Price*)

Note*: In applicable scenarios
Step 3 - Data Sources
Primary Research
- Web Analytics
- Survey Reports
- Research Institute
- Latest Research Reports
- Opinion Leaders
Secondary Research
- Annual Reports
- White Paper
- Latest Press Release
- Industry Association
- Paid Database
- Investor Presentations

Step 4 - Data Triangulation
Involves using different sources of information in order to increase the validity of a study
These sources are likely to be stakeholders in a program - participants, other researchers, program staff, other community members, and so on.
Then we put all data in single framework & apply various statistical tools to find out the dynamic on the market.
During the analysis stage, feedback from the stakeholder groups would be compared to determine areas of agreement as well as areas of divergence