

Key Insights
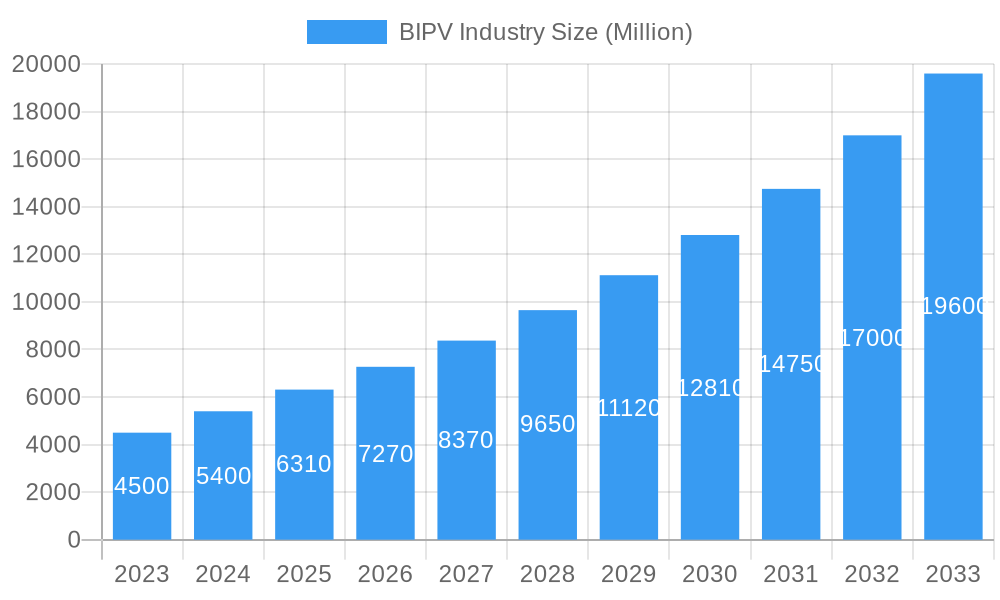
The Building-Integrated Photovoltaics (BIPV) market is poised for remarkable expansion, projected to reach an estimated USD 6.31 million by 2025. This growth is fueled by a robust Compound Annual Growth Rate (CAGR) of 14.79%, indicating a dynamic and rapidly evolving sector. The primary drivers behind this surge include increasing global demand for sustainable and renewable energy solutions, stringent government regulations promoting green building practices, and advancements in BIPV technology leading to more aesthetically pleasing and efficient products. As awareness of climate change intensifies and the economic benefits of solar energy become more apparent, the integration of photovoltaic technology into building envelopes is transitioning from a niche concept to a mainstream construction imperative. This trend is further amplified by the decreasing costs of solar components and the growing emphasis on energy independence for both residential and commercial properties.
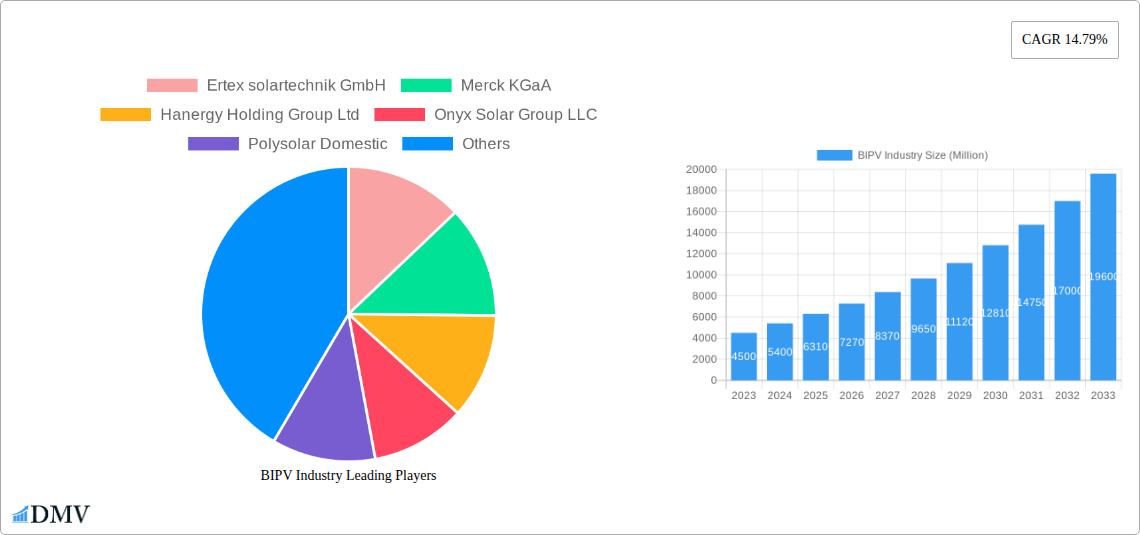
BIPV Industry Market Size (In Billion)
The BIPV market encompasses diverse segments, notably Thin-film PV and Crystalline PV, catering to a broad spectrum of end-users, including Residential, Commercial, and Industrial sectors. Innovations in materials science and manufacturing processes are continuously enhancing the performance and versatility of BIPV solutions, making them viable alternatives to traditional building materials. While the market enjoys strong growth, certain restraints, such as higher initial installation costs compared to conventional materials and the need for specialized installation expertise, are being actively addressed through technological advancements and supportive policy frameworks. Leading companies like Ertex solartechnik GmbH, Merck KGaA, and Hanergy Holding Group Ltd are at the forefront of innovation, driving the adoption of BIPV across key regions such as Asia Pacific, Europe, and North America. The expanding application of BIPV in new construction projects and retrofitting existing structures underscores its significant potential to contribute to a more sustainable built environment.
BIPV Industry Company Market Share
Dive deep into the rapidly evolving Building-Integrated Photovoltaics (BIPV) industry, a critical sector driving sustainable construction and renewable energy integration. This in-depth report, covering the study period of 2019–2033, with a base year and estimated year of 2025, and a forecast period from 2025–2033, analyzes the market's intricate dynamics, technological breakthroughs, and future trajectory. It provides unparalleled insights for stakeholders seeking to capitalize on the burgeoning solar PV integration market and green building solutions. With a focus on both thin-film PV and crystalline PV technologies, and examining applications across residential, commercial, and industrial end-user segments, this report is your definitive guide to the BIPV market size, BIPV market share, and BIPV market growth.
BIPV Industry Market Composition & Trends
The BIPV industry market exhibits a dynamic composition characterized by increasing market concentration driven by strategic alliances and a growing demand for aesthetically integrated renewable energy solutions. Innovation catalysts are primarily fueled by advancements in photovoltaic cell efficiency, material science, and the development of novel integration techniques, pushing the boundaries of what's possible in sustainable architecture. The regulatory landscape is a significant driver, with supportive government policies and incentives for green building and renewable energy adoption globally. Substitute products, such as conventional roofing materials and standalone solar panels, are being increasingly challenged by the superior value proposition of BIPV, which offers dual functionality of building material and energy generator. End-user profiles are diversifying, with a growing awareness and preference for sustainable living and operational cost savings among homeowners, businesses, and industrial facilities. Mergers and acquisitions (M&A) activities are on the rise, indicating consolidation within the sector and a push for market leadership, with recent deal values reaching into the hundreds of millions. The market share distribution is shifting as key players invest heavily in R&D and expanding production capabilities, anticipating significant future growth. Understanding these intricate market elements is crucial for navigating the competitive BIPV landscape.
BIPV Industry Industry Evolution
The BIPV industry has undergone a remarkable evolution, transforming from a niche concept to a mainstream driver of sustainable development. Over the historical period of 2019–2024, and projected through the forecast period of 2025–2033, the market has witnessed exponential growth trajectories. This expansion is largely attributed to continuous technological advancements, particularly in thin-film PV and crystalline PV technologies, which have led to improved energy conversion efficiencies, enhanced durability, and a wider range of aesthetic options. The shift in consumer demand towards environmentally conscious building practices and the increasing need for energy independence have further propelled adoption rates. Governments worldwide have recognized the potential of BIPV in achieving climate goals and have implemented supportive policies, incentives, and building codes that mandate or encourage the integration of solar energy solutions. This has spurred significant investment in research and development, leading to innovative products that seamlessly blend into building facades, roofs, and other structural elements. Market growth rates have consistently outperformed general construction sector growth, indicating a strong and sustainable upward trend. Adoption metrics reveal a significant increase in BIPV installations across residential, commercial, and industrial segments, reflecting a growing market readiness and a clear understanding of the long-term economic and environmental benefits. The industry's evolution is a testament to the successful integration of renewable energy technology with architectural design, paving the way for more sustainable and energy-efficient built environments.
Leading Regions, Countries, or Segments in BIPV Industry
The BIPV industry is experiencing dominant growth across various regions, driven by a confluence of factors that underscore the increasing adoption of integrated solar solutions. Among the Type segments, Crystalline PV currently holds a significant market share due to its established efficiency and declining costs, making it a popular choice for large-scale applications. However, Thin-film PV is rapidly gaining traction, particularly in specialized applications and where flexibility and aesthetics are paramount, offering a compelling alternative for unique architectural designs.
From an End User perspective, the Commercial and Industrial segments are leading the charge in BIPV adoption. This dominance is fueled by several key drivers:
- Investment Trends: Large corporations and industrial facilities are increasingly investing in renewable energy to reduce operational costs, meet corporate sustainability goals, and enhance their brand image. The dual functionality of BIPV – acting as both a building material and a power source – presents an attractive return on investment.
- Regulatory Support: Favorable government regulations, including tax incentives, feed-in tariffs, and renewable energy mandates in commercial and industrial sectors, significantly encourage BIPV installations. These policies create a more predictable and profitable investment environment.
- Energy Security: Businesses are seeking to enhance their energy security and reduce reliance on fluctuating grid prices, making on-site solar generation through BIPV a strategic advantage.
- Architectural Integration: The ability of BIPV to seamlessly integrate into building facades and roofing systems without compromising aesthetics is a crucial factor for commercial and industrial projects where visual appeal is important.
While the Residential segment is also growing, driven by increasing environmental awareness and the desire for energy independence among homeowners, the sheer scale of commercial and industrial projects, coupled with strong financial incentives, positions these sectors as the current frontrunners in the global BIPV market. Regions like Europe and North America are particularly strong due to robust policy frameworks and high adoption rates of sustainable building practices, further solidifying the dominance of the Commercial and Industrial end-user segments in the overall BIPV market.
BIPV Industry Product Innovations
Product innovations within the BIPV industry are revolutionizing how buildings generate and consume energy. Manufacturers are developing highly efficient and aesthetically versatile photovoltaic modules that can be integrated into a wide array of building elements, including facades, roofs, windows, and skylights. Unique selling propositions include the ability to customize colors, textures, and transparency, allowing architects and developers to achieve stunning visual designs without sacrificing energy generation capabilities. Technological advancements are focusing on improving the power output of thin-film PV technologies, making them more competitive with crystalline silicon. Furthermore, the development of self-cleaning coatings and enhanced weather resistance ensures longevity and reduced maintenance requirements, increasing the overall appeal and practicality of BIPV solutions. The integration of smart technologies for energy monitoring and management is also a key innovation, empowering building owners to optimize their energy production and consumption.
Propelling Factors for BIPV Industry Growth
The BIPV industry is propelled by a robust combination of technological, economic, and regulatory influences. Technologically, advancements in thin-film PV and crystalline PV efficiency, coupled with innovative manufacturing processes, are leading to more cost-effective and aesthetically pleasing products. Economically, the increasing cost of traditional energy sources and the declining cost of solar technology make BIPV an attractive long-term investment, offering significant savings on electricity bills and a hedge against energy price volatility. Regulatory influences, such as government incentives, tax credits, and stringent building codes mandating energy efficiency and renewable energy integration, are creating a favorable market environment. For example, supportive policies in regions like Europe and North America are directly driving the adoption of BIPV in new construction and renovation projects. The growing global emphasis on sustainability and reducing carbon footprints further fuels demand for green building solutions.
Obstacles in the BIPV Industry Market
Despite its promising growth, the BIPV industry faces several obstacles that restrain its full potential. Regulatory challenges, including complex permitting processes and the lack of standardized building codes specifically for BIPV integration in some regions, can slow down project development. Supply chain disruptions, particularly for specialized materials and components, can lead to increased costs and extended lead times. Competitive pressures from conventional building materials and the perceived higher upfront cost of BIPV compared to traditional solutions remain a barrier, even though the lifetime cost savings are often substantial. The nascency of some BIPV technologies also means that long-term performance data might be less extensive than for established technologies, impacting investor confidence. Quantifiable impacts of these obstacles can include project delays of up to 20% and initial cost premiums that can range from 10% to 30% over conventional building materials, although these are often offset by energy savings.
Future Opportunities in BIPV Industry
The BIPV industry is ripe with emerging opportunities, poised for substantial expansion. New markets are opening up in developing economies with rapidly growing urban infrastructure and increasing demand for sustainable energy solutions. Technological advancements are creating opportunities in areas like transparent PV for windows and building facades, flexible PV for curved surfaces, and smart BIPV systems that integrate seamlessly with building management systems. Consumer trends are shifting towards net-zero energy buildings and a greater appreciation for the aesthetic integration of renewable energy, creating demand for customized and high-performance BIPV products. Furthermore, the increasing focus on the circular economy presents opportunities for BIPV manufacturers to develop products with improved recyclability and extended lifespans, appealing to environmentally conscious consumers and corporations. The potential for integration with energy storage solutions also opens new avenues for BIPV systems to provide reliable and resilient power.
Major Players in the BIPV Industry Ecosystem
- Ertex solartechnik GmbH
- Merck KGaA
- Hanergy Holding Group Ltd
- Onyx Solar Group LLC
- Polysolar Domestic
- Nanoflex Power Corporation
- Solarday
- AGC Inc
- Changzhou Almaden Co Ltd
- Issol SA
Key Developments in BIPV Industry Industry
- April 2023: ArcelorMittal announced joining forces with BP2 to supply low carbon-emissions steel for BP2's new product, the SOLROOF integrated photovoltaic roof. BP2's integrated photovoltaic FIT VOLT panels will likely be produced solely using XCarb recycled and renewably produced steel, obtained using a minimum of 75% scrap steel and providing 100% renewable electricity. This development signals a significant step towards sustainable material sourcing in the BIPV sector, impacting supply chain sustainability and environmental claims.
- September 2022: Saint-Gobain announced a strategic partnership with Megasol, a Swiss building-integrated photovoltaics (BIPV) module manufacturer. Under the agreement, Saint-Gobain acquired a minority stake in the company's BIPV module development and production business at its site in Switzerland. This collaboration enhances the capabilities and market reach of both companies, potentially leading to new product development and expanded market penetration in the European BIPV landscape.
Strategic BIPV Industry Market Forecast
The BIPV industry is on a trajectory for robust and sustained growth, driven by a confluence of strategic market forecasts. The increasing global imperative for decarbonization and sustainable construction, coupled with supportive government policies and incentives worldwide, will continue to be significant growth catalysts. Technological innovations in thin-film PV and crystalline PV are making BIPV more efficient, aesthetically versatile, and cost-competitive, expanding its appeal across residential, commercial, and industrial sectors. The market potential is immense as BIPV transitions from a niche product to an integral component of modern architecture, contributing significantly to energy independence and reduced environmental impact. As concerns about climate change intensify and energy prices remain volatile, the demand for integrated renewable energy solutions within the built environment is set to surge, making BIPV a cornerstone of future urban development and energy infrastructure.
BIPV Industry Segmentation
-
1. Type
- 1.1. Thin-film PV
- 1.2. Crystalline PV
-
2. End User
- 2.1. Residential
- 2.2. Commercial and Industrial
BIPV Industry Segmentation By Geography
-
1. North America
- 1.1. United States
- 1.2. Canada
- 1.3. Rest of North America
-
2. Europe
- 2.1. Germany
- 2.2. France
- 2.3. United Kingdom
- 2.4. Turkey
- 2.5. Spain
- 2.6. NORDIC
- 2.7. Russia
- 2.8. Rest of Europe
-
3. Asia Pacific
- 3.1. China
- 3.2. India
- 3.3. Japan
- 3.4. South Korea
- 3.5. Malaysia
- 3.6. Thailand
- 3.7. Indonesia
- 3.8. Vietnam
- 3.9. Rest of Asia Pacific
-
4. South America
- 4.1. Brazil
- 4.2. Argentina
- 4.3. Colombia
- 4.4. Rest of South America
-
5. Middle East and Africa
- 5.1. Saudi Arabia
- 5.2. United Arab Emirates
- 5.3. South Africa
- 5.4. Nigeria
- 5.5. Qatar
- 5.6. Egypt
- 5.7. Rest of Middle East and Africa
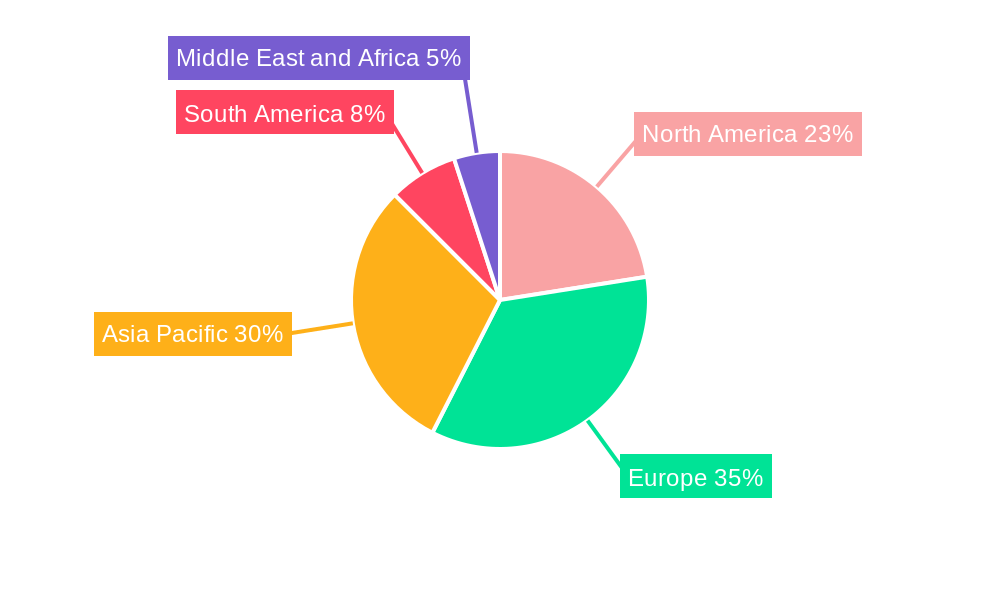
BIPV Industry Regional Market Share
Geographic Coverage of BIPV Industry
BIPV Industry REPORT HIGHLIGHTS
| Aspects | Details |
|---|---|
| Study Period | 2020-2034 |
| Base Year | 2025 |
| Estimated Year | 2026 |
| Forecast Period | 2026-2034 |
| Historical Period | 2020-2025 |
| Growth Rate | CAGR of 14.79% from 2020-2034 |
| Segmentation |
|
Table of Contents
- 1. Introduction
- 1.1. Research Scope
- 1.2. Market Segmentation
- 1.3. Research Objective
- 1.4. Definitions and Assumptions
- 2. Executive Summary
- 2.1. Market Snapshot
- 3. Market Dynamics
- 3.1. Market Drivers
- 3.2. Market Restrains
- 3.3. Market Trends
- 3.4. Market Opportunities
- 4. Market Factor Analysis
- 4.1. Porters Five Forces
- 4.1.1. Bargaining Power of Suppliers
- 4.1.2. Bargaining Power of Buyers
- 4.1.3. Threat of New Entrants
- 4.1.4. Threat of Substitutes
- 4.1.5. Competitive Rivalry
- 4.2. PESTEL analysis
- 4.3. BCG Analysis
- 4.3.1. Stars (High Growth, High Market Share)
- 4.3.2. Cash Cows (Low Growth, High Market Share)
- 4.3.3. Question Mark (High Growth, Low Market Share)
- 4.3.4. Dogs (Low Growth, Low Market Share)
- 4.4. Ansoff Matrix Analysis
- 4.5. Supply Chain Analysis
- 4.6. Regulatory Landscape
- 4.7. Current Market Potential and Opportunity Assessment (TAM–SAM–SOM Framework)
- 4.8. DMV Analyst Note
- 4.1. Porters Five Forces
- 5. Market Analysis, Insights and Forecast 2021-2033
- 5.1. Market Analysis, Insights and Forecast - by Type
- 5.1.1. Thin-film PV
- 5.1.2. Crystalline PV
- 5.2. Market Analysis, Insights and Forecast - by End User
- 5.2.1. Residential
- 5.2.2. Commercial and Industrial
- 5.3. Market Analysis, Insights and Forecast - by Region
- 5.3.1. North America
- 5.3.2. Europe
- 5.3.3. Asia Pacific
- 5.3.4. South America
- 5.3.5. Middle East and Africa
- 5.1. Market Analysis, Insights and Forecast - by Type
- 6. Global BIPV Industry Analysis, Insights and Forecast, 2021-2033
- 6.1. Market Analysis, Insights and Forecast - by Type
- 6.1.1. Thin-film PV
- 6.1.2. Crystalline PV
- 6.2. Market Analysis, Insights and Forecast - by End User
- 6.2.1. Residential
- 6.2.2. Commercial and Industrial
- 6.1. Market Analysis, Insights and Forecast - by Type
- 7. North America BIPV Industry Analysis, Insights and Forecast, 2020-2032
- 7.1. Market Analysis, Insights and Forecast - by Type
- 7.1.1. Thin-film PV
- 7.1.2. Crystalline PV
- 7.2. Market Analysis, Insights and Forecast - by End User
- 7.2.1. Residential
- 7.2.2. Commercial and Industrial
- 7.1. Market Analysis, Insights and Forecast - by Type
- 8. Europe BIPV Industry Analysis, Insights and Forecast, 2020-2032
- 8.1. Market Analysis, Insights and Forecast - by Type
- 8.1.1. Thin-film PV
- 8.1.2. Crystalline PV
- 8.2. Market Analysis, Insights and Forecast - by End User
- 8.2.1. Residential
- 8.2.2. Commercial and Industrial
- 8.1. Market Analysis, Insights and Forecast - by Type
- 9. Asia Pacific BIPV Industry Analysis, Insights and Forecast, 2020-2032
- 9.1. Market Analysis, Insights and Forecast - by Type
- 9.1.1. Thin-film PV
- 9.1.2. Crystalline PV
- 9.2. Market Analysis, Insights and Forecast - by End User
- 9.2.1. Residential
- 9.2.2. Commercial and Industrial
- 9.1. Market Analysis, Insights and Forecast - by Type
- 10. South America BIPV Industry Analysis, Insights and Forecast, 2020-2032
- 10.1. Market Analysis, Insights and Forecast - by Type
- 10.1.1. Thin-film PV
- 10.1.2. Crystalline PV
- 10.2. Market Analysis, Insights and Forecast - by End User
- 10.2.1. Residential
- 10.2.2. Commercial and Industrial
- 10.1. Market Analysis, Insights and Forecast - by Type
- 11. Middle East and Africa BIPV Industry Analysis, Insights and Forecast, 2020-2032
- 11.1. Market Analysis, Insights and Forecast - by Type
- 11.1.1. Thin-film PV
- 11.1.2. Crystalline PV
- 11.2. Market Analysis, Insights and Forecast - by End User
- 11.2.1. Residential
- 11.2.2. Commercial and Industrial
- 11.1. Market Analysis, Insights and Forecast - by Type
- 12. Competitive Analysis
- 12.1. Company Profiles
- 12.1.1 Ertex solartechnik GmbH
- 12.1.1.1. Company Overview
- 12.1.1.2. Products
- 12.1.1.3. Company Financials
- 12.1.1.4. SWOT Analysis
- 12.1.2 Merck KGaA
- 12.1.2.1. Company Overview
- 12.1.2.2. Products
- 12.1.2.3. Company Financials
- 12.1.2.4. SWOT Analysis
- 12.1.3 Hanergy Holding Group Ltd
- 12.1.3.1. Company Overview
- 12.1.3.2. Products
- 12.1.3.3. Company Financials
- 12.1.3.4. SWOT Analysis
- 12.1.4 Onyx Solar Group LLC
- 12.1.4.1. Company Overview
- 12.1.4.2. Products
- 12.1.4.3. Company Financials
- 12.1.4.4. SWOT Analysis
- 12.1.5 Polysolar Domestic
- 12.1.5.1. Company Overview
- 12.1.5.2. Products
- 12.1.5.3. Company Financials
- 12.1.5.4. SWOT Analysis
- 12.1.6 Nanoflex Power Corporation
- 12.1.6.1. Company Overview
- 12.1.6.2. Products
- 12.1.6.3. Company Financials
- 12.1.6.4. SWOT Analysis
- 12.1.7 Solarday
- 12.1.7.1. Company Overview
- 12.1.7.2. Products
- 12.1.7.3. Company Financials
- 12.1.7.4. SWOT Analysis
- 12.1.8 AGC Inc
- 12.1.8.1. Company Overview
- 12.1.8.2. Products
- 12.1.8.3. Company Financials
- 12.1.8.4. SWOT Analysis
- 12.1.9 Changzhou Almaden Co Ltd
- 12.1.9.1. Company Overview
- 12.1.9.2. Products
- 12.1.9.3. Company Financials
- 12.1.9.4. SWOT Analysis
- 12.1.10 Issol SA
- 12.1.10.1. Company Overview
- 12.1.10.2. Products
- 12.1.10.3. Company Financials
- 12.1.10.4. SWOT Analysis
- 12.1.1 Ertex solartechnik GmbH
- 12.2. Market Entropy
- 12.2.1 Company's Key Areas Served
- 12.2.2 Recent Developments
- 12.3. Company Market Share Analysis 2025
- 12.3.1 Top 5 Companies Market Share Analysis
- 12.3.2 Top 3 Companies Market Share Analysis
- 12.4. List of Potential Customers
- 13. Research Methodology
List of Figures
- Figure 1: Global BIPV Industry Revenue Breakdown (Million, %) by Region 2025 & 2033
- Figure 2: Global BIPV Industry Volume Breakdown (Gigawatt, %) by Region 2025 & 2033
- Figure 3: North America BIPV Industry Revenue (Million), by Type 2025 & 2033
- Figure 4: North America BIPV Industry Volume (Gigawatt), by Type 2025 & 2033
- Figure 5: North America BIPV Industry Revenue Share (%), by Type 2025 & 2033
- Figure 6: North America BIPV Industry Volume Share (%), by Type 2025 & 2033
- Figure 7: North America BIPV Industry Revenue (Million), by End User 2025 & 2033
- Figure 8: North America BIPV Industry Volume (Gigawatt), by End User 2025 & 2033
- Figure 9: North America BIPV Industry Revenue Share (%), by End User 2025 & 2033
- Figure 10: North America BIPV Industry Volume Share (%), by End User 2025 & 2033
- Figure 11: North America BIPV Industry Revenue (Million), by Country 2025 & 2033
- Figure 12: North America BIPV Industry Volume (Gigawatt), by Country 2025 & 2033
- Figure 13: North America BIPV Industry Revenue Share (%), by Country 2025 & 2033
- Figure 14: North America BIPV Industry Volume Share (%), by Country 2025 & 2033
- Figure 15: Europe BIPV Industry Revenue (Million), by Type 2025 & 2033
- Figure 16: Europe BIPV Industry Volume (Gigawatt), by Type 2025 & 2033
- Figure 17: Europe BIPV Industry Revenue Share (%), by Type 2025 & 2033
- Figure 18: Europe BIPV Industry Volume Share (%), by Type 2025 & 2033
- Figure 19: Europe BIPV Industry Revenue (Million), by End User 2025 & 2033
- Figure 20: Europe BIPV Industry Volume (Gigawatt), by End User 2025 & 2033
- Figure 21: Europe BIPV Industry Revenue Share (%), by End User 2025 & 2033
- Figure 22: Europe BIPV Industry Volume Share (%), by End User 2025 & 2033
- Figure 23: Europe BIPV Industry Revenue (Million), by Country 2025 & 2033
- Figure 24: Europe BIPV Industry Volume (Gigawatt), by Country 2025 & 2033
- Figure 25: Europe BIPV Industry Revenue Share (%), by Country 2025 & 2033
- Figure 26: Europe BIPV Industry Volume Share (%), by Country 2025 & 2033
- Figure 27: Asia Pacific BIPV Industry Revenue (Million), by Type 2025 & 2033
- Figure 28: Asia Pacific BIPV Industry Volume (Gigawatt), by Type 2025 & 2033
- Figure 29: Asia Pacific BIPV Industry Revenue Share (%), by Type 2025 & 2033
- Figure 30: Asia Pacific BIPV Industry Volume Share (%), by Type 2025 & 2033
- Figure 31: Asia Pacific BIPV Industry Revenue (Million), by End User 2025 & 2033
- Figure 32: Asia Pacific BIPV Industry Volume (Gigawatt), by End User 2025 & 2033
- Figure 33: Asia Pacific BIPV Industry Revenue Share (%), by End User 2025 & 2033
- Figure 34: Asia Pacific BIPV Industry Volume Share (%), by End User 2025 & 2033
- Figure 35: Asia Pacific BIPV Industry Revenue (Million), by Country 2025 & 2033
- Figure 36: Asia Pacific BIPV Industry Volume (Gigawatt), by Country 2025 & 2033
- Figure 37: Asia Pacific BIPV Industry Revenue Share (%), by Country 2025 & 2033
- Figure 38: Asia Pacific BIPV Industry Volume Share (%), by Country 2025 & 2033
- Figure 39: South America BIPV Industry Revenue (Million), by Type 2025 & 2033
- Figure 40: South America BIPV Industry Volume (Gigawatt), by Type 2025 & 2033
- Figure 41: South America BIPV Industry Revenue Share (%), by Type 2025 & 2033
- Figure 42: South America BIPV Industry Volume Share (%), by Type 2025 & 2033
- Figure 43: South America BIPV Industry Revenue (Million), by End User 2025 & 2033
- Figure 44: South America BIPV Industry Volume (Gigawatt), by End User 2025 & 2033
- Figure 45: South America BIPV Industry Revenue Share (%), by End User 2025 & 2033
- Figure 46: South America BIPV Industry Volume Share (%), by End User 2025 & 2033
- Figure 47: South America BIPV Industry Revenue (Million), by Country 2025 & 2033
- Figure 48: South America BIPV Industry Volume (Gigawatt), by Country 2025 & 2033
- Figure 49: South America BIPV Industry Revenue Share (%), by Country 2025 & 2033
- Figure 50: South America BIPV Industry Volume Share (%), by Country 2025 & 2033
- Figure 51: Middle East and Africa BIPV Industry Revenue (Million), by Type 2025 & 2033
- Figure 52: Middle East and Africa BIPV Industry Volume (Gigawatt), by Type 2025 & 2033
- Figure 53: Middle East and Africa BIPV Industry Revenue Share (%), by Type 2025 & 2033
- Figure 54: Middle East and Africa BIPV Industry Volume Share (%), by Type 2025 & 2033
- Figure 55: Middle East and Africa BIPV Industry Revenue (Million), by End User 2025 & 2033
- Figure 56: Middle East and Africa BIPV Industry Volume (Gigawatt), by End User 2025 & 2033
- Figure 57: Middle East and Africa BIPV Industry Revenue Share (%), by End User 2025 & 2033
- Figure 58: Middle East and Africa BIPV Industry Volume Share (%), by End User 2025 & 2033
- Figure 59: Middle East and Africa BIPV Industry Revenue (Million), by Country 2025 & 2033
- Figure 60: Middle East and Africa BIPV Industry Volume (Gigawatt), by Country 2025 & 2033
- Figure 61: Middle East and Africa BIPV Industry Revenue Share (%), by Country 2025 & 2033
- Figure 62: Middle East and Africa BIPV Industry Volume Share (%), by Country 2025 & 2033
List of Tables
- Table 1: Global BIPV Industry Revenue Million Forecast, by Type 2020 & 2033
- Table 2: Global BIPV Industry Volume Gigawatt Forecast, by Type 2020 & 2033
- Table 3: Global BIPV Industry Revenue Million Forecast, by End User 2020 & 2033
- Table 4: Global BIPV Industry Volume Gigawatt Forecast, by End User 2020 & 2033
- Table 5: Global BIPV Industry Revenue Million Forecast, by Region 2020 & 2033
- Table 6: Global BIPV Industry Volume Gigawatt Forecast, by Region 2020 & 2033
- Table 7: Global BIPV Industry Revenue Million Forecast, by Type 2020 & 2033
- Table 8: Global BIPV Industry Volume Gigawatt Forecast, by Type 2020 & 2033
- Table 9: Global BIPV Industry Revenue Million Forecast, by End User 2020 & 2033
- Table 10: Global BIPV Industry Volume Gigawatt Forecast, by End User 2020 & 2033
- Table 11: Global BIPV Industry Revenue Million Forecast, by Country 2020 & 2033
- Table 12: Global BIPV Industry Volume Gigawatt Forecast, by Country 2020 & 2033
- Table 13: United States BIPV Industry Revenue (Million) Forecast, by Application 2020 & 2033
- Table 14: United States BIPV Industry Volume (Gigawatt) Forecast, by Application 2020 & 2033
- Table 15: Canada BIPV Industry Revenue (Million) Forecast, by Application 2020 & 2033
- Table 16: Canada BIPV Industry Volume (Gigawatt) Forecast, by Application 2020 & 2033
- Table 17: Rest of North America BIPV Industry Revenue (Million) Forecast, by Application 2020 & 2033
- Table 18: Rest of North America BIPV Industry Volume (Gigawatt) Forecast, by Application 2020 & 2033
- Table 19: Global BIPV Industry Revenue Million Forecast, by Type 2020 & 2033
- Table 20: Global BIPV Industry Volume Gigawatt Forecast, by Type 2020 & 2033
- Table 21: Global BIPV Industry Revenue Million Forecast, by End User 2020 & 2033
- Table 22: Global BIPV Industry Volume Gigawatt Forecast, by End User 2020 & 2033
- Table 23: Global BIPV Industry Revenue Million Forecast, by Country 2020 & 2033
- Table 24: Global BIPV Industry Volume Gigawatt Forecast, by Country 2020 & 2033
- Table 25: Germany BIPV Industry Revenue (Million) Forecast, by Application 2020 & 2033
- Table 26: Germany BIPV Industry Volume (Gigawatt) Forecast, by Application 2020 & 2033
- Table 27: France BIPV Industry Revenue (Million) Forecast, by Application 2020 & 2033
- Table 28: France BIPV Industry Volume (Gigawatt) Forecast, by Application 2020 & 2033
- Table 29: United Kingdom BIPV Industry Revenue (Million) Forecast, by Application 2020 & 2033
- Table 30: United Kingdom BIPV Industry Volume (Gigawatt) Forecast, by Application 2020 & 2033
- Table 31: Turkey BIPV Industry Revenue (Million) Forecast, by Application 2020 & 2033
- Table 32: Turkey BIPV Industry Volume (Gigawatt) Forecast, by Application 2020 & 2033
- Table 33: Spain BIPV Industry Revenue (Million) Forecast, by Application 2020 & 2033
- Table 34: Spain BIPV Industry Volume (Gigawatt) Forecast, by Application 2020 & 2033
- Table 35: NORDIC BIPV Industry Revenue (Million) Forecast, by Application 2020 & 2033
- Table 36: NORDIC BIPV Industry Volume (Gigawatt) Forecast, by Application 2020 & 2033
- Table 37: Russia BIPV Industry Revenue (Million) Forecast, by Application 2020 & 2033
- Table 38: Russia BIPV Industry Volume (Gigawatt) Forecast, by Application 2020 & 2033
- Table 39: Rest of Europe BIPV Industry Revenue (Million) Forecast, by Application 2020 & 2033
- Table 40: Rest of Europe BIPV Industry Volume (Gigawatt) Forecast, by Application 2020 & 2033
- Table 41: Global BIPV Industry Revenue Million Forecast, by Type 2020 & 2033
- Table 42: Global BIPV Industry Volume Gigawatt Forecast, by Type 2020 & 2033
- Table 43: Global BIPV Industry Revenue Million Forecast, by End User 2020 & 2033
- Table 44: Global BIPV Industry Volume Gigawatt Forecast, by End User 2020 & 2033
- Table 45: Global BIPV Industry Revenue Million Forecast, by Country 2020 & 2033
- Table 46: Global BIPV Industry Volume Gigawatt Forecast, by Country 2020 & 2033
- Table 47: China BIPV Industry Revenue (Million) Forecast, by Application 2020 & 2033
- Table 48: China BIPV Industry Volume (Gigawatt) Forecast, by Application 2020 & 2033
- Table 49: India BIPV Industry Revenue (Million) Forecast, by Application 2020 & 2033
- Table 50: India BIPV Industry Volume (Gigawatt) Forecast, by Application 2020 & 2033
- Table 51: Japan BIPV Industry Revenue (Million) Forecast, by Application 2020 & 2033
- Table 52: Japan BIPV Industry Volume (Gigawatt) Forecast, by Application 2020 & 2033
- Table 53: South Korea BIPV Industry Revenue (Million) Forecast, by Application 2020 & 2033
- Table 54: South Korea BIPV Industry Volume (Gigawatt) Forecast, by Application 2020 & 2033
- Table 55: Malaysia BIPV Industry Revenue (Million) Forecast, by Application 2020 & 2033
- Table 56: Malaysia BIPV Industry Volume (Gigawatt) Forecast, by Application 2020 & 2033
- Table 57: Thailand BIPV Industry Revenue (Million) Forecast, by Application 2020 & 2033
- Table 58: Thailand BIPV Industry Volume (Gigawatt) Forecast, by Application 2020 & 2033
- Table 59: Indonesia BIPV Industry Revenue (Million) Forecast, by Application 2020 & 2033
- Table 60: Indonesia BIPV Industry Volume (Gigawatt) Forecast, by Application 2020 & 2033
- Table 61: Vietnam BIPV Industry Revenue (Million) Forecast, by Application 2020 & 2033
- Table 62: Vietnam BIPV Industry Volume (Gigawatt) Forecast, by Application 2020 & 2033
- Table 63: Rest of Asia Pacific BIPV Industry Revenue (Million) Forecast, by Application 2020 & 2033
- Table 64: Rest of Asia Pacific BIPV Industry Volume (Gigawatt) Forecast, by Application 2020 & 2033
- Table 65: Global BIPV Industry Revenue Million Forecast, by Type 2020 & 2033
- Table 66: Global BIPV Industry Volume Gigawatt Forecast, by Type 2020 & 2033
- Table 67: Global BIPV Industry Revenue Million Forecast, by End User 2020 & 2033
- Table 68: Global BIPV Industry Volume Gigawatt Forecast, by End User 2020 & 2033
- Table 69: Global BIPV Industry Revenue Million Forecast, by Country 2020 & 2033
- Table 70: Global BIPV Industry Volume Gigawatt Forecast, by Country 2020 & 2033
- Table 71: Brazil BIPV Industry Revenue (Million) Forecast, by Application 2020 & 2033
- Table 72: Brazil BIPV Industry Volume (Gigawatt) Forecast, by Application 2020 & 2033
- Table 73: Argentina BIPV Industry Revenue (Million) Forecast, by Application 2020 & 2033
- Table 74: Argentina BIPV Industry Volume (Gigawatt) Forecast, by Application 2020 & 2033
- Table 75: Colombia BIPV Industry Revenue (Million) Forecast, by Application 2020 & 2033
- Table 76: Colombia BIPV Industry Volume (Gigawatt) Forecast, by Application 2020 & 2033
- Table 77: Rest of South America BIPV Industry Revenue (Million) Forecast, by Application 2020 & 2033
- Table 78: Rest of South America BIPV Industry Volume (Gigawatt) Forecast, by Application 2020 & 2033
- Table 79: Global BIPV Industry Revenue Million Forecast, by Type 2020 & 2033
- Table 80: Global BIPV Industry Volume Gigawatt Forecast, by Type 2020 & 2033
- Table 81: Global BIPV Industry Revenue Million Forecast, by End User 2020 & 2033
- Table 82: Global BIPV Industry Volume Gigawatt Forecast, by End User 2020 & 2033
- Table 83: Global BIPV Industry Revenue Million Forecast, by Country 2020 & 2033
- Table 84: Global BIPV Industry Volume Gigawatt Forecast, by Country 2020 & 2033
- Table 85: Saudi Arabia BIPV Industry Revenue (Million) Forecast, by Application 2020 & 2033
- Table 86: Saudi Arabia BIPV Industry Volume (Gigawatt) Forecast, by Application 2020 & 2033
- Table 87: United Arab Emirates BIPV Industry Revenue (Million) Forecast, by Application 2020 & 2033
- Table 88: United Arab Emirates BIPV Industry Volume (Gigawatt) Forecast, by Application 2020 & 2033
- Table 89: South Africa BIPV Industry Revenue (Million) Forecast, by Application 2020 & 2033
- Table 90: South Africa BIPV Industry Volume (Gigawatt) Forecast, by Application 2020 & 2033
- Table 91: Nigeria BIPV Industry Revenue (Million) Forecast, by Application 2020 & 2033
- Table 92: Nigeria BIPV Industry Volume (Gigawatt) Forecast, by Application 2020 & 2033
- Table 93: Qatar BIPV Industry Revenue (Million) Forecast, by Application 2020 & 2033
- Table 94: Qatar BIPV Industry Volume (Gigawatt) Forecast, by Application 2020 & 2033
- Table 95: Egypt BIPV Industry Revenue (Million) Forecast, by Application 2020 & 2033
- Table 96: Egypt BIPV Industry Volume (Gigawatt) Forecast, by Application 2020 & 2033
- Table 97: Rest of Middle East and Africa BIPV Industry Revenue (Million) Forecast, by Application 2020 & 2033
- Table 98: Rest of Middle East and Africa BIPV Industry Volume (Gigawatt) Forecast, by Application 2020 & 2033
Frequently Asked Questions
1. What is the projected Compound Annual Growth Rate (CAGR) of the BIPV Industry?
The projected CAGR is approximately 14.79%.
2. Which companies are prominent players in the BIPV Industry?
Key companies in the market include Ertex solartechnik GmbH, Merck KGaA, Hanergy Holding Group Ltd, Onyx Solar Group LLC, Polysolar Domestic, Nanoflex Power Corporation, Solarday, AGC Inc, Changzhou Almaden Co Ltd, Issol SA.
3. What are the main segments of the BIPV Industry?
The market segments include Type, End User.
4. Can you provide details about the market size?
The market size is estimated to be USD 6.31 Million as of 2022.
5. What are some drivers contributing to market growth?
4.; Reduction in Energy Bills Due to Self-Power Consumption4.; Increasing Installation of Solar PV Modules in Residential Segment.
6. What are the notable trends driving market growth?
Crystalline PV Expected to Dominate the Market.
7. Are there any restraints impacting market growth?
4.; High Installation Cost as Compared to Rooftop PV Systems.
8. Can you provide examples of recent developments in the market?
April 2023: ArcelorMittal announced joining forces with BP2 to supply low carbon-emissions steel for BP2's new product, the SOLROOF integrated photovoltaic roof. BP2's integrated photovoltaic FIT VOLT panels will likely be produced solely using XCarb recycled and renewably produced steel, obtained using a minimum of 75% scrap steel and providing 100% renewable electricity.
9. What pricing options are available for accessing the report?
Pricing options include single-user, multi-user, and enterprise licenses priced at USD 4750, USD 5250, and USD 8750 respectively.
10. Is the market size provided in terms of value or volume?
The market size is provided in terms of value, measured in Million and volume, measured in Gigawatt.
11. Are there any specific market keywords associated with the report?
Yes, the market keyword associated with the report is "BIPV Industry," which aids in identifying and referencing the specific market segment covered.
12. How do I determine which pricing option suits my needs best?
The pricing options vary based on user requirements and access needs. Individual users may opt for single-user licenses, while businesses requiring broader access may choose multi-user or enterprise licenses for cost-effective access to the report.
13. Are there any additional resources or data provided in the BIPV Industry report?
While the report offers comprehensive insights, it's advisable to review the specific contents or supplementary materials provided to ascertain if additional resources or data are available.
14. How can I stay updated on further developments or reports in the BIPV Industry?
To stay informed about further developments, trends, and reports in the BIPV Industry, consider subscribing to industry newsletters, following relevant companies and organizations, or regularly checking reputable industry news sources and publications.
Methodology
Step 1 - Identification of Relevant Samples Size from Population Database


Step 2 - Approaches for Defining Global Market Size (Value, Volume* & Price*)

Note*: In applicable scenarios
Step 3 - Data Sources
Primary Research
- Web Analytics
- Survey Reports
- Research Institute
- Latest Research Reports
- Opinion Leaders
Secondary Research
- Annual Reports
- White Paper
- Latest Press Release
- Industry Association
- Paid Database
- Investor Presentations

Step 4 - Data Triangulation
Involves using different sources of information in order to increase the validity of a study
These sources are likely to be stakeholders in a program - participants, other researchers, program staff, other community members, and so on.
Then we put all data in single framework & apply various statistical tools to find out the dynamic on the market.
During the analysis stage, feedback from the stakeholder groups would be compared to determine areas of agreement as well as areas of divergence