

Key Insights
The Indian sports drink market, projected to reach $3.4 billion by 2024, is set for substantial expansion with an estimated Compound Annual Growth Rate (CAGR) of 15.6% from 2024 to 2033. This robust growth is propelled by increasing health consciousness, rising participation in fitness and sports, and evolving lifestyle choices, particularly among India's young, urbanizing population. The demand for nutrient-rich, electrolyte-enhanced beverages is escalating. Enhanced accessibility through widespread retail channels, including convenience stores, supermarkets, and e-commerce platforms, alongside a preference for convenient packaging formats, further stimulates market penetration. While major beverage corporations lead the market, emerging niche brands emphasizing natural ingredients and functional benefits are carving out significant market share.
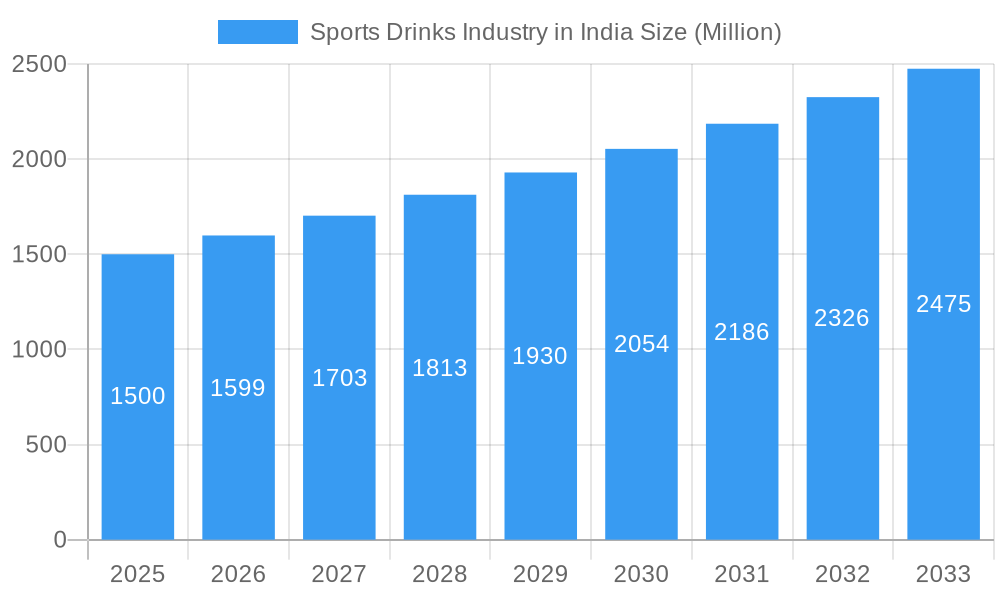
Sports Drinks Industry in India Market Size (In Billion)
Challenges impacting market growth include price sensitivity among a broad consumer base and growing consumer awareness regarding the sugar content in conventional sports drinks. This presents an opportunity for the development of healthier alternatives, such as functional beverages and natural options like coconut water and fruit-infused drinks. Strategic market navigation necessitates a balanced approach to affordability, health-focused formulations, and targeted marketing across India's diverse regions. Market segmentation by drink type and packaging offers avenues for precise product development and marketing initiatives to meet varied consumer demands.
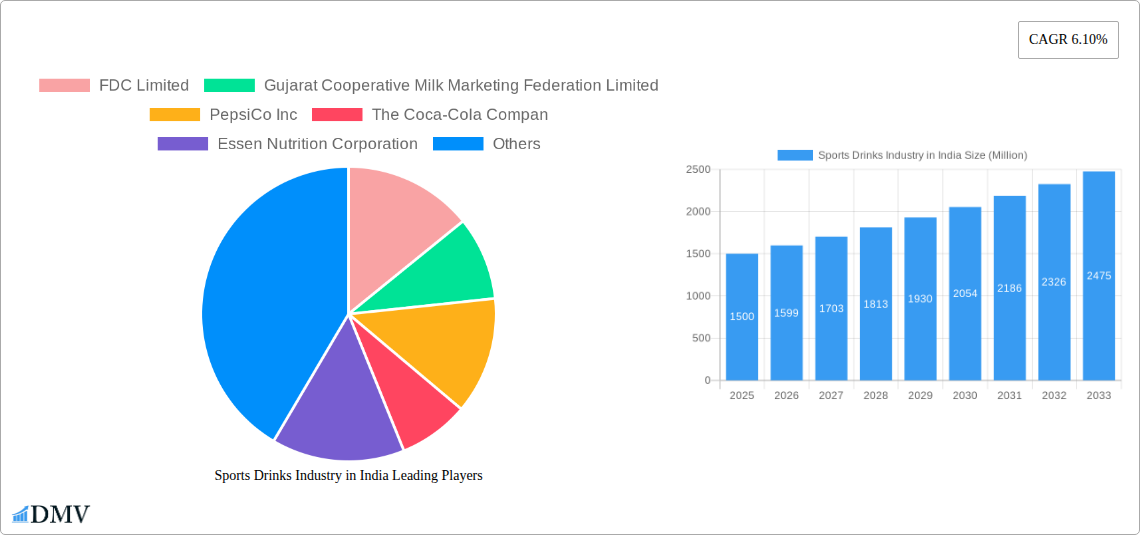
Sports Drinks Industry in India Company Market Share
Sports Drinks Industry in India: A Comprehensive Market Report (2019-2033)
This insightful report provides a detailed analysis of the burgeoning Indian sports drinks market, offering a comprehensive overview of its current state, future trajectory, and key players. Covering the period from 2019 to 2033, with 2025 as the base year, this report is an indispensable resource for stakeholders seeking to understand and capitalize on the immense growth potential within this dynamic sector. The market is estimated to be worth xx Million in 2025.
Sports Drinks Industry in India Market Composition & Trends
The Indian sports drinks market is experiencing robust growth, driven by factors such as rising health consciousness, increasing disposable incomes, and a burgeoning fitness culture. Market concentration is moderately high, with a few major players commanding significant market share. However, the entry of new players and product innovations are continuously reshaping the competitive landscape. The regulatory environment is relatively favorable, though evolving regulations regarding sugar content and labeling are impacting product formulations and marketing strategies. Substitute products, such as coconut water and fruit juices, pose a competitive threat, though the unique benefits of sports drinks – particularly electrolyte replenishment – maintain a strong market position.
- Market Share Distribution (2025): Coca-Cola: 35%; PepsiCo: 30%; Others: 35% (This includes FDC Limited, Gujarat Cooperative Milk Marketing Federation Limited, Essen Nutrition Corporation, Cipla Limited, Thai Beverages PCL, and Congo Brands).
- M&A Activities (2019-2024): Total deal value estimated at xx Million, primarily focused on brand acquisitions and expansion into new product categories. Examples include Coca-Cola's acquisition of Limca brand in the early 1990s and the expansion of existing product lines like Limca Sportz.
- End-User Profiles: The target market is primarily young adults (18-35) and athletes, with increasing penetration into other demographics.
Sports Drinks Industry in India Industry Evolution
The Indian sports drinks market has witnessed significant evolution since 2019. Growth has been propelled by factors such as increasing participation in sports and fitness activities, rising awareness of hydration importance, and the proliferation of health and wellness trends. This is reflected in an impressive Compound Annual Growth Rate (CAGR) of xx% from 2019 to 2024 and a projected CAGR of xx% between 2025 and 2033. Technological advancements, such as improved packaging materials (e.g., lighter PET bottles) and innovative formulations, further contributed to market expansion. Changing consumer preferences, with a focus on natural ingredients and functional benefits, are also shaping product development strategies. The adoption of online retail channels is steadily growing, adding another dimension to market dynamics.
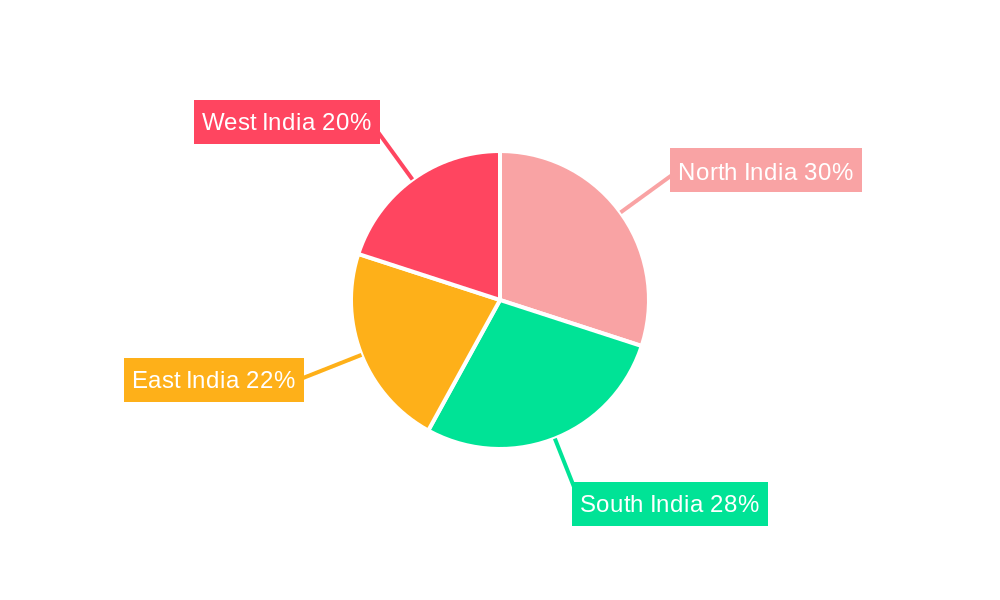
Leading Regions, Countries, or Segments in Sports Drinks Industry in India
While data specifying regional dominance is limited, the urban areas of major Indian cities likely demonstrate the highest consumption of sports drinks. Considering product segments, the isotonic segment dominates the market, followed by electrolyte-enhanced water.
- Key Drivers for Isotonic Segment Dominance:
- High demand from athletes and fitness enthusiasts.
- Established brand presence and marketing campaigns.
- Wider availability across diverse distribution channels.
- Growth Potential for Electrolyte-Enhanced Water:
- Increasing consumer preference for healthier, less sugary options.
- Growing health-consciousness across demographics.
- Innovative product development focusing on natural flavors and added nutrients.
- PET Bottles Dominate Packaging: This is due to cost-effectiveness, convenience, and ease of disposal, surpassing aseptic packages and metal cans in market share.
- Supermarket/Hypermarket and Convenience Stores are the primary distribution channels, offering wide product visibility to the target market.
Sports Drinks Industry in India Product Innovations
Recent innovations focus on enhanced functionality and improved taste profiles. Products are incorporating natural ingredients, reduced sugar content, and added vitamins and minerals to cater to evolving consumer preferences. Many brands are leveraging technological advancements to create more sustainable packaging options. The emergence of protein-based sports drinks presents a new growth avenue. Unique selling propositions are centered around improved hydration, enhanced performance benefits, and alignment with consumer preferences for health and wellness.
Propelling Factors for Sports Drinks Industry in India Growth
The Indian sports drinks market is driven by a confluence of factors, notably rising disposable incomes, increased health consciousness, and the government's focus on promoting sports and fitness. Technological advancements, including improved manufacturing processes and advanced packaging technologies, further fuel growth. Moreover, the expansion of organized retail channels and e-commerce platforms broadens market reach.
Obstacles in the Sports Drinks Industry in India Market
Challenges include intense competition, fluctuating raw material prices, and concerns regarding sugar content and its potential health impacts. Stringent regulations regarding labeling and advertising also present challenges. Supply chain inefficiencies and logistical hurdles, especially in reaching rural markets, remain significant obstacles.
Future Opportunities in Sports Drinks Industry in India
Future growth hinges on expanding into rural markets, developing specialized products for niche segments (e.g., elderly population), and creating more sustainable and eco-friendly packaging solutions. Innovations such as functional beverages with added benefits (e.g., immunity-boosting ingredients) and personalized hydration solutions also present considerable opportunities.
Major Players in the Sports Drinks Industry in India Ecosystem
- FDC Limited
- Gujarat Cooperative Milk Marketing Federation Limited
- PepsiCo Inc
- The Coca-Cola Company
- Essen Nutrition Corporation
- Cipla Limited
- Thai Beverages PCL
- Congo Brands
Key Developments in Sports Drinks Industry in India Industry
- September 2023: Launch of Limca Sportz ION4 by Coca-Cola India, signifying product diversification and innovation within the existing brand portfolio.
- May 2022: Coca-Cola India launches Limca Sportz, marking a significant brand extension into the sports drinks category and highlighting the potential for leveraging established brand equity to enter new markets.
- January 2022: FDC Limited expands its portfolio with Electral Z+, demonstrating a strategy of product diversification to capitalize on health and wellness trends.
Strategic Sports Drinks Industry in India Market Forecast
The Indian sports drinks market is poised for continued growth, driven by favorable demographics, evolving consumer preferences, and a supportive regulatory environment. Future growth will be fueled by product innovation, expansion into new market segments, and effective marketing strategies targeting health-conscious consumers. The market is projected to reach xx Million by 2033, presenting significant opportunities for both established players and new entrants.
Sports Drinks Industry in India Segmentation
-
1. Soft Drink Type
- 1.1. Electrolyte-Enhanced Water
- 1.2. Hypertonic
- 1.3. Hypotonic
- 1.4. Isotonic
- 1.5. Protein-based Sport Drinks
-
2. Packaging Type
- 2.1. Aseptic packages
- 2.2. Metal Can
- 2.3. PET Bottles
-
3. Sub Distribution Channel
- 3.1. Convenience Stores
- 3.2. Online Retail
- 3.3. Specialty Stores
- 3.4. Supermarket/Hypermarket
- 3.5. Others
Sports Drinks Industry in India Segmentation By Geography
-
1. North America
- 1.1. United States
- 1.2. Canada
- 1.3. Mexico
-
2. South America
- 2.1. Brazil
- 2.2. Argentina
- 2.3. Rest of South America
-
3. Europe
- 3.1. United Kingdom
- 3.2. Germany
- 3.3. France
- 3.4. Italy
- 3.5. Spain
- 3.6. Russia
- 3.7. Benelux
- 3.8. Nordics
- 3.9. Rest of Europe
-
4. Middle East & Africa
- 4.1. Turkey
- 4.2. Israel
- 4.3. GCC
- 4.4. North Africa
- 4.5. South Africa
- 4.6. Rest of Middle East & Africa
-
5. Asia Pacific
- 5.1. China
- 5.2. India
- 5.3. Japan
- 5.4. South Korea
- 5.5. ASEAN
- 5.6. Oceania
- 5.7. Rest of Asia Pacific
Sports Drinks Industry in India Regional Market Share
Geographic Coverage of Sports Drinks Industry in India
Sports Drinks Industry in India REPORT HIGHLIGHTS
| Aspects | Details |
|---|---|
| Study Period | 2020-2034 |
| Base Year | 2025 |
| Estimated Year | 2026 |
| Forecast Period | 2026-2034 |
| Historical Period | 2020-2025 |
| Growth Rate | CAGR of 15.6% from 2020-2034 |
| Segmentation |
|
Table of Contents
- 1. Introduction
- 1.1. Research Scope
- 1.2. Market Segmentation
- 1.3. Research Objective
- 1.4. Definitions and Assumptions
- 2. Executive Summary
- 2.1. Market Snapshot
- 3. Market Dynamics
- 3.1. Market Drivers
- 3.2. Market Restrains
- 3.3. Market Trends
- 3.4. Market Opportunities
- 4. Market Factor Analysis
- 4.1. Porters Five Forces
- 4.1.1. Bargaining Power of Suppliers
- 4.1.2. Bargaining Power of Buyers
- 4.1.3. Threat of New Entrants
- 4.1.4. Threat of Substitutes
- 4.1.5. Competitive Rivalry
- 4.2. PESTEL analysis
- 4.3. BCG Analysis
- 4.3.1. Stars (High Growth, High Market Share)
- 4.3.2. Cash Cows (Low Growth, High Market Share)
- 4.3.3. Question Mark (High Growth, Low Market Share)
- 4.3.4. Dogs (Low Growth, Low Market Share)
- 4.4. Ansoff Matrix Analysis
- 4.5. Supply Chain Analysis
- 4.6. Regulatory Landscape
- 4.7. Current Market Potential and Opportunity Assessment (TAM–SAM–SOM Framework)
- 4.8. DMV Analyst Note
- 4.1. Porters Five Forces
- 5. Market Analysis, Insights and Forecast 2021-2033
- 5.1. Market Analysis, Insights and Forecast - by Soft Drink Type
- 5.1.1. Electrolyte-Enhanced Water
- 5.1.2. Hypertonic
- 5.1.3. Hypotonic
- 5.1.4. Isotonic
- 5.1.5. Protein-based Sport Drinks
- 5.2. Market Analysis, Insights and Forecast - by Packaging Type
- 5.2.1. Aseptic packages
- 5.2.2. Metal Can
- 5.2.3. PET Bottles
- 5.3. Market Analysis, Insights and Forecast - by Sub Distribution Channel
- 5.3.1. Convenience Stores
- 5.3.2. Online Retail
- 5.3.3. Specialty Stores
- 5.3.4. Supermarket/Hypermarket
- 5.3.5. Others
- 5.4. Market Analysis, Insights and Forecast - by Region
- 5.4.1. North America
- 5.4.2. South America
- 5.4.3. Europe
- 5.4.4. Middle East & Africa
- 5.4.5. Asia Pacific
- 5.1. Market Analysis, Insights and Forecast - by Soft Drink Type
- 6. Global Sports Drinks Industry in India Analysis, Insights and Forecast, 2021-2033
- 6.1. Market Analysis, Insights and Forecast - by Soft Drink Type
- 6.1.1. Electrolyte-Enhanced Water
- 6.1.2. Hypertonic
- 6.1.3. Hypotonic
- 6.1.4. Isotonic
- 6.1.5. Protein-based Sport Drinks
- 6.2. Market Analysis, Insights and Forecast - by Packaging Type
- 6.2.1. Aseptic packages
- 6.2.2. Metal Can
- 6.2.3. PET Bottles
- 6.3. Market Analysis, Insights and Forecast - by Sub Distribution Channel
- 6.3.1. Convenience Stores
- 6.3.2. Online Retail
- 6.3.3. Specialty Stores
- 6.3.4. Supermarket/Hypermarket
- 6.3.5. Others
- 6.1. Market Analysis, Insights and Forecast - by Soft Drink Type
- 7. North America Sports Drinks Industry in India Analysis, Insights and Forecast, 2020-2032
- 7.1. Market Analysis, Insights and Forecast - by Soft Drink Type
- 7.1.1. Electrolyte-Enhanced Water
- 7.1.2. Hypertonic
- 7.1.3. Hypotonic
- 7.1.4. Isotonic
- 7.1.5. Protein-based Sport Drinks
- 7.2. Market Analysis, Insights and Forecast - by Packaging Type
- 7.2.1. Aseptic packages
- 7.2.2. Metal Can
- 7.2.3. PET Bottles
- 7.3. Market Analysis, Insights and Forecast - by Sub Distribution Channel
- 7.3.1. Convenience Stores
- 7.3.2. Online Retail
- 7.3.3. Specialty Stores
- 7.3.4. Supermarket/Hypermarket
- 7.3.5. Others
- 7.1. Market Analysis, Insights and Forecast - by Soft Drink Type
- 8. South America Sports Drinks Industry in India Analysis, Insights and Forecast, 2020-2032
- 8.1. Market Analysis, Insights and Forecast - by Soft Drink Type
- 8.1.1. Electrolyte-Enhanced Water
- 8.1.2. Hypertonic
- 8.1.3. Hypotonic
- 8.1.4. Isotonic
- 8.1.5. Protein-based Sport Drinks
- 8.2. Market Analysis, Insights and Forecast - by Packaging Type
- 8.2.1. Aseptic packages
- 8.2.2. Metal Can
- 8.2.3. PET Bottles
- 8.3. Market Analysis, Insights and Forecast - by Sub Distribution Channel
- 8.3.1. Convenience Stores
- 8.3.2. Online Retail
- 8.3.3. Specialty Stores
- 8.3.4. Supermarket/Hypermarket
- 8.3.5. Others
- 8.1. Market Analysis, Insights and Forecast - by Soft Drink Type
- 9. Europe Sports Drinks Industry in India Analysis, Insights and Forecast, 2020-2032
- 9.1. Market Analysis, Insights and Forecast - by Soft Drink Type
- 9.1.1. Electrolyte-Enhanced Water
- 9.1.2. Hypertonic
- 9.1.3. Hypotonic
- 9.1.4. Isotonic
- 9.1.5. Protein-based Sport Drinks
- 9.2. Market Analysis, Insights and Forecast - by Packaging Type
- 9.2.1. Aseptic packages
- 9.2.2. Metal Can
- 9.2.3. PET Bottles
- 9.3. Market Analysis, Insights and Forecast - by Sub Distribution Channel
- 9.3.1. Convenience Stores
- 9.3.2. Online Retail
- 9.3.3. Specialty Stores
- 9.3.4. Supermarket/Hypermarket
- 9.3.5. Others
- 9.1. Market Analysis, Insights and Forecast - by Soft Drink Type
- 10. Middle East & Africa Sports Drinks Industry in India Analysis, Insights and Forecast, 2020-2032
- 10.1. Market Analysis, Insights and Forecast - by Soft Drink Type
- 10.1.1. Electrolyte-Enhanced Water
- 10.1.2. Hypertonic
- 10.1.3. Hypotonic
- 10.1.4. Isotonic
- 10.1.5. Protein-based Sport Drinks
- 10.2. Market Analysis, Insights and Forecast - by Packaging Type
- 10.2.1. Aseptic packages
- 10.2.2. Metal Can
- 10.2.3. PET Bottles
- 10.3. Market Analysis, Insights and Forecast - by Sub Distribution Channel
- 10.3.1. Convenience Stores
- 10.3.2. Online Retail
- 10.3.3. Specialty Stores
- 10.3.4. Supermarket/Hypermarket
- 10.3.5. Others
- 10.1. Market Analysis, Insights and Forecast - by Soft Drink Type
- 11. Asia Pacific Sports Drinks Industry in India Analysis, Insights and Forecast, 2020-2032
- 11.1. Market Analysis, Insights and Forecast - by Soft Drink Type
- 11.1.1. Electrolyte-Enhanced Water
- 11.1.2. Hypertonic
- 11.1.3. Hypotonic
- 11.1.4. Isotonic
- 11.1.5. Protein-based Sport Drinks
- 11.2. Market Analysis, Insights and Forecast - by Packaging Type
- 11.2.1. Aseptic packages
- 11.2.2. Metal Can
- 11.2.3. PET Bottles
- 11.3. Market Analysis, Insights and Forecast - by Sub Distribution Channel
- 11.3.1. Convenience Stores
- 11.3.2. Online Retail
- 11.3.3. Specialty Stores
- 11.3.4. Supermarket/Hypermarket
- 11.3.5. Others
- 11.1. Market Analysis, Insights and Forecast - by Soft Drink Type
- 12. Competitive Analysis
- 12.1. Company Profiles
- 12.1.1 FDC Limited
- 12.1.1.1. Company Overview
- 12.1.1.2. Products
- 12.1.1.3. Company Financials
- 12.1.1.4. SWOT Analysis
- 12.1.2 Gujarat Cooperative Milk Marketing Federation Limited
- 12.1.2.1. Company Overview
- 12.1.2.2. Products
- 12.1.2.3. Company Financials
- 12.1.2.4. SWOT Analysis
- 12.1.3 PepsiCo Inc
- 12.1.3.1. Company Overview
- 12.1.3.2. Products
- 12.1.3.3. Company Financials
- 12.1.3.4. SWOT Analysis
- 12.1.4 The Coca-Cola Compan
- 12.1.4.1. Company Overview
- 12.1.4.2. Products
- 12.1.4.3. Company Financials
- 12.1.4.4. SWOT Analysis
- 12.1.5 Essen Nutrition Corporation
- 12.1.5.1. Company Overview
- 12.1.5.2. Products
- 12.1.5.3. Company Financials
- 12.1.5.4. SWOT Analysis
- 12.1.6 Cipla Limited
- 12.1.6.1. Company Overview
- 12.1.6.2. Products
- 12.1.6.3. Company Financials
- 12.1.6.4. SWOT Analysis
- 12.1.7 Thai Beverages PCL
- 12.1.7.1. Company Overview
- 12.1.7.2. Products
- 12.1.7.3. Company Financials
- 12.1.7.4. SWOT Analysis
- 12.1.8 Congo Brands
- 12.1.8.1. Company Overview
- 12.1.8.2. Products
- 12.1.8.3. Company Financials
- 12.1.8.4. SWOT Analysis
- 12.1.1 FDC Limited
- 12.2. Market Entropy
- 12.2.1 Company's Key Areas Served
- 12.2.2 Recent Developments
- 12.3. Company Market Share Analysis 2025
- 12.3.1 Top 5 Companies Market Share Analysis
- 12.3.2 Top 3 Companies Market Share Analysis
- 12.4. List of Potential Customers
- 13. Research Methodology
List of Figures
- Figure 1: Global Sports Drinks Industry in India Revenue Breakdown (billion, %) by Region 2025 & 2033
- Figure 2: North America Sports Drinks Industry in India Revenue (billion), by Soft Drink Type 2025 & 2033
- Figure 3: North America Sports Drinks Industry in India Revenue Share (%), by Soft Drink Type 2025 & 2033
- Figure 4: North America Sports Drinks Industry in India Revenue (billion), by Packaging Type 2025 & 2033
- Figure 5: North America Sports Drinks Industry in India Revenue Share (%), by Packaging Type 2025 & 2033
- Figure 6: North America Sports Drinks Industry in India Revenue (billion), by Sub Distribution Channel 2025 & 2033
- Figure 7: North America Sports Drinks Industry in India Revenue Share (%), by Sub Distribution Channel 2025 & 2033
- Figure 8: North America Sports Drinks Industry in India Revenue (billion), by Country 2025 & 2033
- Figure 9: North America Sports Drinks Industry in India Revenue Share (%), by Country 2025 & 2033
- Figure 10: South America Sports Drinks Industry in India Revenue (billion), by Soft Drink Type 2025 & 2033
- Figure 11: South America Sports Drinks Industry in India Revenue Share (%), by Soft Drink Type 2025 & 2033
- Figure 12: South America Sports Drinks Industry in India Revenue (billion), by Packaging Type 2025 & 2033
- Figure 13: South America Sports Drinks Industry in India Revenue Share (%), by Packaging Type 2025 & 2033
- Figure 14: South America Sports Drinks Industry in India Revenue (billion), by Sub Distribution Channel 2025 & 2033
- Figure 15: South America Sports Drinks Industry in India Revenue Share (%), by Sub Distribution Channel 2025 & 2033
- Figure 16: South America Sports Drinks Industry in India Revenue (billion), by Country 2025 & 2033
- Figure 17: South America Sports Drinks Industry in India Revenue Share (%), by Country 2025 & 2033
- Figure 18: Europe Sports Drinks Industry in India Revenue (billion), by Soft Drink Type 2025 & 2033
- Figure 19: Europe Sports Drinks Industry in India Revenue Share (%), by Soft Drink Type 2025 & 2033
- Figure 20: Europe Sports Drinks Industry in India Revenue (billion), by Packaging Type 2025 & 2033
- Figure 21: Europe Sports Drinks Industry in India Revenue Share (%), by Packaging Type 2025 & 2033
- Figure 22: Europe Sports Drinks Industry in India Revenue (billion), by Sub Distribution Channel 2025 & 2033
- Figure 23: Europe Sports Drinks Industry in India Revenue Share (%), by Sub Distribution Channel 2025 & 2033
- Figure 24: Europe Sports Drinks Industry in India Revenue (billion), by Country 2025 & 2033
- Figure 25: Europe Sports Drinks Industry in India Revenue Share (%), by Country 2025 & 2033
- Figure 26: Middle East & Africa Sports Drinks Industry in India Revenue (billion), by Soft Drink Type 2025 & 2033
- Figure 27: Middle East & Africa Sports Drinks Industry in India Revenue Share (%), by Soft Drink Type 2025 & 2033
- Figure 28: Middle East & Africa Sports Drinks Industry in India Revenue (billion), by Packaging Type 2025 & 2033
- Figure 29: Middle East & Africa Sports Drinks Industry in India Revenue Share (%), by Packaging Type 2025 & 2033
- Figure 30: Middle East & Africa Sports Drinks Industry in India Revenue (billion), by Sub Distribution Channel 2025 & 2033
- Figure 31: Middle East & Africa Sports Drinks Industry in India Revenue Share (%), by Sub Distribution Channel 2025 & 2033
- Figure 32: Middle East & Africa Sports Drinks Industry in India Revenue (billion), by Country 2025 & 2033
- Figure 33: Middle East & Africa Sports Drinks Industry in India Revenue Share (%), by Country 2025 & 2033
- Figure 34: Asia Pacific Sports Drinks Industry in India Revenue (billion), by Soft Drink Type 2025 & 2033
- Figure 35: Asia Pacific Sports Drinks Industry in India Revenue Share (%), by Soft Drink Type 2025 & 2033
- Figure 36: Asia Pacific Sports Drinks Industry in India Revenue (billion), by Packaging Type 2025 & 2033
- Figure 37: Asia Pacific Sports Drinks Industry in India Revenue Share (%), by Packaging Type 2025 & 2033
- Figure 38: Asia Pacific Sports Drinks Industry in India Revenue (billion), by Sub Distribution Channel 2025 & 2033
- Figure 39: Asia Pacific Sports Drinks Industry in India Revenue Share (%), by Sub Distribution Channel 2025 & 2033
- Figure 40: Asia Pacific Sports Drinks Industry in India Revenue (billion), by Country 2025 & 2033
- Figure 41: Asia Pacific Sports Drinks Industry in India Revenue Share (%), by Country 2025 & 2033
List of Tables
- Table 1: Global Sports Drinks Industry in India Revenue billion Forecast, by Soft Drink Type 2020 & 2033
- Table 2: Global Sports Drinks Industry in India Revenue billion Forecast, by Packaging Type 2020 & 2033
- Table 3: Global Sports Drinks Industry in India Revenue billion Forecast, by Sub Distribution Channel 2020 & 2033
- Table 4: Global Sports Drinks Industry in India Revenue billion Forecast, by Region 2020 & 2033
- Table 5: Global Sports Drinks Industry in India Revenue billion Forecast, by Soft Drink Type 2020 & 2033
- Table 6: Global Sports Drinks Industry in India Revenue billion Forecast, by Packaging Type 2020 & 2033
- Table 7: Global Sports Drinks Industry in India Revenue billion Forecast, by Sub Distribution Channel 2020 & 2033
- Table 8: Global Sports Drinks Industry in India Revenue billion Forecast, by Country 2020 & 2033
- Table 9: United States Sports Drinks Industry in India Revenue (billion) Forecast, by Application 2020 & 2033
- Table 10: Canada Sports Drinks Industry in India Revenue (billion) Forecast, by Application 2020 & 2033
- Table 11: Mexico Sports Drinks Industry in India Revenue (billion) Forecast, by Application 2020 & 2033
- Table 12: Global Sports Drinks Industry in India Revenue billion Forecast, by Soft Drink Type 2020 & 2033
- Table 13: Global Sports Drinks Industry in India Revenue billion Forecast, by Packaging Type 2020 & 2033
- Table 14: Global Sports Drinks Industry in India Revenue billion Forecast, by Sub Distribution Channel 2020 & 2033
- Table 15: Global Sports Drinks Industry in India Revenue billion Forecast, by Country 2020 & 2033
- Table 16: Brazil Sports Drinks Industry in India Revenue (billion) Forecast, by Application 2020 & 2033
- Table 17: Argentina Sports Drinks Industry in India Revenue (billion) Forecast, by Application 2020 & 2033
- Table 18: Rest of South America Sports Drinks Industry in India Revenue (billion) Forecast, by Application 2020 & 2033
- Table 19: Global Sports Drinks Industry in India Revenue billion Forecast, by Soft Drink Type 2020 & 2033
- Table 20: Global Sports Drinks Industry in India Revenue billion Forecast, by Packaging Type 2020 & 2033
- Table 21: Global Sports Drinks Industry in India Revenue billion Forecast, by Sub Distribution Channel 2020 & 2033
- Table 22: Global Sports Drinks Industry in India Revenue billion Forecast, by Country 2020 & 2033
- Table 23: United Kingdom Sports Drinks Industry in India Revenue (billion) Forecast, by Application 2020 & 2033
- Table 24: Germany Sports Drinks Industry in India Revenue (billion) Forecast, by Application 2020 & 2033
- Table 25: France Sports Drinks Industry in India Revenue (billion) Forecast, by Application 2020 & 2033
- Table 26: Italy Sports Drinks Industry in India Revenue (billion) Forecast, by Application 2020 & 2033
- Table 27: Spain Sports Drinks Industry in India Revenue (billion) Forecast, by Application 2020 & 2033
- Table 28: Russia Sports Drinks Industry in India Revenue (billion) Forecast, by Application 2020 & 2033
- Table 29: Benelux Sports Drinks Industry in India Revenue (billion) Forecast, by Application 2020 & 2033
- Table 30: Nordics Sports Drinks Industry in India Revenue (billion) Forecast, by Application 2020 & 2033
- Table 31: Rest of Europe Sports Drinks Industry in India Revenue (billion) Forecast, by Application 2020 & 2033
- Table 32: Global Sports Drinks Industry in India Revenue billion Forecast, by Soft Drink Type 2020 & 2033
- Table 33: Global Sports Drinks Industry in India Revenue billion Forecast, by Packaging Type 2020 & 2033
- Table 34: Global Sports Drinks Industry in India Revenue billion Forecast, by Sub Distribution Channel 2020 & 2033
- Table 35: Global Sports Drinks Industry in India Revenue billion Forecast, by Country 2020 & 2033
- Table 36: Turkey Sports Drinks Industry in India Revenue (billion) Forecast, by Application 2020 & 2033
- Table 37: Israel Sports Drinks Industry in India Revenue (billion) Forecast, by Application 2020 & 2033
- Table 38: GCC Sports Drinks Industry in India Revenue (billion) Forecast, by Application 2020 & 2033
- Table 39: North Africa Sports Drinks Industry in India Revenue (billion) Forecast, by Application 2020 & 2033
- Table 40: South Africa Sports Drinks Industry in India Revenue (billion) Forecast, by Application 2020 & 2033
- Table 41: Rest of Middle East & Africa Sports Drinks Industry in India Revenue (billion) Forecast, by Application 2020 & 2033
- Table 42: Global Sports Drinks Industry in India Revenue billion Forecast, by Soft Drink Type 2020 & 2033
- Table 43: Global Sports Drinks Industry in India Revenue billion Forecast, by Packaging Type 2020 & 2033
- Table 44: Global Sports Drinks Industry in India Revenue billion Forecast, by Sub Distribution Channel 2020 & 2033
- Table 45: Global Sports Drinks Industry in India Revenue billion Forecast, by Country 2020 & 2033
- Table 46: China Sports Drinks Industry in India Revenue (billion) Forecast, by Application 2020 & 2033
- Table 47: India Sports Drinks Industry in India Revenue (billion) Forecast, by Application 2020 & 2033
- Table 48: Japan Sports Drinks Industry in India Revenue (billion) Forecast, by Application 2020 & 2033
- Table 49: South Korea Sports Drinks Industry in India Revenue (billion) Forecast, by Application 2020 & 2033
- Table 50: ASEAN Sports Drinks Industry in India Revenue (billion) Forecast, by Application 2020 & 2033
- Table 51: Oceania Sports Drinks Industry in India Revenue (billion) Forecast, by Application 2020 & 2033
- Table 52: Rest of Asia Pacific Sports Drinks Industry in India Revenue (billion) Forecast, by Application 2020 & 2033
Frequently Asked Questions
1. What is the projected Compound Annual Growth Rate (CAGR) of the Sports Drinks Industry in India?
The projected CAGR is approximately 15.6%.
2. Which companies are prominent players in the Sports Drinks Industry in India?
Key companies in the market include FDC Limited, Gujarat Cooperative Milk Marketing Federation Limited, PepsiCo Inc, The Coca-Cola Compan, Essen Nutrition Corporation, Cipla Limited, Thai Beverages PCL, Congo Brands.
3. What are the main segments of the Sports Drinks Industry in India?
The market segments include Soft Drink Type, Packaging Type, Sub Distribution Channel.
4. Can you provide details about the market size?
The market size is estimated to be USD 3.4 billion as of 2022.
5. What are some drivers contributing to market growth?
Increasing Demand for Functional and Fortified Food; Multi-functionality and Wide Application of Riboflavin.
6. What are the notable trends driving market growth?
OTHER KEY INDUSTRY TRENDS COVERED IN THE REPORT.
7. Are there any restraints impacting market growth?
Low Stability of Riboflavin on Exposure to Light and Heat.
8. Can you provide examples of recent developments in the market?
September 2023: Limca Sportz, the sports drink from Coca-Cola India's home-grown brand Limca, is thrilled to announce the launch of its new variant Limca Sportz ION4 in India.May 2022: Coca-Cola India extended the brand Limca into the hydrating sports drinks category, with the product Limca sportz. This will be the first brand extension for Limca, which was acquired from Ramesh Chauhan’s Parle Bisleri Ltd. in the early 1990s along with other valuable brands such as Thums Up, Maaza, and Gold Spot. Limca stands at number four within Coca-Cola India’s sparkling portfolio.January 2022: FDC limited expanded its portfolio with launch of its brand ‘Electral Z+ (ORS+Zinc Solution)’ which is a ready-to-drink OTC product, having unique formulation manufactured by Halewood Laboratories Private Ltd.
9. What pricing options are available for accessing the report?
Pricing options include single-user, multi-user, and enterprise licenses priced at USD 3800, USD 4500, and USD 5800 respectively.
10. Is the market size provided in terms of value or volume?
The market size is provided in terms of value, measured in billion.
11. Are there any specific market keywords associated with the report?
Yes, the market keyword associated with the report is "Sports Drinks Industry in India," which aids in identifying and referencing the specific market segment covered.
12. How do I determine which pricing option suits my needs best?
The pricing options vary based on user requirements and access needs. Individual users may opt for single-user licenses, while businesses requiring broader access may choose multi-user or enterprise licenses for cost-effective access to the report.
13. Are there any additional resources or data provided in the Sports Drinks Industry in India report?
While the report offers comprehensive insights, it's advisable to review the specific contents or supplementary materials provided to ascertain if additional resources or data are available.
14. How can I stay updated on further developments or reports in the Sports Drinks Industry in India?
To stay informed about further developments, trends, and reports in the Sports Drinks Industry in India, consider subscribing to industry newsletters, following relevant companies and organizations, or regularly checking reputable industry news sources and publications.
Methodology
Step 1 - Identification of Relevant Samples Size from Population Database


Step 2 - Approaches for Defining Global Market Size (Value, Volume* & Price*)

Note*: In applicable scenarios
Step 3 - Data Sources
Primary Research
- Web Analytics
- Survey Reports
- Research Institute
- Latest Research Reports
- Opinion Leaders
Secondary Research
- Annual Reports
- White Paper
- Latest Press Release
- Industry Association
- Paid Database
- Investor Presentations

Step 4 - Data Triangulation
Involves using different sources of information in order to increase the validity of a study
These sources are likely to be stakeholders in a program - participants, other researchers, program staff, other community members, and so on.
Then we put all data in single framework & apply various statistical tools to find out the dynamic on the market.
During the analysis stage, feedback from the stakeholder groups would be compared to determine areas of agreement as well as areas of divergence