

Key Insights
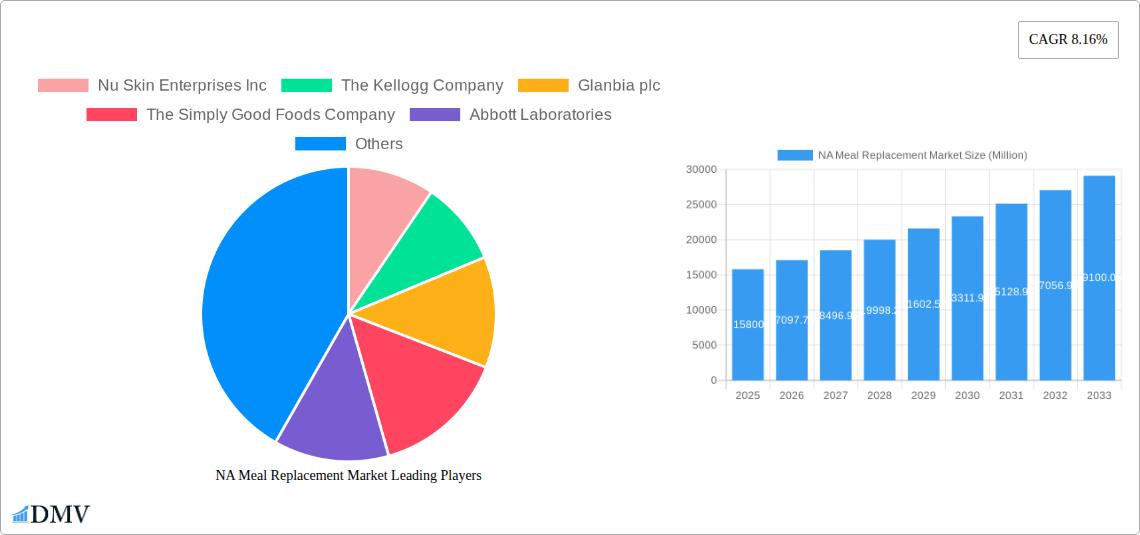
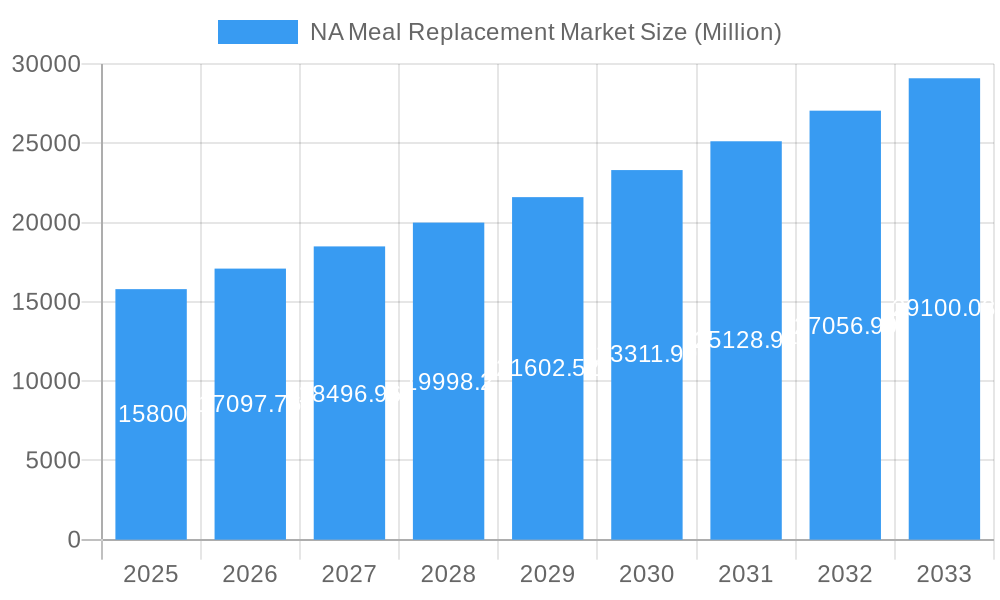
The North American meal replacement market is poised for substantial growth, projected to reach an estimated market size of $15,800 million by 2025. This expansion is fueled by a robust Compound Annual Growth Rate (CAGR) of 8.16% between 2025 and 2033, indicating a dynamic and expanding sector. A primary driver of this growth is the increasing consumer focus on health and wellness, coupled with a demand for convenient and time-saving dietary solutions. Busy lifestyles and a growing awareness of the benefits of controlled calorie intake and balanced nutrition are leading more consumers to opt for meal replacements as part of their daily routines, whether for weight management, athletic performance, or general health maintenance. The market is also benefiting from product innovation, with manufacturers introducing a wider variety of flavors, formulations, and formats to cater to diverse dietary needs and preferences, including plant-based and low-carb options.
NA Meal Replacement Market Market Size (In Billion)
Further bolstering the market's trajectory are the evolving distribution channels, with a significant shift towards online platforms. While traditional channels like supermarkets and convenience stores remain important, the ease of access and personalized recommendations offered by e-commerce are becoming increasingly influential in consumer purchasing decisions. The rising prevalence of lifestyle-related diseases and the proactive approach to preventative healthcare also contribute significantly to the demand for meal replacement products. Companies are investing heavily in research and development to enhance the nutritional profiles and palatability of their offerings, further stimulating market penetration and consumer adoption. Key players are strategically expanding their product portfolios and geographical reach to capture a larger share of this burgeoning market, anticipating sustained consumer interest in convenient and health-conscious dietary alternatives.
NA Meal Replacement Market Company Market Share
This in-depth report provides a granular analysis of the North American Meal Replacement Market, offering critical insights into its current composition, evolutionary trajectory, and future potential. Delve into market concentration, innovation drivers, regulatory landscapes, and key player strategies that are shaping the health and wellness nutrition industry. With a robust study period spanning from 2019 to 2033, a base year of 2025, and an extensive forecast period from 2025 to 2033, this report equips stakeholders with the actionable intelligence needed to navigate this dynamic market. Discover opportunities in ready-to-drink products, nutritional bars, powdered supplements, and explore evolving distribution channels including online stores, supermarkets/hypermarkets, and specialty stores. Uncover the strategic moves of industry giants and emerging innovators.
NA Meal Replacement Market Market Composition & Trends
The North American Meal Replacement Market exhibits a moderate level of concentration, driven by a mix of established multinational corporations and agile specialty brands. Innovation remains a key catalyst, with companies continuously investing in R&D to develop new product formulations that cater to diverse dietary needs, including keto-friendly, vegan, and low-sugar options. The regulatory landscape, while generally supportive of health and nutrition products, mandates strict adherence to labeling and safety standards. Substitute products, such as traditional healthy snacks and home-prepared meals, pose a competitive challenge, yet the convenience and targeted nutritional profiles of meal replacements continue to drive adoption. End-user profiles are expanding beyond athletes and weight-conscious individuals to encompass busy professionals, seniors seeking nutritional support, and individuals managing chronic health conditions. Mergers and acquisitions (M&A) are prevalent, with recent deal values reaching hundreds of millions to over a billion dollars, as larger players seek to expand their portfolios and market reach.
- Market Share Distribution: Key players hold significant, yet varied, market shares, with top companies accounting for an estimated 40-60% of the total market value.
- M&A Deal Values: Notable M&A transactions have been valued between $100 Million and over $1 Billion, reflecting strategic consolidation and acquisition of innovative technologies.
- Innovation Catalysts: Focus on clean ingredients, personalized nutrition, and sustainable packaging are driving product development.
- Regulatory Landscape: FDA regulations regarding nutritional claims and ingredient sourcing are paramount.
NA Meal Replacement Market Industry Evolution
The North American Meal Replacement Market has witnessed a significant evolutionary journey, marked by consistent growth trajectories and transformative technological advancements. Over the historical period of 2019-2024, the market experienced a Compound Annual Growth Rate (CAGR) of approximately 7.5%, driven by increasing consumer awareness regarding health and wellness, coupled with the demand for convenient and nutritionally balanced food options. This upward trend is projected to continue into the forecast period of 2025-2033, with an estimated CAGR of 8.2%. Technological innovations have played a pivotal role, encompassing advancements in ingredient processing, flavor profiling, and the development of novel delivery formats such as ready-to-drink products and nutritional bars with enhanced bioavailability and sensory appeal. Shifting consumer demands are central to this evolution. Consumers are increasingly seeking meal replacements that offer more than just weight management; they are looking for products that support energy levels, cognitive function, gut health, and overall well-being. This has led to a diversification of product offerings, with an emphasis on natural ingredients, plant-based alternatives, and personalized nutritional solutions. The rise of the online channel has further accelerated market growth, offering unparalleled accessibility and a platform for direct-to-consumer engagement. This digital transformation has enabled brands to gather valuable consumer data, leading to more targeted product development and marketing strategies. The market’s evolution is a testament to its adaptability and responsiveness to the dynamic needs of the modern consumer, solidifying its position as a vital segment within the broader nutritional supplements market.
Leading Regions, Countries, or Segments in NA Meal Replacement Market
Within the North American Meal Replacement Market, the United States consistently emerges as the dominant region, driven by its large, health-conscious population, high disposable incomes, and a well-established retail infrastructure that facilitates widespread product availability. This dominance is further amplified by substantial investments in health and wellness products and a proactive approach to adopting new nutritional trends.
Among the Product Types, Ready-to-drink Products command the largest market share, projected to reach over $4.5 Billion by 2025. Their popularity stems from unparalleled convenience, catering to the on-the-go lifestyles of a significant portion of the North American population. This segment benefits from continuous innovation in flavors, textures, and nutritional profiles, making them an appealing choice for busy individuals seeking quick and healthy meal solutions.
In terms of Distribution Channels, Online Stores have experienced exponential growth and are projected to become the leading channel, estimated to capture over 35% of the market share by 2025. This surge is attributed to the convenience of e-commerce, the ability to compare products and prices easily, and the direct-to-consumer engagement models adopted by many brands. The online channel also facilitates the reach of niche and specialized meal replacement brands.
- Dominant Country: United States, driven by high consumer spending on health & wellness and a mature retail ecosystem.
- Leading Product Type: Ready-to-drink Products, valued at an estimated $4.5 Billion in 2025, due to their convenience and portability.
- Dominant Distribution Channel: Online Stores, accounting for over 35% of market share in 2025, fueled by e-commerce convenience and direct-to-consumer strategies.
- Key Drivers for Online Stores: Accessibility, competitive pricing, broad product selection, and targeted digital marketing campaigns.
- Investment Trends: Significant investments are flowing into plant-based meal replacement formulations and sustainable packaging solutions within the dominant US market.
NA Meal Replacement Market Product Innovations
The North American Meal Replacement Market is a hotbed of product innovation, driven by a commitment to delivering enhanced nutritional value and superior consumer experience. Recent advancements include the development of meal replacement powders fortified with probiotics and prebiotics for improved gut health, alongside ready-to-drink options featuring novel plant-based protein sources like fava bean and pea protein isolate, offering complete amino acid profiles with minimal environmental impact. Performance metrics are continually being optimized, with a focus on increasing satiety, sustained energy release, and superior taste profiles. Unique selling propositions are emerging around personalized nutrition plans integrated with these products, utilizing AI-driven dietary analysis. Technological advancements in encapsulation techniques are also enhancing nutrient stability and bioavailability, ensuring consumers receive the full spectrum of benefits.
Propelling Factors for NA Meal Replacement Market Growth
Several key factors are propelling the growth of the North American Meal Replacement Market. The increasing prevalence of lifestyle diseases and a heightened focus on preventative healthcare are driving demand for convenient and nutritionally controlled food options. The convenience factor is paramount, as busy lifestyles leave consumers with limited time for meal preparation. Furthermore, technological advancements in product formulation and delivery systems have led to more appealing and effective meal replacement solutions. Economic factors, including rising disposable incomes in certain demographics, also support the market's expansion. Regulatory support for health and wellness products, coupled with a growing body of scientific research validating the benefits of balanced nutrition, further bolsters market confidence and consumer adoption.
Obstacles in the NA Meal Replacement Market Market
Despite robust growth, the North American Meal Replacement Market faces several obstacles. Stringent regulatory scrutiny and evolving labeling requirements can pose challenges for manufacturers. Supply chain disruptions, particularly concerning the sourcing of specialized ingredients, can impact production and costs. Intense competitive pressures from both established brands and emerging players, along with the availability of affordable substitute products like traditional healthy snacks and home-prepared meals, necessitate continuous innovation and effective marketing strategies. Consumer perception and education regarding the long-term efficacy and health benefits of meal replacements also remain an area for ongoing development.
Future Opportunities in NA Meal Replacement Market
The North American Meal Replacement Market presents significant future opportunities. The burgeoning demand for plant-based and vegan meal replacement options is a key growth avenue, catering to a rapidly expanding consumer base. The development of personalized nutrition solutions, leveraging data analytics and AI, will create niche markets and enhance product relevance. Emerging technologies in ingredient sourcing and processing, such as precision fermentation, offer potential for novel and sustainable ingredients. Expansion into untapped segments like senior nutrition and specialized medical nutrition presents substantial potential for market penetration and revenue growth.
Major Players in the NA Meal Replacement Market Ecosystem
- Nu Skin Enterprises Inc
- The Kellogg Company
- Glanbia plc
- The Simply Good Foods Company
- Abbott Laboratories
- Amway Corp (Alticor)
- Herbalife Nutrition
- Nestle SA
Key Developments in NA Meal Replacement Market Industry
- 2024 (Ongoing): Increased focus on sustainable sourcing and packaging across major brands.
- 2023: Launch of several new plant-based ready-to-drink meal replacements catering to vegan and flexitarian consumers.
- 2023: Strategic partnerships formed between meal replacement companies and fitness technology platforms for integrated wellness solutions.
- 2022: Significant investment in R&D for cognitive health-focused meal replacement supplements.
- 2021: Expansion of online store offerings and direct-to-consumer strategies by leading manufacturers.
- 2020: Emergence of niche nutritional bars with functional ingredients targeting specific health concerns.
- 2019: Growing adoption of powdered supplements for personalized daily nutritional intake.
Strategic NA Meal Replacement Market Market Forecast
The strategic forecast for the North American Meal Replacement Market is overwhelmingly positive, driven by persistent consumer demand for convenient, healthy, and personalized nutrition solutions. The market's ability to adapt to evolving dietary trends, such as the rise of plant-based and functional food markets, will be a critical growth catalyst. Continued innovation in product formulations, emphasizing clean labels and scientifically validated ingredients, will solidify consumer trust and drive market expansion. The increasing sophistication of online distribution channels and direct-to-consumer engagement strategies will further enhance accessibility and brand loyalty. The market is poised for robust growth, projected to reach significant value milestones in the coming years.
NA Meal Replacement Market Segmentation
-
1. Product Type
- 1.1. Ready-to-drink Products
- 1.2. Nutritional Bars
- 1.3. Powdered Supplements
- 1.4. Other Product Types
-
2. Distribution Channel
- 2.1. Convenience Stores
- 2.2. Supermarkets/Hypermarkets
- 2.3. Specialty Stores
- 2.4. Online Stores
- 2.5. Other Distribution Channels
NA Meal Replacement Market Segmentation By Geography
-
1. North America
- 1.1. United States
- 1.2. Canada
- 1.3. Mexico
-
2. South America
- 2.1. Brazil
- 2.2. Argentina
- 2.3. Rest of South America
-
3. Europe
- 3.1. United Kingdom
- 3.2. Germany
- 3.3. France
- 3.4. Italy
- 3.5. Spain
- 3.6. Russia
- 3.7. Benelux
- 3.8. Nordics
- 3.9. Rest of Europe
-
4. Middle East & Africa
- 4.1. Turkey
- 4.2. Israel
- 4.3. GCC
- 4.4. North Africa
- 4.5. South Africa
- 4.6. Rest of Middle East & Africa
-
5. Asia Pacific
- 5.1. China
- 5.2. India
- 5.3. Japan
- 5.4. South Korea
- 5.5. ASEAN
- 5.6. Oceania
- 5.7. Rest of Asia Pacific
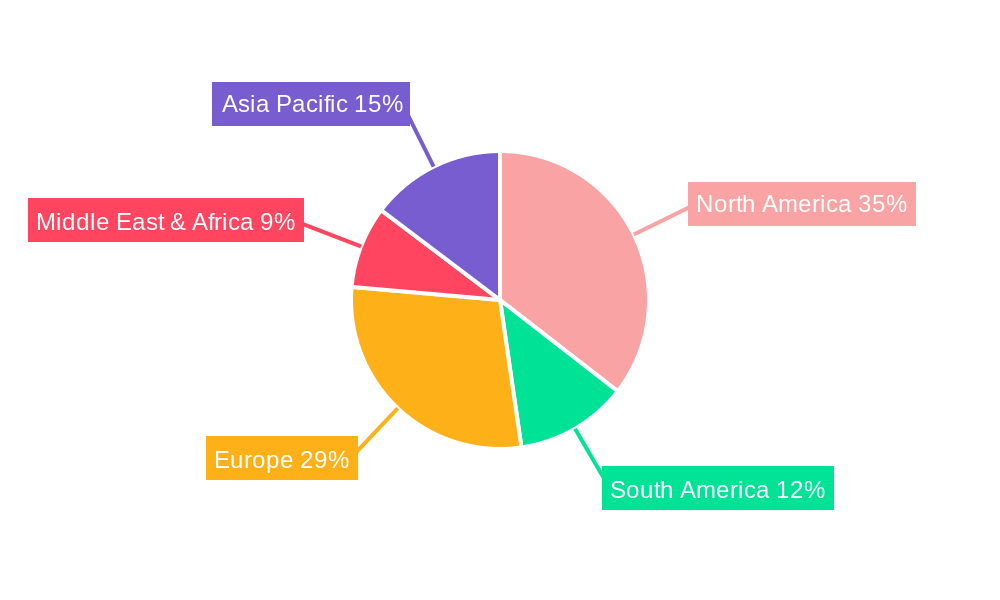
NA Meal Replacement Market Regional Market Share
Geographic Coverage of NA Meal Replacement Market
NA Meal Replacement Market REPORT HIGHLIGHTS
| Aspects | Details |
|---|---|
| Study Period | 2020-2034 |
| Base Year | 2025 |
| Estimated Year | 2026 |
| Forecast Period | 2026-2034 |
| Historical Period | 2020-2025 |
| Growth Rate | CAGR of 8.21% from 2020-2034 |
| Segmentation |
|
Table of Contents
- 1. Introduction
- 1.1. Research Scope
- 1.2. Market Segmentation
- 1.3. Research Objective
- 1.4. Definitions and Assumptions
- 2. Executive Summary
- 2.1. Market Snapshot
- 3. Market Dynamics
- 3.1. Market Drivers
- 3.2. Market Restrains
- 3.3. Market Trends
- 3.4. Market Opportunities
- 4. Market Factor Analysis
- 4.1. Porters Five Forces
- 4.1.1. Bargaining Power of Suppliers
- 4.1.2. Bargaining Power of Buyers
- 4.1.3. Threat of New Entrants
- 4.1.4. Threat of Substitutes
- 4.1.5. Competitive Rivalry
- 4.2. PESTEL analysis
- 4.3. BCG Analysis
- 4.3.1. Stars (High Growth, High Market Share)
- 4.3.2. Cash Cows (Low Growth, High Market Share)
- 4.3.3. Question Mark (High Growth, Low Market Share)
- 4.3.4. Dogs (Low Growth, Low Market Share)
- 4.4. Ansoff Matrix Analysis
- 4.5. Supply Chain Analysis
- 4.6. Regulatory Landscape
- 4.7. Current Market Potential and Opportunity Assessment (TAM–SAM–SOM Framework)
- 4.8. DMV Analyst Note
- 4.1. Porters Five Forces
- 5. Market Analysis, Insights and Forecast 2021-2033
- 5.1. Market Analysis, Insights and Forecast - by Product Type
- 5.1.1. Ready-to-drink Products
- 5.1.2. Nutritional Bars
- 5.1.3. Powdered Supplements
- 5.1.4. Other Product Types
- 5.2. Market Analysis, Insights and Forecast - by Distribution Channel
- 5.2.1. Convenience Stores
- 5.2.2. Supermarkets/Hypermarkets
- 5.2.3. Specialty Stores
- 5.2.4. Online Stores
- 5.2.5. Other Distribution Channels
- 5.3. Market Analysis, Insights and Forecast - by Region
- 5.3.1. North America
- 5.3.2. South America
- 5.3.3. Europe
- 5.3.4. Middle East & Africa
- 5.3.5. Asia Pacific
- 5.1. Market Analysis, Insights and Forecast - by Product Type
- 6. Global NA Meal Replacement Market Analysis, Insights and Forecast, 2021-2033
- 6.1. Market Analysis, Insights and Forecast - by Product Type
- 6.1.1. Ready-to-drink Products
- 6.1.2. Nutritional Bars
- 6.1.3. Powdered Supplements
- 6.1.4. Other Product Types
- 6.2. Market Analysis, Insights and Forecast - by Distribution Channel
- 6.2.1. Convenience Stores
- 6.2.2. Supermarkets/Hypermarkets
- 6.2.3. Specialty Stores
- 6.2.4. Online Stores
- 6.2.5. Other Distribution Channels
- 6.1. Market Analysis, Insights and Forecast - by Product Type
- 7. North America NA Meal Replacement Market Analysis, Insights and Forecast, 2020-2032
- 7.1. Market Analysis, Insights and Forecast - by Product Type
- 7.1.1. Ready-to-drink Products
- 7.1.2. Nutritional Bars
- 7.1.3. Powdered Supplements
- 7.1.4. Other Product Types
- 7.2. Market Analysis, Insights and Forecast - by Distribution Channel
- 7.2.1. Convenience Stores
- 7.2.2. Supermarkets/Hypermarkets
- 7.2.3. Specialty Stores
- 7.2.4. Online Stores
- 7.2.5. Other Distribution Channels
- 7.1. Market Analysis, Insights and Forecast - by Product Type
- 8. South America NA Meal Replacement Market Analysis, Insights and Forecast, 2020-2032
- 8.1. Market Analysis, Insights and Forecast - by Product Type
- 8.1.1. Ready-to-drink Products
- 8.1.2. Nutritional Bars
- 8.1.3. Powdered Supplements
- 8.1.4. Other Product Types
- 8.2. Market Analysis, Insights and Forecast - by Distribution Channel
- 8.2.1. Convenience Stores
- 8.2.2. Supermarkets/Hypermarkets
- 8.2.3. Specialty Stores
- 8.2.4. Online Stores
- 8.2.5. Other Distribution Channels
- 8.1. Market Analysis, Insights and Forecast - by Product Type
- 9. Europe NA Meal Replacement Market Analysis, Insights and Forecast, 2020-2032
- 9.1. Market Analysis, Insights and Forecast - by Product Type
- 9.1.1. Ready-to-drink Products
- 9.1.2. Nutritional Bars
- 9.1.3. Powdered Supplements
- 9.1.4. Other Product Types
- 9.2. Market Analysis, Insights and Forecast - by Distribution Channel
- 9.2.1. Convenience Stores
- 9.2.2. Supermarkets/Hypermarkets
- 9.2.3. Specialty Stores
- 9.2.4. Online Stores
- 9.2.5. Other Distribution Channels
- 9.1. Market Analysis, Insights and Forecast - by Product Type
- 10. Middle East & Africa NA Meal Replacement Market Analysis, Insights and Forecast, 2020-2032
- 10.1. Market Analysis, Insights and Forecast - by Product Type
- 10.1.1. Ready-to-drink Products
- 10.1.2. Nutritional Bars
- 10.1.3. Powdered Supplements
- 10.1.4. Other Product Types
- 10.2. Market Analysis, Insights and Forecast - by Distribution Channel
- 10.2.1. Convenience Stores
- 10.2.2. Supermarkets/Hypermarkets
- 10.2.3. Specialty Stores
- 10.2.4. Online Stores
- 10.2.5. Other Distribution Channels
- 10.1. Market Analysis, Insights and Forecast - by Product Type
- 11. Asia Pacific NA Meal Replacement Market Analysis, Insights and Forecast, 2020-2032
- 11.1. Market Analysis, Insights and Forecast - by Product Type
- 11.1.1. Ready-to-drink Products
- 11.1.2. Nutritional Bars
- 11.1.3. Powdered Supplements
- 11.1.4. Other Product Types
- 11.2. Market Analysis, Insights and Forecast - by Distribution Channel
- 11.2.1. Convenience Stores
- 11.2.2. Supermarkets/Hypermarkets
- 11.2.3. Specialty Stores
- 11.2.4. Online Stores
- 11.2.5. Other Distribution Channels
- 11.1. Market Analysis, Insights and Forecast - by Product Type
- 12. Competitive Analysis
- 12.1. Company Profiles
- 12.1.1 Nu Skin Enterprises Inc
- 12.1.1.1. Company Overview
- 12.1.1.2. Products
- 12.1.1.3. Company Financials
- 12.1.1.4. SWOT Analysis
- 12.1.2 The Kellogg Company
- 12.1.2.1. Company Overview
- 12.1.2.2. Products
- 12.1.2.3. Company Financials
- 12.1.2.4. SWOT Analysis
- 12.1.3 Glanbia plc
- 12.1.3.1. Company Overview
- 12.1.3.2. Products
- 12.1.3.3. Company Financials
- 12.1.3.4. SWOT Analysis
- 12.1.4 The Simply Good Foods Company
- 12.1.4.1. Company Overview
- 12.1.4.2. Products
- 12.1.4.3. Company Financials
- 12.1.4.4. SWOT Analysis
- 12.1.5 Abbott Laboratories
- 12.1.5.1. Company Overview
- 12.1.5.2. Products
- 12.1.5.3. Company Financials
- 12.1.5.4. SWOT Analysis
- 12.1.6 Amway Corp (Alticor)
- 12.1.6.1. Company Overview
- 12.1.6.2. Products
- 12.1.6.3. Company Financials
- 12.1.6.4. SWOT Analysis
- 12.1.7 Herbalife Nutrition
- 12.1.7.1. Company Overview
- 12.1.7.2. Products
- 12.1.7.3. Company Financials
- 12.1.7.4. SWOT Analysis
- 12.1.8 Nestle SA*List Not Exhaustive
- 12.1.8.1. Company Overview
- 12.1.8.2. Products
- 12.1.8.3. Company Financials
- 12.1.8.4. SWOT Analysis
- 12.1.1 Nu Skin Enterprises Inc
- 12.2. Market Entropy
- 12.2.1 Company's Key Areas Served
- 12.2.2 Recent Developments
- 12.3. Company Market Share Analysis 2025
- 12.3.1 Top 5 Companies Market Share Analysis
- 12.3.2 Top 3 Companies Market Share Analysis
- 12.4. List of Potential Customers
- 13. Research Methodology
List of Figures
- Figure 1: Global NA Meal Replacement Market Revenue Breakdown (billion, %) by Region 2025 & 2033
- Figure 2: North America NA Meal Replacement Market Revenue (billion), by Product Type 2025 & 2033
- Figure 3: North America NA Meal Replacement Market Revenue Share (%), by Product Type 2025 & 2033
- Figure 4: North America NA Meal Replacement Market Revenue (billion), by Distribution Channel 2025 & 2033
- Figure 5: North America NA Meal Replacement Market Revenue Share (%), by Distribution Channel 2025 & 2033
- Figure 6: North America NA Meal Replacement Market Revenue (billion), by Country 2025 & 2033
- Figure 7: North America NA Meal Replacement Market Revenue Share (%), by Country 2025 & 2033
- Figure 8: South America NA Meal Replacement Market Revenue (billion), by Product Type 2025 & 2033
- Figure 9: South America NA Meal Replacement Market Revenue Share (%), by Product Type 2025 & 2033
- Figure 10: South America NA Meal Replacement Market Revenue (billion), by Distribution Channel 2025 & 2033
- Figure 11: South America NA Meal Replacement Market Revenue Share (%), by Distribution Channel 2025 & 2033
- Figure 12: South America NA Meal Replacement Market Revenue (billion), by Country 2025 & 2033
- Figure 13: South America NA Meal Replacement Market Revenue Share (%), by Country 2025 & 2033
- Figure 14: Europe NA Meal Replacement Market Revenue (billion), by Product Type 2025 & 2033
- Figure 15: Europe NA Meal Replacement Market Revenue Share (%), by Product Type 2025 & 2033
- Figure 16: Europe NA Meal Replacement Market Revenue (billion), by Distribution Channel 2025 & 2033
- Figure 17: Europe NA Meal Replacement Market Revenue Share (%), by Distribution Channel 2025 & 2033
- Figure 18: Europe NA Meal Replacement Market Revenue (billion), by Country 2025 & 2033
- Figure 19: Europe NA Meal Replacement Market Revenue Share (%), by Country 2025 & 2033
- Figure 20: Middle East & Africa NA Meal Replacement Market Revenue (billion), by Product Type 2025 & 2033
- Figure 21: Middle East & Africa NA Meal Replacement Market Revenue Share (%), by Product Type 2025 & 2033
- Figure 22: Middle East & Africa NA Meal Replacement Market Revenue (billion), by Distribution Channel 2025 & 2033
- Figure 23: Middle East & Africa NA Meal Replacement Market Revenue Share (%), by Distribution Channel 2025 & 2033
- Figure 24: Middle East & Africa NA Meal Replacement Market Revenue (billion), by Country 2025 & 2033
- Figure 25: Middle East & Africa NA Meal Replacement Market Revenue Share (%), by Country 2025 & 2033
- Figure 26: Asia Pacific NA Meal Replacement Market Revenue (billion), by Product Type 2025 & 2033
- Figure 27: Asia Pacific NA Meal Replacement Market Revenue Share (%), by Product Type 2025 & 2033
- Figure 28: Asia Pacific NA Meal Replacement Market Revenue (billion), by Distribution Channel 2025 & 2033
- Figure 29: Asia Pacific NA Meal Replacement Market Revenue Share (%), by Distribution Channel 2025 & 2033
- Figure 30: Asia Pacific NA Meal Replacement Market Revenue (billion), by Country 2025 & 2033
- Figure 31: Asia Pacific NA Meal Replacement Market Revenue Share (%), by Country 2025 & 2033
List of Tables
- Table 1: Global NA Meal Replacement Market Revenue billion Forecast, by Product Type 2020 & 2033
- Table 2: Global NA Meal Replacement Market Revenue billion Forecast, by Distribution Channel 2020 & 2033
- Table 3: Global NA Meal Replacement Market Revenue billion Forecast, by Region 2020 & 2033
- Table 4: Global NA Meal Replacement Market Revenue billion Forecast, by Product Type 2020 & 2033
- Table 5: Global NA Meal Replacement Market Revenue billion Forecast, by Distribution Channel 2020 & 2033
- Table 6: Global NA Meal Replacement Market Revenue billion Forecast, by Country 2020 & 2033
- Table 7: United States NA Meal Replacement Market Revenue (billion) Forecast, by Application 2020 & 2033
- Table 8: Canada NA Meal Replacement Market Revenue (billion) Forecast, by Application 2020 & 2033
- Table 9: Mexico NA Meal Replacement Market Revenue (billion) Forecast, by Application 2020 & 2033
- Table 10: Global NA Meal Replacement Market Revenue billion Forecast, by Product Type 2020 & 2033
- Table 11: Global NA Meal Replacement Market Revenue billion Forecast, by Distribution Channel 2020 & 2033
- Table 12: Global NA Meal Replacement Market Revenue billion Forecast, by Country 2020 & 2033
- Table 13: Brazil NA Meal Replacement Market Revenue (billion) Forecast, by Application 2020 & 2033
- Table 14: Argentina NA Meal Replacement Market Revenue (billion) Forecast, by Application 2020 & 2033
- Table 15: Rest of South America NA Meal Replacement Market Revenue (billion) Forecast, by Application 2020 & 2033
- Table 16: Global NA Meal Replacement Market Revenue billion Forecast, by Product Type 2020 & 2033
- Table 17: Global NA Meal Replacement Market Revenue billion Forecast, by Distribution Channel 2020 & 2033
- Table 18: Global NA Meal Replacement Market Revenue billion Forecast, by Country 2020 & 2033
- Table 19: United Kingdom NA Meal Replacement Market Revenue (billion) Forecast, by Application 2020 & 2033
- Table 20: Germany NA Meal Replacement Market Revenue (billion) Forecast, by Application 2020 & 2033
- Table 21: France NA Meal Replacement Market Revenue (billion) Forecast, by Application 2020 & 2033
- Table 22: Italy NA Meal Replacement Market Revenue (billion) Forecast, by Application 2020 & 2033
- Table 23: Spain NA Meal Replacement Market Revenue (billion) Forecast, by Application 2020 & 2033
- Table 24: Russia NA Meal Replacement Market Revenue (billion) Forecast, by Application 2020 & 2033
- Table 25: Benelux NA Meal Replacement Market Revenue (billion) Forecast, by Application 2020 & 2033
- Table 26: Nordics NA Meal Replacement Market Revenue (billion) Forecast, by Application 2020 & 2033
- Table 27: Rest of Europe NA Meal Replacement Market Revenue (billion) Forecast, by Application 2020 & 2033
- Table 28: Global NA Meal Replacement Market Revenue billion Forecast, by Product Type 2020 & 2033
- Table 29: Global NA Meal Replacement Market Revenue billion Forecast, by Distribution Channel 2020 & 2033
- Table 30: Global NA Meal Replacement Market Revenue billion Forecast, by Country 2020 & 2033
- Table 31: Turkey NA Meal Replacement Market Revenue (billion) Forecast, by Application 2020 & 2033
- Table 32: Israel NA Meal Replacement Market Revenue (billion) Forecast, by Application 2020 & 2033
- Table 33: GCC NA Meal Replacement Market Revenue (billion) Forecast, by Application 2020 & 2033
- Table 34: North Africa NA Meal Replacement Market Revenue (billion) Forecast, by Application 2020 & 2033
- Table 35: South Africa NA Meal Replacement Market Revenue (billion) Forecast, by Application 2020 & 2033
- Table 36: Rest of Middle East & Africa NA Meal Replacement Market Revenue (billion) Forecast, by Application 2020 & 2033
- Table 37: Global NA Meal Replacement Market Revenue billion Forecast, by Product Type 2020 & 2033
- Table 38: Global NA Meal Replacement Market Revenue billion Forecast, by Distribution Channel 2020 & 2033
- Table 39: Global NA Meal Replacement Market Revenue billion Forecast, by Country 2020 & 2033
- Table 40: China NA Meal Replacement Market Revenue (billion) Forecast, by Application 2020 & 2033
- Table 41: India NA Meal Replacement Market Revenue (billion) Forecast, by Application 2020 & 2033
- Table 42: Japan NA Meal Replacement Market Revenue (billion) Forecast, by Application 2020 & 2033
- Table 43: South Korea NA Meal Replacement Market Revenue (billion) Forecast, by Application 2020 & 2033
- Table 44: ASEAN NA Meal Replacement Market Revenue (billion) Forecast, by Application 2020 & 2033
- Table 45: Oceania NA Meal Replacement Market Revenue (billion) Forecast, by Application 2020 & 2033
- Table 46: Rest of Asia Pacific NA Meal Replacement Market Revenue (billion) Forecast, by Application 2020 & 2033
Frequently Asked Questions
1. What is the projected Compound Annual Growth Rate (CAGR) of the NA Meal Replacement Market?
The projected CAGR is approximately 8.21%.
2. Which companies are prominent players in the NA Meal Replacement Market?
Key companies in the market include Nu Skin Enterprises Inc, The Kellogg Company, Glanbia plc, The Simply Good Foods Company, Abbott Laboratories, Amway Corp (Alticor), Herbalife Nutrition, Nestle SA*List Not Exhaustive.
3. What are the main segments of the NA Meal Replacement Market?
The market segments include Product Type, Distribution Channel.
4. Can you provide details about the market size?
The market size is estimated to be USD 20.13 billion as of 2022.
5. What are some drivers contributing to market growth?
Increasing Focus on Maintaining Health and Well-Being; Launching Supplements For Specific Purposes and Targeted Population.
6. What are the notable trends driving market growth?
American Consumers Opting for Special Diets Strive on Meal Replacements.
7. Are there any restraints impacting market growth?
Supplement Consumption and Their Side-effects; Inclination Towards Substitute Products.
8. Can you provide examples of recent developments in the market?
N/A
9. What pricing options are available for accessing the report?
Pricing options include single-user, multi-user, and enterprise licenses priced at USD 4750, USD 5250, and USD 8750 respectively.
10. Is the market size provided in terms of value or volume?
The market size is provided in terms of value, measured in billion.
11. Are there any specific market keywords associated with the report?
Yes, the market keyword associated with the report is "NA Meal Replacement Market," which aids in identifying and referencing the specific market segment covered.
12. How do I determine which pricing option suits my needs best?
The pricing options vary based on user requirements and access needs. Individual users may opt for single-user licenses, while businesses requiring broader access may choose multi-user or enterprise licenses for cost-effective access to the report.
13. Are there any additional resources or data provided in the NA Meal Replacement Market report?
While the report offers comprehensive insights, it's advisable to review the specific contents or supplementary materials provided to ascertain if additional resources or data are available.
14. How can I stay updated on further developments or reports in the NA Meal Replacement Market?
To stay informed about further developments, trends, and reports in the NA Meal Replacement Market, consider subscribing to industry newsletters, following relevant companies and organizations, or regularly checking reputable industry news sources and publications.
Methodology
Step 1 - Identification of Relevant Samples Size from Population Database


Step 2 - Approaches for Defining Global Market Size (Value, Volume* & Price*)

Note*: In applicable scenarios
Step 3 - Data Sources
Primary Research
- Web Analytics
- Survey Reports
- Research Institute
- Latest Research Reports
- Opinion Leaders
Secondary Research
- Annual Reports
- White Paper
- Latest Press Release
- Industry Association
- Paid Database
- Investor Presentations

Step 4 - Data Triangulation
Involves using different sources of information in order to increase the validity of a study
These sources are likely to be stakeholders in a program - participants, other researchers, program staff, other community members, and so on.
Then we put all data in single framework & apply various statistical tools to find out the dynamic on the market.
During the analysis stage, feedback from the stakeholder groups would be compared to determine areas of agreement as well as areas of divergence