

Key Insights
The global bottled water market is poised for significant expansion, projected to reach $353.61 billion by 2025, with a compound annual growth rate (CAGR) of 5.3%. This growth is underpinned by heightened consumer focus on health and wellness, a growing demand for convenient and safe hydration, and the increasing popularity of functional and flavored beverages. Urbanization, rising disposable incomes, and evolving lifestyles, particularly in emerging economies, are further accelerating market penetration. Consumers are increasingly prioritizing bottled water as a portable and reliable hydration solution due to perceived tap water quality concerns. Innovations in packaging and the introduction of premium and specialty products are also key growth drivers.
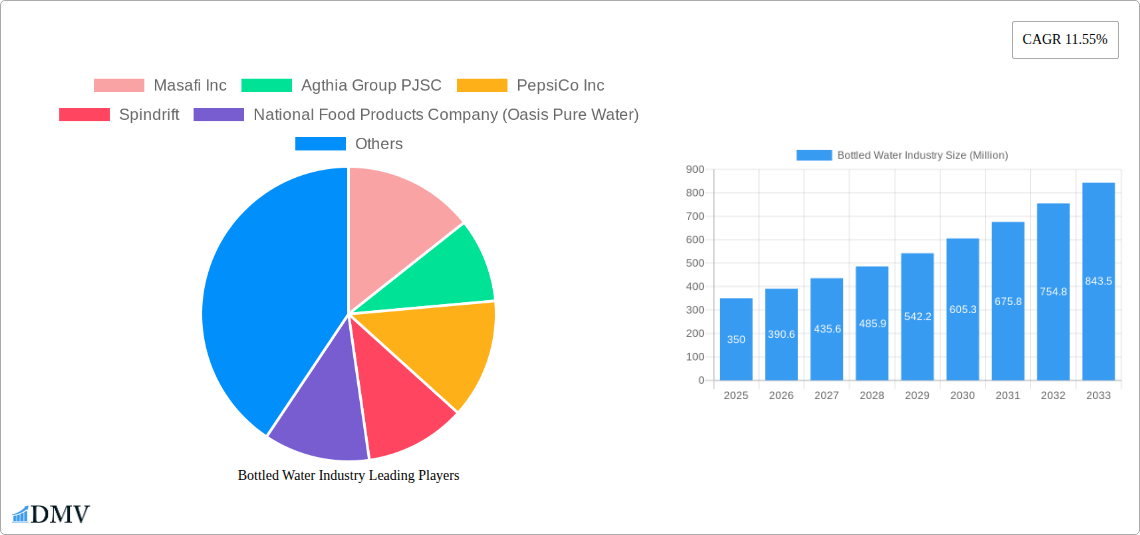
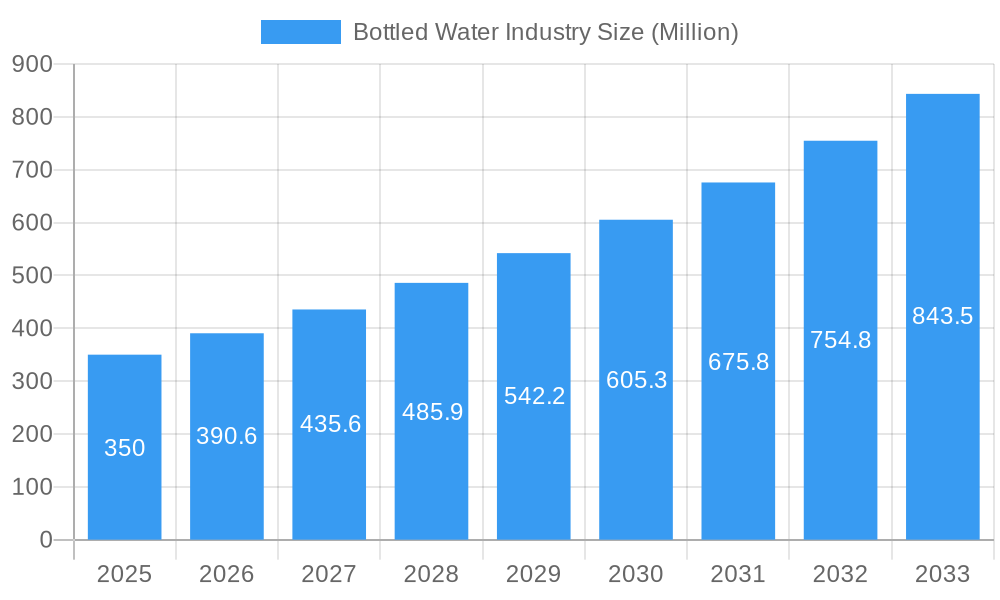
Bottled Water Industry Market Size (In Billion)
The bottled water market is segmented into Still Water, Sparkling Water, and Functional Water. While still water remains dominant, functional and sparkling variants are gaining traction due to their perceived health benefits and refreshing qualities. Distribution channels are varied, including supermarkets, hypermarkets, convenience stores, and a growing home and office delivery sector, emphasizing consumer convenience. Leading companies like Nestlé S.A., PepsiCo Inc., and Masafi Inc. are actively influencing the market through strategic expansions, product development, and focused marketing. Sustainability, eco-friendly packaging, and natural ingredients in functional waters represent emerging trends that will shape future market dynamics. Potential challenges include regulatory pressures on plastic usage and evolving consumer preferences toward improved tap water infrastructure in some regions.
Bottled Water Industry Company Market Share
Bottled Water Industry Market Composition & Trends
The global bottled water market is a dynamic landscape characterized by increasing consumer demand for healthy hydration options and a growing emphasis on sustainability. Market concentration varies by region, with a few dominant players holding significant market share, particularly in developed economies. However, emerging brands are leveraging innovation to carve out niches. Key innovation catalysts include the development of advanced filtration technologies, the introduction of functional and flavored waters catering to specific health benefits, and the widespread adoption of eco-friendly packaging solutions. The regulatory landscape is evolving, with a focus on ensuring product safety, accurate labeling, and environmental impact reduction. Substitute products, primarily tap water and other beverages, present a constant competitive pressure, driving the industry to emphasize quality, convenience, and perceived health benefits. End-user profiles are diverse, encompassing health-conscious individuals, busy professionals, and consumers seeking premium or specialty beverage options. Mergers and acquisitions (M&A) activity is a significant trend, with larger corporations acquiring smaller, innovative companies to expand their product portfolios and market reach. For instance, Agthia Group PJSC's strategic acquisition of Nabil Foods in May 2021 underscores this trend, aiming to broaden its offerings beyond bottled water. M&A deal values in the sector are projected to exceed several Million, reflecting the industry's robust growth and strategic consolidation.
Bottled Water Industry Industry Evolution
The bottled water industry has witnessed a remarkable evolution, transforming from a niche product to a mainstream beverage choice. Over the historical period of 2019–2024, the market has experienced consistent growth, driven by an escalating global awareness of health and wellness, coupled with a perceived lack of purity and convenience in municipal water supplies in certain regions. Technological advancements have played a pivotal role in shaping this evolution. Innovations in water purification techniques, such as advanced reverse osmosis and UV treatment, have enhanced product quality and safety, fostering greater consumer trust. Furthermore, the development of novel packaging materials, including lightweight plastics, biodegradable options, and aluminum cans, has addressed environmental concerns and improved product portability. Consumer demand has shifted significantly over the years. Initially, the focus was primarily on basic hydration. However, current trends indicate a strong preference for functional waters infused with vitamins, minerals, and natural flavors, targeting specific health benefits like immunity boosting, energy enhancement, and stress reduction. The rise of sparkling water as a healthier alternative to sugary carbonated drinks has also fueled market expansion. The base year of 2025 is anticipated to see a continuation of these trends, with an estimated growth rate of approximately XX% from the historical period. The forecast period of 2025–2033 projects sustained growth, with market expansion driven by increasing disposable incomes in developing economies, further urbanization, and a persistent emphasis on personal well-being. Adoption metrics for premium and functional bottled water segments are expected to rise considerably, indicating a maturing consumer base that values more than just basic hydration. The industry's ability to adapt to evolving consumer preferences and invest in sustainable practices will be crucial for its continued success and trajectory towards a market valuation projected to reach hundreds of Million by 2033.
Leading Regions, Countries, or Segments in Bottled Water Industry
The bottled water industry's dominance is a complex interplay of regional demand, distribution efficacy, and product segmentation preferences. Among the types of bottled water, Still Water consistently holds the largest market share globally, owing to its widespread appeal as a fundamental hydration source. Its simplicity and broad applicability make it a staple for consumers across all demographics and occasions. Sparkling Water is witnessing a robust growth trajectory, driven by its positioning as a sophisticated and healthier alternative to traditional carbonated beverages. The increasing consumer palate for effervescent refreshment, coupled with the availability of flavored variants, significantly bolsters its market presence. Functional Water, though currently a smaller segment, exhibits the highest growth potential. This category is propelled by a growing consumer consciousness towards health and wellness, with products tailored for specific benefits like improved immunity, enhanced cognitive function, or post-workout recovery.
In terms of distribution channels, Supermarkets and Hypermarkets remain the primary pillars of bottled water sales. Their extensive reach, diverse product offerings, and strategic placement of impulse purchase items make them indispensable for mass-market penetration. The convenience and accessibility offered by these retail giants cater to a broad spectrum of consumers. Home and Office Delivery services have emerged as a significant and rapidly expanding channel. This segment is driven by the increasing demand for convenience, bulk purchasing, and the need for a consistent supply of hydration for households and workplaces, especially in urban and suburban areas. The COVID-19 pandemic further accelerated this trend, as consumers prioritized at-home consumption. Convenience Stores play a crucial role in capturing on-the-go consumption occasions, offering immediate access to bottled water for impulse buys and travelers. On-trade channels, including restaurants, cafes, and hotels, contribute significantly to the premium and specialized bottled water segments, where consumers often opt for higher-value brands.
Key drivers for the dominance of these segments include:
- Consumer Lifestyle: Increasingly busy lifestyles necessitate convenient and readily available hydration solutions.
- Health & Wellness Trends: Growing awareness of the benefits of proper hydration and the demand for healthier beverage alternatives.
- Economic Factors: Rising disposable incomes in various regions allow for increased expenditure on bottled water.
- Marketing & Branding: Effective marketing campaigns that emphasize purity, taste, health benefits, and sustainability.
- Technological Advancements in Packaging: Innovations that offer convenience, portability, and environmental consciousness.
The global bottled water market is projected to reach several Million by 2033, with still water remaining the largest segment, followed by a significant and growing share for sparkling and functional variants, distributed primarily through supermarkets, hypermarkets, and expanding home and office delivery networks.
Bottled Water Industry Product Innovations
Product innovation in the bottled water industry is rapidly evolving beyond basic hydration. Companies are actively developing functional waters infused with vitamins, minerals, electrolytes, and natural extracts to cater to specific health and wellness needs, such as improved immunity, energy enhancement, and stress reduction. Unique selling propositions include the development of sustainable packaging solutions, such as 100% plant-based bottles and recycled materials, significantly reducing environmental impact. Technological advancements in filtration and purification methods ensure superior water quality and taste. Examples include Masafi Inc.'s "Source" bottle, produced using hydro panel technology, which leverages solar energy to create premium drinking water, showcasing a commitment to sustainable and innovative production. Performance metrics focus on enhanced shelf life, improved taste profiles, and the efficacy of added functional ingredients, driving consumer adoption and market differentiation.
Propelling Factors for Bottled Water Industry Growth
The bottled water industry's growth is propelled by several interconnected factors. Increasing Health Consciousness is paramount, with consumers actively seeking healthier beverage alternatives to sugary drinks. This drives demand for plain, flavored, and functional bottled water. Rising Disposable Incomes in emerging economies translate to greater purchasing power, enabling consumers to afford premium and convenient hydration options. Urbanization concentrates populations, leading to increased demand for readily available packaged water. Furthermore, Technological Advancements in Packaging and Filtration enhance product quality, convenience, and sustainability, addressing consumer concerns and preferences. Finally, Robust Marketing and Branding Strategies effectively communicate the perceived purity, health benefits, and lifestyle associations of bottled water, further stimulating consumption.
Obstacles in the Bottled Water Industry Market
Despite its growth, the bottled water industry faces significant obstacles. Environmental Concerns surrounding plastic waste and the carbon footprint of production and transportation are a major challenge, leading to increased regulatory scrutiny and consumer backlash. Price Sensitivity among a large consumer base limits the penetration of premium and specialty products. Intensifying Competition from both established brands and emerging players, as well as from alternative beverage categories and increasingly purified tap water, puts pressure on market share and profitability. Supply Chain Disruptions, such as raw material shortages or logistical issues, can impact production and distribution. Furthermore, Negative Perceptions regarding the necessity of bottled water in regions with safe tap water can hinder market expansion. Quantifiable impacts include potential increases in recycling infrastructure investment requirements and the need for sustainable packaging innovation to mitigate environmental pressures.
Future Opportunities in Bottled Water Industry
The future of the bottled water industry is ripe with opportunities. The burgeoning Functional Water Segment presents significant potential as consumers increasingly seek beverages with added health benefits. Innovations in personalized hydration solutions, tailored to individual needs and preferences, will likely gain traction. The development and widespread adoption of Sustainable and Biodegradable Packaging represent a crucial opportunity to address environmental concerns and appeal to eco-conscious consumers. Emerging markets in Asia and Africa, with their growing middle class and increasing urbanization, offer substantial untapped potential for market expansion. Furthermore, advancements in Smart Packaging that monitor water quality and expiry dates could enhance consumer trust and convenience. Opportunities also lie in tapping into niche markets, such as specialized waters for athletes or infants, and leveraging digital platforms for direct-to-consumer sales.
Major Players in the Bottled Water Industry Ecosystem
- Masafi Inc.
- Agthia Group PJSC
- PepsiCo Inc.
- Spindrift
- National Food Products Company (Oasis Pure Water)
- AL Ghadeer Drinking Water LLC
- Hint Inc.
- Mai Dubai
- Dubai Crystal Mineral Water & Refreshments L L C Co
- Nestlé S.A.
Key Developments in Bottled Water Industry Industry
- September 2021: Masafi Inc. launched "Source," a premium and sustainable water bottle in the UAE, produced by hydro panel technology, using solar energy to create drinking water.
- May 2021: Agthia Group PJSC announced the strategic acquisition of Nabil Foods, expanding its product portfolio to include processed protein, bottled water, convenience foods, flour, and animal feed businesses.
- April 2020: The National Food Products Company (Oasis Pure Water) introduced the first boxed drinking water in Tetra Pak in the region (330-ml size), emphasizing its biodegradable and recyclable packaging made from FSC-certified paper.
- February 2020: Agthia Group PJSC (Al Ain) introduced 100% plant-based water bottles ("Al Ain Plant Bottle") in the UAE, claiming the entire bottle, including the cap, is plant-based and composts within 80 days.
Strategic Bottled Water Industry Market Forecast
The strategic outlook for the bottled water industry forecasts continued robust growth, driven by an escalating global demand for healthy hydration solutions and the ongoing shift away from sugary beverages. Emerging markets will present substantial opportunities for expansion, fueled by increasing disposable incomes and rapid urbanization. Innovations in functional water, catering to specific health and wellness needs, are expected to be a significant growth catalyst. Furthermore, the industry's commitment to sustainability through advanced eco-friendly packaging solutions will be crucial for maintaining consumer trust and regulatory compliance. Strategic investments in technological advancements for water purification and distribution efficiency will further solidify market positions and unlock new revenue streams. The market is projected to reach several Million by 2033.
Bottled Water Industry Segmentation
-
1. Type
- 1.1. Still Water
- 1.2. Sparkling Water
- 1.3. Functional Water
-
2. Distribution Channel
- 2.1. Supermarkets and Hypermarkets
- 2.2. Convenience Stores
- 2.3. Home and Office Delivery
- 2.4. On-trade
- 2.5. Other Distribution Channels
Bottled Water Industry Segmentation By Geography
-
1. North America
- 1.1. United States
- 1.2. Canada
- 1.3. Mexico
-
2. South America
- 2.1. Brazil
- 2.2. Argentina
- 2.3. Rest of South America
-
3. Europe
- 3.1. United Kingdom
- 3.2. Germany
- 3.3. France
- 3.4. Italy
- 3.5. Spain
- 3.6. Russia
- 3.7. Benelux
- 3.8. Nordics
- 3.9. Rest of Europe
-
4. Middle East & Africa
- 4.1. Turkey
- 4.2. Israel
- 4.3. GCC
- 4.4. North Africa
- 4.5. South Africa
- 4.6. Rest of Middle East & Africa
-
5. Asia Pacific
- 5.1. China
- 5.2. India
- 5.3. Japan
- 5.4. South Korea
- 5.5. ASEAN
- 5.6. Oceania
- 5.7. Rest of Asia Pacific
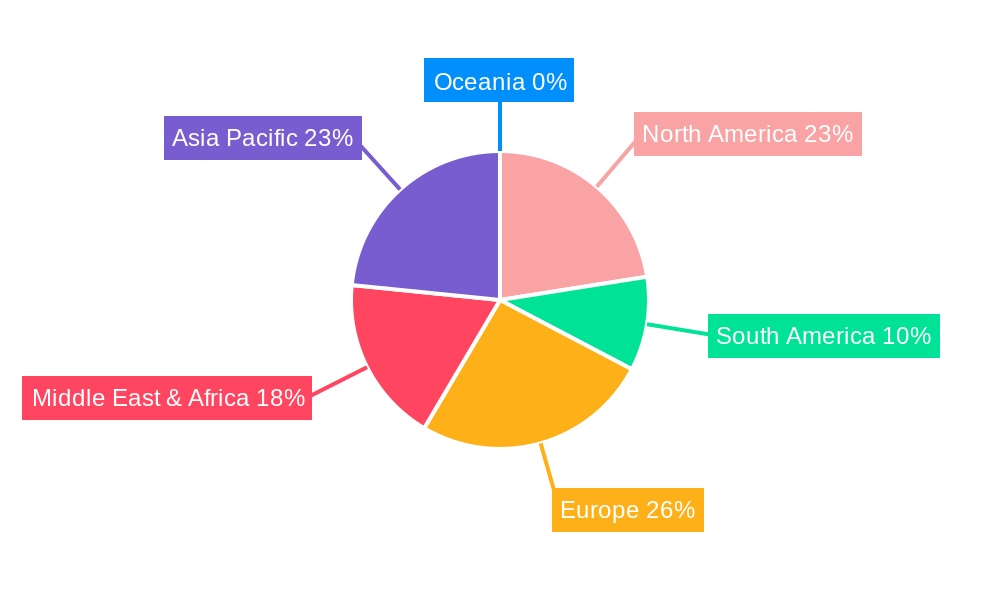
Bottled Water Industry Regional Market Share
Geographic Coverage of Bottled Water Industry
Bottled Water Industry REPORT HIGHLIGHTS
| Aspects | Details |
|---|---|
| Study Period | 2020-2034 |
| Base Year | 2025 |
| Estimated Year | 2026 |
| Forecast Period | 2026-2034 |
| Historical Period | 2020-2025 |
| Growth Rate | CAGR of 5.3% from 2020-2034 |
| Segmentation |
|
Table of Contents
- 1. Introduction
- 1.1. Research Scope
- 1.2. Market Segmentation
- 1.3. Research Objective
- 1.4. Definitions and Assumptions
- 2. Executive Summary
- 2.1. Market Snapshot
- 3. Market Dynamics
- 3.1. Market Drivers
- 3.2. Market Restrains
- 3.3. Market Trends
- 3.4. Market Opportunities
- 4. Market Factor Analysis
- 4.1. Porters Five Forces
- 4.1.1. Bargaining Power of Suppliers
- 4.1.2. Bargaining Power of Buyers
- 4.1.3. Threat of New Entrants
- 4.1.4. Threat of Substitutes
- 4.1.5. Competitive Rivalry
- 4.2. PESTEL analysis
- 4.3. BCG Analysis
- 4.3.1. Stars (High Growth, High Market Share)
- 4.3.2. Cash Cows (Low Growth, High Market Share)
- 4.3.3. Question Mark (High Growth, Low Market Share)
- 4.3.4. Dogs (Low Growth, Low Market Share)
- 4.4. Ansoff Matrix Analysis
- 4.5. Supply Chain Analysis
- 4.6. Regulatory Landscape
- 4.7. Current Market Potential and Opportunity Assessment (TAM–SAM–SOM Framework)
- 4.8. DMV Analyst Note
- 4.1. Porters Five Forces
- 5. Market Analysis, Insights and Forecast 2021-2033
- 5.1. Market Analysis, Insights and Forecast - by Type
- 5.1.1. Still Water
- 5.1.2. Sparkling Water
- 5.1.3. Functional Water
- 5.2. Market Analysis, Insights and Forecast - by Distribution Channel
- 5.2.1. Supermarkets and Hypermarkets
- 5.2.2. Convenience Stores
- 5.2.3. Home and Office Delivery
- 5.2.4. On-trade
- 5.2.5. Other Distribution Channels
- 5.3. Market Analysis, Insights and Forecast - by Region
- 5.3.1. North America
- 5.3.2. South America
- 5.3.3. Europe
- 5.3.4. Middle East & Africa
- 5.3.5. Asia Pacific
- 5.1. Market Analysis, Insights and Forecast - by Type
- 6. Global Bottled Water Industry Analysis, Insights and Forecast, 2021-2033
- 6.1. Market Analysis, Insights and Forecast - by Type
- 6.1.1. Still Water
- 6.1.2. Sparkling Water
- 6.1.3. Functional Water
- 6.2. Market Analysis, Insights and Forecast - by Distribution Channel
- 6.2.1. Supermarkets and Hypermarkets
- 6.2.2. Convenience Stores
- 6.2.3. Home and Office Delivery
- 6.2.4. On-trade
- 6.2.5. Other Distribution Channels
- 6.1. Market Analysis, Insights and Forecast - by Type
- 7. North America Bottled Water Industry Analysis, Insights and Forecast, 2020-2032
- 7.1. Market Analysis, Insights and Forecast - by Type
- 7.1.1. Still Water
- 7.1.2. Sparkling Water
- 7.1.3. Functional Water
- 7.2. Market Analysis, Insights and Forecast - by Distribution Channel
- 7.2.1. Supermarkets and Hypermarkets
- 7.2.2. Convenience Stores
- 7.2.3. Home and Office Delivery
- 7.2.4. On-trade
- 7.2.5. Other Distribution Channels
- 7.1. Market Analysis, Insights and Forecast - by Type
- 8. South America Bottled Water Industry Analysis, Insights and Forecast, 2020-2032
- 8.1. Market Analysis, Insights and Forecast - by Type
- 8.1.1. Still Water
- 8.1.2. Sparkling Water
- 8.1.3. Functional Water
- 8.2. Market Analysis, Insights and Forecast - by Distribution Channel
- 8.2.1. Supermarkets and Hypermarkets
- 8.2.2. Convenience Stores
- 8.2.3. Home and Office Delivery
- 8.2.4. On-trade
- 8.2.5. Other Distribution Channels
- 8.1. Market Analysis, Insights and Forecast - by Type
- 9. Europe Bottled Water Industry Analysis, Insights and Forecast, 2020-2032
- 9.1. Market Analysis, Insights and Forecast - by Type
- 9.1.1. Still Water
- 9.1.2. Sparkling Water
- 9.1.3. Functional Water
- 9.2. Market Analysis, Insights and Forecast - by Distribution Channel
- 9.2.1. Supermarkets and Hypermarkets
- 9.2.2. Convenience Stores
- 9.2.3. Home and Office Delivery
- 9.2.4. On-trade
- 9.2.5. Other Distribution Channels
- 9.1. Market Analysis, Insights and Forecast - by Type
- 10. Middle East & Africa Bottled Water Industry Analysis, Insights and Forecast, 2020-2032
- 10.1. Market Analysis, Insights and Forecast - by Type
- 10.1.1. Still Water
- 10.1.2. Sparkling Water
- 10.1.3. Functional Water
- 10.2. Market Analysis, Insights and Forecast - by Distribution Channel
- 10.2.1. Supermarkets and Hypermarkets
- 10.2.2. Convenience Stores
- 10.2.3. Home and Office Delivery
- 10.2.4. On-trade
- 10.2.5. Other Distribution Channels
- 10.1. Market Analysis, Insights and Forecast - by Type
- 11. Asia Pacific Bottled Water Industry Analysis, Insights and Forecast, 2020-2032
- 11.1. Market Analysis, Insights and Forecast - by Type
- 11.1.1. Still Water
- 11.1.2. Sparkling Water
- 11.1.3. Functional Water
- 11.2. Market Analysis, Insights and Forecast - by Distribution Channel
- 11.2.1. Supermarkets and Hypermarkets
- 11.2.2. Convenience Stores
- 11.2.3. Home and Office Delivery
- 11.2.4. On-trade
- 11.2.5. Other Distribution Channels
- 11.1. Market Analysis, Insights and Forecast - by Type
- 12. Competitive Analysis
- 12.1. Company Profiles
- 12.1.1 Masafi Inc
- 12.1.1.1. Company Overview
- 12.1.1.2. Products
- 12.1.1.3. Company Financials
- 12.1.1.4. SWOT Analysis
- 12.1.2 Agthia Group PJSC
- 12.1.2.1. Company Overview
- 12.1.2.2. Products
- 12.1.2.3. Company Financials
- 12.1.2.4. SWOT Analysis
- 12.1.3 PepsiCo Inc
- 12.1.3.1. Company Overview
- 12.1.3.2. Products
- 12.1.3.3. Company Financials
- 12.1.3.4. SWOT Analysis
- 12.1.4 Spindrift
- 12.1.4.1. Company Overview
- 12.1.4.2. Products
- 12.1.4.3. Company Financials
- 12.1.4.4. SWOT Analysis
- 12.1.5 National Food Products Company (Oasis Pure Water)
- 12.1.5.1. Company Overview
- 12.1.5.2. Products
- 12.1.5.3. Company Financials
- 12.1.5.4. SWOT Analysis
- 12.1.6 AL Ghadeer Drinking Water LLC
- 12.1.6.1. Company Overview
- 12.1.6.2. Products
- 12.1.6.3. Company Financials
- 12.1.6.4. SWOT Analysis
- 12.1.7 Hint Inc
- 12.1.7.1. Company Overview
- 12.1.7.2. Products
- 12.1.7.3. Company Financials
- 12.1.7.4. SWOT Analysis
- 12.1.8 Mai Dubai*List Not Exhaustive
- 12.1.8.1. Company Overview
- 12.1.8.2. Products
- 12.1.8.3. Company Financials
- 12.1.8.4. SWOT Analysis
- 12.1.9 Dubai Crystal Mineral Water & Refreshments L L C Co
- 12.1.9.1. Company Overview
- 12.1.9.2. Products
- 12.1.9.3. Company Financials
- 12.1.9.4. SWOT Analysis
- 12.1.10 Nestlé S A
- 12.1.10.1. Company Overview
- 12.1.10.2. Products
- 12.1.10.3. Company Financials
- 12.1.10.4. SWOT Analysis
- 12.1.1 Masafi Inc
- 12.2. Market Entropy
- 12.2.1 Company's Key Areas Served
- 12.2.2 Recent Developments
- 12.3. Company Market Share Analysis 2025
- 12.3.1 Top 5 Companies Market Share Analysis
- 12.3.2 Top 3 Companies Market Share Analysis
- 12.4. List of Potential Customers
- 13. Research Methodology
List of Figures
- Figure 1: Global Bottled Water Industry Revenue Breakdown (billion, %) by Region 2025 & 2033
- Figure 2: North America Bottled Water Industry Revenue (billion), by Type 2025 & 2033
- Figure 3: North America Bottled Water Industry Revenue Share (%), by Type 2025 & 2033
- Figure 4: North America Bottled Water Industry Revenue (billion), by Distribution Channel 2025 & 2033
- Figure 5: North America Bottled Water Industry Revenue Share (%), by Distribution Channel 2025 & 2033
- Figure 6: North America Bottled Water Industry Revenue (billion), by Country 2025 & 2033
- Figure 7: North America Bottled Water Industry Revenue Share (%), by Country 2025 & 2033
- Figure 8: South America Bottled Water Industry Revenue (billion), by Type 2025 & 2033
- Figure 9: South America Bottled Water Industry Revenue Share (%), by Type 2025 & 2033
- Figure 10: South America Bottled Water Industry Revenue (billion), by Distribution Channel 2025 & 2033
- Figure 11: South America Bottled Water Industry Revenue Share (%), by Distribution Channel 2025 & 2033
- Figure 12: South America Bottled Water Industry Revenue (billion), by Country 2025 & 2033
- Figure 13: South America Bottled Water Industry Revenue Share (%), by Country 2025 & 2033
- Figure 14: Europe Bottled Water Industry Revenue (billion), by Type 2025 & 2033
- Figure 15: Europe Bottled Water Industry Revenue Share (%), by Type 2025 & 2033
- Figure 16: Europe Bottled Water Industry Revenue (billion), by Distribution Channel 2025 & 2033
- Figure 17: Europe Bottled Water Industry Revenue Share (%), by Distribution Channel 2025 & 2033
- Figure 18: Europe Bottled Water Industry Revenue (billion), by Country 2025 & 2033
- Figure 19: Europe Bottled Water Industry Revenue Share (%), by Country 2025 & 2033
- Figure 20: Middle East & Africa Bottled Water Industry Revenue (billion), by Type 2025 & 2033
- Figure 21: Middle East & Africa Bottled Water Industry Revenue Share (%), by Type 2025 & 2033
- Figure 22: Middle East & Africa Bottled Water Industry Revenue (billion), by Distribution Channel 2025 & 2033
- Figure 23: Middle East & Africa Bottled Water Industry Revenue Share (%), by Distribution Channel 2025 & 2033
- Figure 24: Middle East & Africa Bottled Water Industry Revenue (billion), by Country 2025 & 2033
- Figure 25: Middle East & Africa Bottled Water Industry Revenue Share (%), by Country 2025 & 2033
- Figure 26: Asia Pacific Bottled Water Industry Revenue (billion), by Type 2025 & 2033
- Figure 27: Asia Pacific Bottled Water Industry Revenue Share (%), by Type 2025 & 2033
- Figure 28: Asia Pacific Bottled Water Industry Revenue (billion), by Distribution Channel 2025 & 2033
- Figure 29: Asia Pacific Bottled Water Industry Revenue Share (%), by Distribution Channel 2025 & 2033
- Figure 30: Asia Pacific Bottled Water Industry Revenue (billion), by Country 2025 & 2033
- Figure 31: Asia Pacific Bottled Water Industry Revenue Share (%), by Country 2025 & 2033
List of Tables
- Table 1: Global Bottled Water Industry Revenue billion Forecast, by Type 2020 & 2033
- Table 2: Global Bottled Water Industry Revenue billion Forecast, by Distribution Channel 2020 & 2033
- Table 3: Global Bottled Water Industry Revenue billion Forecast, by Region 2020 & 2033
- Table 4: Global Bottled Water Industry Revenue billion Forecast, by Type 2020 & 2033
- Table 5: Global Bottled Water Industry Revenue billion Forecast, by Distribution Channel 2020 & 2033
- Table 6: Global Bottled Water Industry Revenue billion Forecast, by Country 2020 & 2033
- Table 7: United States Bottled Water Industry Revenue (billion) Forecast, by Application 2020 & 2033
- Table 8: Canada Bottled Water Industry Revenue (billion) Forecast, by Application 2020 & 2033
- Table 9: Mexico Bottled Water Industry Revenue (billion) Forecast, by Application 2020 & 2033
- Table 10: Global Bottled Water Industry Revenue billion Forecast, by Type 2020 & 2033
- Table 11: Global Bottled Water Industry Revenue billion Forecast, by Distribution Channel 2020 & 2033
- Table 12: Global Bottled Water Industry Revenue billion Forecast, by Country 2020 & 2033
- Table 13: Brazil Bottled Water Industry Revenue (billion) Forecast, by Application 2020 & 2033
- Table 14: Argentina Bottled Water Industry Revenue (billion) Forecast, by Application 2020 & 2033
- Table 15: Rest of South America Bottled Water Industry Revenue (billion) Forecast, by Application 2020 & 2033
- Table 16: Global Bottled Water Industry Revenue billion Forecast, by Type 2020 & 2033
- Table 17: Global Bottled Water Industry Revenue billion Forecast, by Distribution Channel 2020 & 2033
- Table 18: Global Bottled Water Industry Revenue billion Forecast, by Country 2020 & 2033
- Table 19: United Kingdom Bottled Water Industry Revenue (billion) Forecast, by Application 2020 & 2033
- Table 20: Germany Bottled Water Industry Revenue (billion) Forecast, by Application 2020 & 2033
- Table 21: France Bottled Water Industry Revenue (billion) Forecast, by Application 2020 & 2033
- Table 22: Italy Bottled Water Industry Revenue (billion) Forecast, by Application 2020 & 2033
- Table 23: Spain Bottled Water Industry Revenue (billion) Forecast, by Application 2020 & 2033
- Table 24: Russia Bottled Water Industry Revenue (billion) Forecast, by Application 2020 & 2033
- Table 25: Benelux Bottled Water Industry Revenue (billion) Forecast, by Application 2020 & 2033
- Table 26: Nordics Bottled Water Industry Revenue (billion) Forecast, by Application 2020 & 2033
- Table 27: Rest of Europe Bottled Water Industry Revenue (billion) Forecast, by Application 2020 & 2033
- Table 28: Global Bottled Water Industry Revenue billion Forecast, by Type 2020 & 2033
- Table 29: Global Bottled Water Industry Revenue billion Forecast, by Distribution Channel 2020 & 2033
- Table 30: Global Bottled Water Industry Revenue billion Forecast, by Country 2020 & 2033
- Table 31: Turkey Bottled Water Industry Revenue (billion) Forecast, by Application 2020 & 2033
- Table 32: Israel Bottled Water Industry Revenue (billion) Forecast, by Application 2020 & 2033
- Table 33: GCC Bottled Water Industry Revenue (billion) Forecast, by Application 2020 & 2033
- Table 34: North Africa Bottled Water Industry Revenue (billion) Forecast, by Application 2020 & 2033
- Table 35: South Africa Bottled Water Industry Revenue (billion) Forecast, by Application 2020 & 2033
- Table 36: Rest of Middle East & Africa Bottled Water Industry Revenue (billion) Forecast, by Application 2020 & 2033
- Table 37: Global Bottled Water Industry Revenue billion Forecast, by Type 2020 & 2033
- Table 38: Global Bottled Water Industry Revenue billion Forecast, by Distribution Channel 2020 & 2033
- Table 39: Global Bottled Water Industry Revenue billion Forecast, by Country 2020 & 2033
- Table 40: China Bottled Water Industry Revenue (billion) Forecast, by Application 2020 & 2033
- Table 41: India Bottled Water Industry Revenue (billion) Forecast, by Application 2020 & 2033
- Table 42: Japan Bottled Water Industry Revenue (billion) Forecast, by Application 2020 & 2033
- Table 43: South Korea Bottled Water Industry Revenue (billion) Forecast, by Application 2020 & 2033
- Table 44: ASEAN Bottled Water Industry Revenue (billion) Forecast, by Application 2020 & 2033
- Table 45: Oceania Bottled Water Industry Revenue (billion) Forecast, by Application 2020 & 2033
- Table 46: Rest of Asia Pacific Bottled Water Industry Revenue (billion) Forecast, by Application 2020 & 2033
Frequently Asked Questions
1. What is the projected Compound Annual Growth Rate (CAGR) of the Bottled Water Industry?
The projected CAGR is approximately 5.3%.
2. Which companies are prominent players in the Bottled Water Industry?
Key companies in the market include Masafi Inc, Agthia Group PJSC, PepsiCo Inc, Spindrift, National Food Products Company (Oasis Pure Water), AL Ghadeer Drinking Water LLC, Hint Inc, Mai Dubai*List Not Exhaustive, Dubai Crystal Mineral Water & Refreshments L L C Co, Nestlé S A.
3. What are the main segments of the Bottled Water Industry?
The market segments include Type, Distribution Channel.
4. Can you provide details about the market size?
The market size is estimated to be USD 353.61 billion as of 2022.
5. What are some drivers contributing to market growth?
Increasing Demand for Protein-Rich Food; Increasing Demand for Plant-Based and Organic Ingredients.
6. What are the notable trends driving market growth?
Surge in the Demand for Functional/Fortified and Flavored Water.
7. Are there any restraints impacting market growth?
Presence of Counterfeit Products.
8. Can you provide examples of recent developments in the market?
September 2021: Masafi Inc. launched "Source", the premium and sustainable water bottle in the UAE, produced by hydro panel technology, which uses the energy and heat of the sun to create premium drinking water.
9. What pricing options are available for accessing the report?
Pricing options include single-user, multi-user, and enterprise licenses priced at USD 3800, USD 4500, and USD 5800 respectively.
10. Is the market size provided in terms of value or volume?
The market size is provided in terms of value, measured in billion.
11. Are there any specific market keywords associated with the report?
Yes, the market keyword associated with the report is "Bottled Water Industry," which aids in identifying and referencing the specific market segment covered.
12. How do I determine which pricing option suits my needs best?
The pricing options vary based on user requirements and access needs. Individual users may opt for single-user licenses, while businesses requiring broader access may choose multi-user or enterprise licenses for cost-effective access to the report.
13. Are there any additional resources or data provided in the Bottled Water Industry report?
While the report offers comprehensive insights, it's advisable to review the specific contents or supplementary materials provided to ascertain if additional resources or data are available.
14. How can I stay updated on further developments or reports in the Bottled Water Industry?
To stay informed about further developments, trends, and reports in the Bottled Water Industry, consider subscribing to industry newsletters, following relevant companies and organizations, or regularly checking reputable industry news sources and publications.
Methodology
Step 1 - Identification of Relevant Samples Size from Population Database


Step 2 - Approaches for Defining Global Market Size (Value, Volume* & Price*)

Note*: In applicable scenarios
Step 3 - Data Sources
Primary Research
- Web Analytics
- Survey Reports
- Research Institute
- Latest Research Reports
- Opinion Leaders
Secondary Research
- Annual Reports
- White Paper
- Latest Press Release
- Industry Association
- Paid Database
- Investor Presentations

Step 4 - Data Triangulation
Involves using different sources of information in order to increase the validity of a study
These sources are likely to be stakeholders in a program - participants, other researchers, program staff, other community members, and so on.
Then we put all data in single framework & apply various statistical tools to find out the dynamic on the market.
During the analysis stage, feedback from the stakeholder groups would be compared to determine areas of agreement as well as areas of divergence