

Key Insights
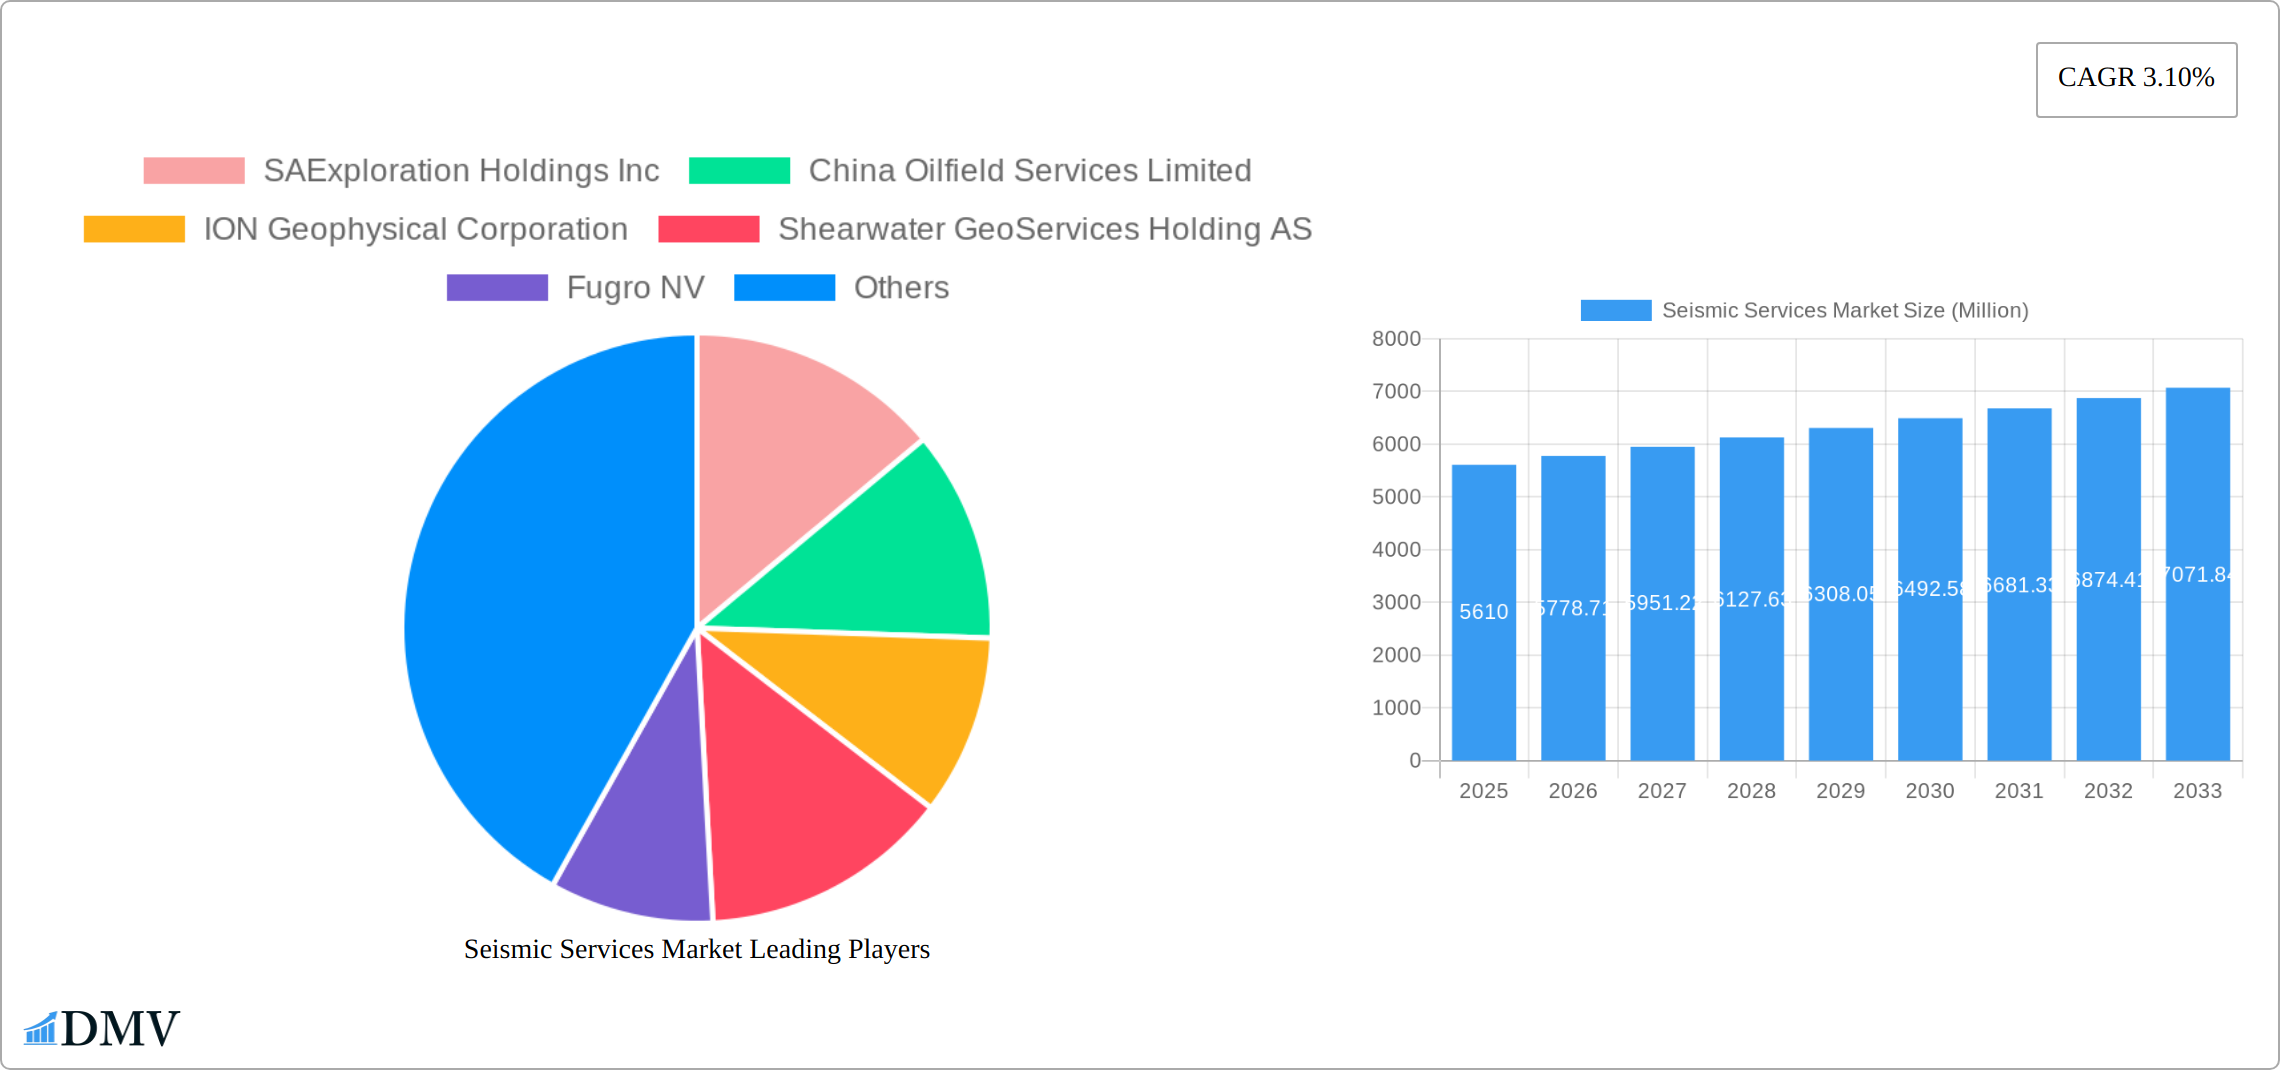
The global seismic services market, valued at $5.61 billion in 2025, is projected to experience steady growth, driven by increasing exploration and production activities in the oil and gas industry, particularly in offshore environments. The market's Compound Annual Growth Rate (CAGR) of 3.10% from 2025 to 2033 indicates a consistent, albeit moderate, expansion. Key drivers include the ongoing demand for accurate subsurface imaging to identify and evaluate hydrocarbon reserves, advancements in seismic acquisition and processing technologies (such as 3D and 4D seismic surveys), and the growing adoption of integrated solutions that combine data acquisition, processing, and interpretation services. The market is segmented by service type (data acquisition, data processing and interpretation) and location of deployment (onshore and offshore), with the offshore segment expected to dominate due to the higher concentration of exploration and production activities in deeper waters. However, restraints such as fluctuating oil and gas prices, environmental regulations, and technological complexities in deepwater operations could potentially temper growth. The competitive landscape is characterized by a mix of large multinational corporations and specialized service providers. Companies like Schlumberger, Halliburton, and CGG are major players, leveraging their extensive technological capabilities and global reach. Regional growth is expected to be varied, with regions like North America and Asia-Pacific showing significant market potential, driven by large-scale exploration projects and a strong energy demand.
The forecast period (2025-2033) anticipates a gradual increase in market size, influenced by technological improvements in seismic data acquisition and interpretation. The focus on improved efficiency and cost-effectiveness in exploration activities will further shape the market's trajectory. Increased investment in renewable energy sources could potentially impact the long-term growth rate, yet the immediate future remains optimistic for the seismic services market, predicated on existing oil and gas exploration and production plans. The ongoing demand for enhanced reservoir characterization, alongside the development of more sophisticated imaging techniques, will continue to provide opportunities for market expansion within the foreseeable future. The strategic alliances and mergers and acquisitions within the industry will further influence the market dynamics, impacting the competitive landscape and overall market share distribution across different regions and service segments.
Seismic Services Market Market Composition & Trends
The Seismic Services Market is a dynamic landscape shaped by a diverse range of players and significant technological advancements. Market concentration is moderate, with key players such as SAExploration Holdings Inc, China Oilfield Services Limited, and ION Geophysical Corporation holding substantial market shares. However, a significant portion (70%) is distributed amongst a larger number of smaller companies, indicating a competitive market environment.
Innovation is a crucial driver, fueled by the continuous demand for more efficient and accurate data acquisition and processing technologies. Companies are investing heavily in Research & Development (R&D) to improve the speed, accuracy, and environmental sustainability of seismic surveys. This includes exploring and implementing cutting-edge technologies such as AI and Machine Learning for data analysis and interpretation, as well as the adoption of more environmentally conscious methodologies. The regulatory environment remains stringent, particularly in North America and Europe, with a strong focus on environmental protection and minimizing the impact of seismic operations.
While alternative technologies, like satellite-based seismic surveys, represent potential substitutes, they are currently in the early stages of development and adoption. Traditional methods remain dominant. The primary end-users are major oil and gas companies and exploration firms, with a notable and growing demand for offshore seismic services. Mergers and acquisitions (M&A) activity has been notable, exemplified by the acquisition of Magseis Fairfield ASA by WGP Group Ltd in 2021 for approximately $1.35 million. This highlights the ongoing consolidation and strategic positioning within the industry.
- SAExploration Holdings Inc: 12%
- China Oilfield Services Limited: 10%
- ION Geophysical Corporation: 8%
- Others: 70%
The market's future trajectory is inextricably linked to technological advancements and a global push for more sustainable practices. Companies are increasingly prioritizing the reduction of environmental impact through innovative technologies and optimized operational procedures.
Seismic Services Market Industry Evolution
The Seismic Services Market has demonstrated consistent growth between 2019 and 2024, with a Compound Annual Growth Rate (CAGR) of 4.5%, reaching a market value of $3.2 billion by the end of 2024. Building on this momentum, the market is projected to reach $3.4 billion in 2025 and continue its upward trajectory through 2033, achieving a projected value of $5.1 billion. This growth is projected at a CAGR of 5.2% during this forecast period (2025-2033).
This evolution is significantly influenced by technological advancements. The adoption of 4D seismic technology, which provides time-lapse monitoring of reservoirs, has seen impressive annual growth exceeding 20% since 2020. The integration of AI and ML in data processing and interpretation is improving accuracy and efficiency, leading to more precise and cost-effective exploration and production strategies. Furthermore, evolving consumer demands are driving a shift towards sustainable and cost-effective solutions. Companies are actively developing environmentally friendly seismic technologies and implementing operational efficiencies to address these market preferences.
A notable shift is underway from onshore to offshore seismic services. This is driven by the discovery of new offshore reserves and advancements in offshore exploration technologies. This trend is expected to continue, with offshore services projected to grow at a CAGR of 6% during the forecast period, outpacing the onshore segment's growth rate of 4%.
Leading Regions, Countries, or Segments in Seismic Services Market
The offshore segment dominates the Seismic Services Market, particularly in regions like the Middle East and North America. This dominance is driven by a confluence of factors:
- Robust Investment Trends: Substantial investments in offshore exploration projects, particularly in the Middle East, with leading nations like the UAE and Saudi Arabia spearheading this expansion.
- Supportive Regulatory Environments: Favorable government policies and incentives promoting offshore exploration in key areas such as the Gulf of Mexico and the North Sea.
- Cutting-Edge Technological Advancements: The development of sophisticated offshore seismic technologies allows for deeper and more accurate exploration, unlocking previously inaccessible reserves.
The offshore segment’s strength is further evidenced by recent significant discoveries, such as ADNOC's substantial gas discovery in the UAE's Northwest, estimated to hold between 1.5 and 2 trillion standard cubic feet of gas. Such discoveries highlight the vast potential for future offshore exploration and reinforce the pivotal role of seismic services in realizing these resources.
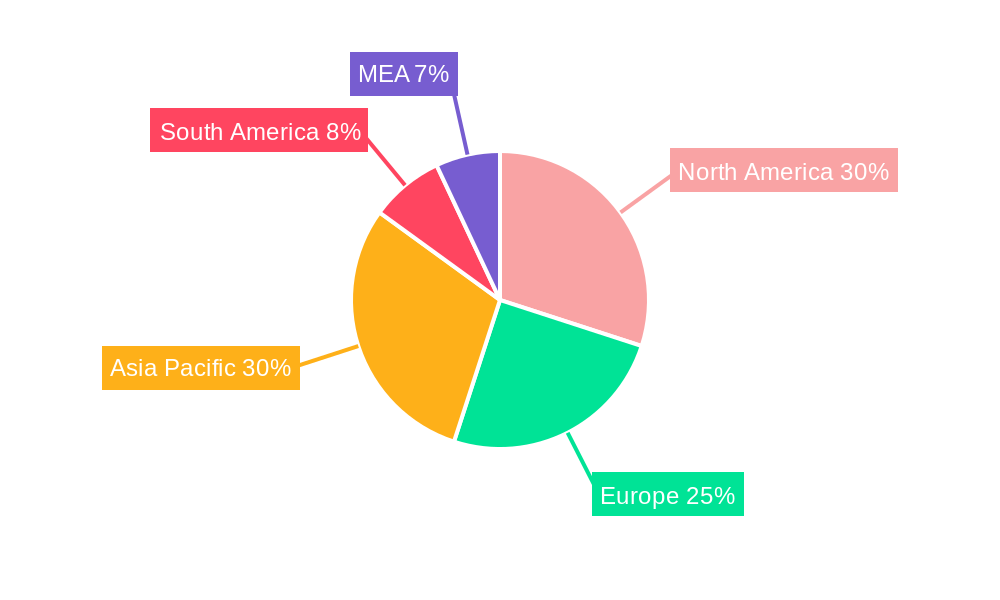
North America, particularly the United States, plays a major role, excelling in both onshore and offshore exploration. This region leverages a well-established oil and gas industry, advanced technological infrastructure, and a conducive regulatory environment. The Data Acquisition segment is exceptionally strong, driven by the demand for high-resolution seismic data to optimize exploration efforts.
The Middle East, meanwhile, is experiencing rapid growth in the offshore segment due to its large untapped reserves and the strategic importance of energy security. Countries such as the UAE and Saudi Arabia are significantly investing in offshore seismic surveys to boost their oil and gas production capacity.
Seismic Services Market Product Innovations
Product innovations in the Seismic Services Market are focused on enhancing data accuracy, reducing environmental impact, and improving operational efficiency. Recent advancements include the development of autonomous underwater vehicles (AUVs) for seismic data acquisition, which offer greater flexibility and reduced operational costs. Additionally, the integration of AI and ML in data processing has led to more accurate and faster interpretation of seismic data, enabling companies to make more informed exploration decisions. These innovations not only improve the performance of seismic services but also provide a competitive edge to companies that adopt them early.
Propelling Factors for Seismic Services Market Growth
The growth of the Seismic Services Market is propelled by several key factors:
- Technological Advancements: The integration of AI and ML in seismic data processing has significantly improved efficiency and accuracy, driving demand for advanced seismic services.
- Economic Factors: The increasing global demand for oil and gas, coupled with the need to explore new reserves, fuels the growth of the seismic services market.
- Regulatory Influences: Supportive government policies and incentives for exploration, particularly in offshore regions, encourage investment in seismic services.
These factors collectively contribute to the market's expansion, with companies like Schlumberger NV and CGG SA leading the way in technological innovation and exploration services.
Obstacles in the Seismic Services Market Market
Several challenges could impede the growth of the Seismic Services Market:
- Regulatory Hurdles: Stringent environmental regulations, especially in offshore areas, can increase operational costs and potentially delay project timelines.
- Supply Chain Vulnerabilities: Global supply chain disruptions can affect the availability of essential equipment and technologies, causing project delays and impacting profitability.
- Intense Competition: Fierce competition among service providers can lead to price wars and reduced profit margins, potentially slowing overall market growth.
Addressing these challenges will require strategic planning, technological innovation, and proactive risk management to ensure sustained growth and market profitability.
Future Opportunities in Seismic Services Market
The Seismic Services Market presents several future opportunities:
- New Markets: Emerging markets in Africa and Asia offer untapped potential for seismic services, driven by increasing energy demands.
- Technological Innovations: Continued advancements in seismic technology, such as the use of drones and AUVs, open new avenues for exploration.
- Consumer Trends: A growing focus on sustainability and efficiency is driving demand for eco-friendly seismic solutions.
These opportunities highlight the market's potential for growth and innovation in the coming years.
Major Players in the Seismic Services Market Ecosystem
- SAExploration Holdings Inc
- China Oilfield Services Limited
- ION Geophysical Corporation
- Shearwater GeoServices Holding AS
- Fugro NV
- Schlumberger NV
- CGG SA
- Briscoe Group Limited
- Halliburton Company
- SeaBird Exploration PLC
- Magseis Fairfield ASA (WGP Group Ltd)
- TGS ASA
- Polarcus Ltd
- PGS ASA
Key Developments in Seismic Services Market Industry
- May 2023: TGS, in partnership with PGS and Schlumberger, secured pre-funding for a 6,885 square kilometer (2,658 square miles) multi-client 3D seismic survey offshore Malaysia in the North Luconia Province of the Sarawak Basin. This development signifies a strategic move to expand exploration capabilities in the region, potentially leading to new oil and gas discoveries.
- February 2022: Abu Dhabi's state-owned oil and gas company ADNOC announced the discovery of between 1.5 to 2 trillion standard cubic feet of gas in an offshore area located in the Emirate's Northwest. This discovery underscores the importance of seismic services in identifying new reserves and supports the growth of the offshore segment.
- January 2022: Shearwater GeoServices secured contracts for two multicomponent surveys in offshore Western Australia with the oil and gas company Santos. The two-month program covers the Keraudren North Extension with an area of approximately 680 sq. km in the Bedout Basin and the Petrel Sub-Basin 3D survey of roughly 1,100 sq. km. These contracts highlight the demand for advanced seismic services in exploring new offshore reserves.
Strategic Seismic Services Market Market Forecast
The Seismic Services Market is poised for substantial growth between 2025 and 2033, fueled by technological innovation, increasing global energy demand, and supportive regulatory environments in key regions. The market is projected to reach a value of $5.1 billion by 2033, maintaining a CAGR of 5.2%. Future opportunities lie in expanding into new markets, notably in Africa and Asia, and adopting innovative technologies such as drones and Autonomous Underwater Vehicles (AUVs) to enhance efficiency and reduce environmental impact. The ongoing emphasis on sustainability and operational efficiency will continue driving demand for eco-friendly seismic solutions, ensuring the market's long-term growth and development.
Seismic Services Market Segmentation
-
1. Service
- 1.1. Data Acquisition
- 1.2. Data Processing and Interpretation
-
2. Location of Deployment
- 2.1. Onshore
- 2.2. Offshore
Seismic Services Market Segmentation By Geography
-
1. North America
- 1.1. United States of America
- 1.2. Canada
- 1.3. Rest of North America
-
2. Asia Pacific
- 2.1. China
- 2.2. India
- 2.3. Australia
- 2.4. Rest of Asia Pacific
-
3. Europe
- 3.1. Germany
- 3.2. Russia
- 3.3. United Kingdom
- 3.4. France
- 3.5. Rest of Europe
-
4. South America
- 4.1. Brazil
- 4.2. Argentina
- 4.3. Rest of the South America
-
5. Middle East and Africa
- 5.1. United Arab Emirates
- 5.2. Saudi Arabia
- 5.3. Iran
- 5.4. Iraq
- 5.5. Rest of the Middle East and Africa
Seismic Services Market REPORT HIGHLIGHTS
| Aspects | Details |
|---|---|
| Study Period | 2019-2033 |
| Base Year | 2024 |
| Estimated Year | 2025 |
| Forecast Period | 2025-2033 |
| Historical Period | 2019-2024 |
| Growth Rate | CAGR of 3.10% from 2019-2033 |
| Segmentation |
|
Table of Contents
- 1. Introduction
- 1.1. Research Scope
- 1.2. Market Segmentation
- 1.3. Research Methodology
- 1.4. Definitions and Assumptions
- 2. Executive Summary
- 2.1. Introduction
- 3. Market Dynamics
- 3.1. Introduction
- 3.2. Market Drivers
- 3.2.1 4.; Increasing Exploration in Offshore Areas4.; The Strengthening of Crude Oil Prices
- 3.2.2 Making the Upstream Activities Economically Feasible
- 3.3. Market Restrains
- 3.3.1. 4.; Shifting to Renewable Energy Sources
- 3.4. Market Trends
- 3.4.1. Increasing Demand from the Offshore Oil and Gas Industry
- 4. Market Factor Analysis
- 4.1. Porters Five Forces
- 4.2. Supply/Value Chain
- 4.3. PESTEL analysis
- 4.4. Market Entropy
- 4.5. Patent/Trademark Analysis
- 5. Global Seismic Services Market Analysis, Insights and Forecast, 2019-2031
- 5.1. Market Analysis, Insights and Forecast - by Service
- 5.1.1. Data Acquisition
- 5.1.2. Data Processing and Interpretation
- 5.2. Market Analysis, Insights and Forecast - by Location of Deployment
- 5.2.1. Onshore
- 5.2.2. Offshore
- 5.3. Market Analysis, Insights and Forecast - by Region
- 5.3.1. North America
- 5.3.2. Asia Pacific
- 5.3.3. Europe
- 5.3.4. South America
- 5.3.5. Middle East and Africa
- 5.1. Market Analysis, Insights and Forecast - by Service
- 6. North America Seismic Services Market Analysis, Insights and Forecast, 2019-2031
- 6.1. Market Analysis, Insights and Forecast - by Service
- 6.1.1. Data Acquisition
- 6.1.2. Data Processing and Interpretation
- 6.2. Market Analysis, Insights and Forecast - by Location of Deployment
- 6.2.1. Onshore
- 6.2.2. Offshore
- 6.1. Market Analysis, Insights and Forecast - by Service
- 7. Asia Pacific Seismic Services Market Analysis, Insights and Forecast, 2019-2031
- 7.1. Market Analysis, Insights and Forecast - by Service
- 7.1.1. Data Acquisition
- 7.1.2. Data Processing and Interpretation
- 7.2. Market Analysis, Insights and Forecast - by Location of Deployment
- 7.2.1. Onshore
- 7.2.2. Offshore
- 7.1. Market Analysis, Insights and Forecast - by Service
- 8. Europe Seismic Services Market Analysis, Insights and Forecast, 2019-2031
- 8.1. Market Analysis, Insights and Forecast - by Service
- 8.1.1. Data Acquisition
- 8.1.2. Data Processing and Interpretation
- 8.2. Market Analysis, Insights and Forecast - by Location of Deployment
- 8.2.1. Onshore
- 8.2.2. Offshore
- 8.1. Market Analysis, Insights and Forecast - by Service
- 9. South America Seismic Services Market Analysis, Insights and Forecast, 2019-2031
- 9.1. Market Analysis, Insights and Forecast - by Service
- 9.1.1. Data Acquisition
- 9.1.2. Data Processing and Interpretation
- 9.2. Market Analysis, Insights and Forecast - by Location of Deployment
- 9.2.1. Onshore
- 9.2.2. Offshore
- 9.1. Market Analysis, Insights and Forecast - by Service
- 10. Middle East and Africa Seismic Services Market Analysis, Insights and Forecast, 2019-2031
- 10.1. Market Analysis, Insights and Forecast - by Service
- 10.1.1. Data Acquisition
- 10.1.2. Data Processing and Interpretation
- 10.2. Market Analysis, Insights and Forecast - by Location of Deployment
- 10.2.1. Onshore
- 10.2.2. Offshore
- 10.1. Market Analysis, Insights and Forecast - by Service
- 11. North America Seismic Services Market Analysis, Insights and Forecast, 2019-2031
- 11.1. Market Analysis, Insights and Forecast - By Country/Sub-region
- 11.1.1 United States
- 11.1.2 Canada
- 11.1.3 Mexico
- 12. Europe Seismic Services Market Analysis, Insights and Forecast, 2019-2031
- 12.1. Market Analysis, Insights and Forecast - By Country/Sub-region
- 12.1.1 Germany
- 12.1.2 United Kingdom
- 12.1.3 France
- 12.1.4 Spain
- 12.1.5 Italy
- 12.1.6 Spain
- 12.1.7 Belgium
- 12.1.8 Netherland
- 12.1.9 Nordics
- 12.1.10 Rest of Europe
- 13. Asia Pacific Seismic Services Market Analysis, Insights and Forecast, 2019-2031
- 13.1. Market Analysis, Insights and Forecast - By Country/Sub-region
- 13.1.1 China
- 13.1.2 Japan
- 13.1.3 India
- 13.1.4 South Korea
- 13.1.5 Southeast Asia
- 13.1.6 Australia
- 13.1.7 Indonesia
- 13.1.8 Phillipes
- 13.1.9 Singapore
- 13.1.10 Thailandc
- 13.1.11 Rest of Asia Pacific
- 14. South America Seismic Services Market Analysis, Insights and Forecast, 2019-2031
- 14.1. Market Analysis, Insights and Forecast - By Country/Sub-region
- 14.1.1 Brazil
- 14.1.2 Argentina
- 14.1.3 Peru
- 14.1.4 Chile
- 14.1.5 Colombia
- 14.1.6 Ecuador
- 14.1.7 Venezuela
- 14.1.8 Rest of South America
- 15. MEA Seismic Services Market Analysis, Insights and Forecast, 2019-2031
- 15.1. Market Analysis, Insights and Forecast - By Country/Sub-region
- 15.1.1 United Arab Emirates
- 15.1.2 Saudi Arabia
- 15.1.3 South Africa
- 15.1.4 Rest of Middle East and Africa
- 16. Competitive Analysis
- 16.1. Global Market Share Analysis 2024
- 16.2. Company Profiles
- 16.2.1 SAExploration Holdings Inc
- 16.2.1.1. Overview
- 16.2.1.2. Products
- 16.2.1.3. SWOT Analysis
- 16.2.1.4. Recent Developments
- 16.2.1.5. Financials (Based on Availability)
- 16.2.2 China Oilfield Services Limited
- 16.2.2.1. Overview
- 16.2.2.2. Products
- 16.2.2.3. SWOT Analysis
- 16.2.2.4. Recent Developments
- 16.2.2.5. Financials (Based on Availability)
- 16.2.3 ION Geophysical Corporation
- 16.2.3.1. Overview
- 16.2.3.2. Products
- 16.2.3.3. SWOT Analysis
- 16.2.3.4. Recent Developments
- 16.2.3.5. Financials (Based on Availability)
- 16.2.4 Shearwater GeoServices Holding AS
- 16.2.4.1. Overview
- 16.2.4.2. Products
- 16.2.4.3. SWOT Analysis
- 16.2.4.4. Recent Developments
- 16.2.4.5. Financials (Based on Availability)
- 16.2.5 Fugro NV
- 16.2.5.1. Overview
- 16.2.5.2. Products
- 16.2.5.3. SWOT Analysis
- 16.2.5.4. Recent Developments
- 16.2.5.5. Financials (Based on Availability)
- 16.2.6 Schlumberger NV
- 16.2.6.1. Overview
- 16.2.6.2. Products
- 16.2.6.3. SWOT Analysis
- 16.2.6.4. Recent Developments
- 16.2.6.5. Financials (Based on Availability)
- 16.2.7 CGG SA
- 16.2.7.1. Overview
- 16.2.7.2. Products
- 16.2.7.3. SWOT Analysis
- 16.2.7.4. Recent Developments
- 16.2.7.5. Financials (Based on Availability)
- 16.2.8 Briscoe Group Limited
- 16.2.8.1. Overview
- 16.2.8.2. Products
- 16.2.8.3. SWOT Analysis
- 16.2.8.4. Recent Developments
- 16.2.8.5. Financials (Based on Availability)
- 16.2.9 Halliburton Company
- 16.2.9.1. Overview
- 16.2.9.2. Products
- 16.2.9.3. SWOT Analysis
- 16.2.9.4. Recent Developments
- 16.2.9.5. Financials (Based on Availability)
- 16.2.10 SeaBird Exploration PLC
- 16.2.10.1. Overview
- 16.2.10.2. Products
- 16.2.10.3. SWOT Analysis
- 16.2.10.4. Recent Developments
- 16.2.10.5. Financials (Based on Availability)
- 16.2.11 Magseis Fairfield ASA (WGP Group Ltd)
- 16.2.11.1. Overview
- 16.2.11.2. Products
- 16.2.11.3. SWOT Analysis
- 16.2.11.4. Recent Developments
- 16.2.11.5. Financials (Based on Availability)
- 16.2.12 TGS ASA
- 16.2.12.1. Overview
- 16.2.12.2. Products
- 16.2.12.3. SWOT Analysis
- 16.2.12.4. Recent Developments
- 16.2.12.5. Financials (Based on Availability)
- 16.2.13 Polarcus Ltd
- 16.2.13.1. Overview
- 16.2.13.2. Products
- 16.2.13.3. SWOT Analysis
- 16.2.13.4. Recent Developments
- 16.2.13.5. Financials (Based on Availability)
- 16.2.14 PGS ASA
- 16.2.14.1. Overview
- 16.2.14.2. Products
- 16.2.14.3. SWOT Analysis
- 16.2.14.4. Recent Developments
- 16.2.14.5. Financials (Based on Availability)
- 16.2.1 SAExploration Holdings Inc
List of Figures
- Figure 1: Global Seismic Services Market Revenue Breakdown (Million, %) by Region 2024 & 2032
- Figure 2: North America Seismic Services Market Revenue (Million), by Country 2024 & 2032
- Figure 3: North America Seismic Services Market Revenue Share (%), by Country 2024 & 2032
- Figure 4: Europe Seismic Services Market Revenue (Million), by Country 2024 & 2032
- Figure 5: Europe Seismic Services Market Revenue Share (%), by Country 2024 & 2032
- Figure 6: Asia Pacific Seismic Services Market Revenue (Million), by Country 2024 & 2032
- Figure 7: Asia Pacific Seismic Services Market Revenue Share (%), by Country 2024 & 2032
- Figure 8: South America Seismic Services Market Revenue (Million), by Country 2024 & 2032
- Figure 9: South America Seismic Services Market Revenue Share (%), by Country 2024 & 2032
- Figure 10: MEA Seismic Services Market Revenue (Million), by Country 2024 & 2032
- Figure 11: MEA Seismic Services Market Revenue Share (%), by Country 2024 & 2032
- Figure 12: North America Seismic Services Market Revenue (Million), by Service 2024 & 2032
- Figure 13: North America Seismic Services Market Revenue Share (%), by Service 2024 & 2032
- Figure 14: North America Seismic Services Market Revenue (Million), by Location of Deployment 2024 & 2032
- Figure 15: North America Seismic Services Market Revenue Share (%), by Location of Deployment 2024 & 2032
- Figure 16: North America Seismic Services Market Revenue (Million), by Country 2024 & 2032
- Figure 17: North America Seismic Services Market Revenue Share (%), by Country 2024 & 2032
- Figure 18: Asia Pacific Seismic Services Market Revenue (Million), by Service 2024 & 2032
- Figure 19: Asia Pacific Seismic Services Market Revenue Share (%), by Service 2024 & 2032
- Figure 20: Asia Pacific Seismic Services Market Revenue (Million), by Location of Deployment 2024 & 2032
- Figure 21: Asia Pacific Seismic Services Market Revenue Share (%), by Location of Deployment 2024 & 2032
- Figure 22: Asia Pacific Seismic Services Market Revenue (Million), by Country 2024 & 2032
- Figure 23: Asia Pacific Seismic Services Market Revenue Share (%), by Country 2024 & 2032
- Figure 24: Europe Seismic Services Market Revenue (Million), by Service 2024 & 2032
- Figure 25: Europe Seismic Services Market Revenue Share (%), by Service 2024 & 2032
- Figure 26: Europe Seismic Services Market Revenue (Million), by Location of Deployment 2024 & 2032
- Figure 27: Europe Seismic Services Market Revenue Share (%), by Location of Deployment 2024 & 2032
- Figure 28: Europe Seismic Services Market Revenue (Million), by Country 2024 & 2032
- Figure 29: Europe Seismic Services Market Revenue Share (%), by Country 2024 & 2032
- Figure 30: South America Seismic Services Market Revenue (Million), by Service 2024 & 2032
- Figure 31: South America Seismic Services Market Revenue Share (%), by Service 2024 & 2032
- Figure 32: South America Seismic Services Market Revenue (Million), by Location of Deployment 2024 & 2032
- Figure 33: South America Seismic Services Market Revenue Share (%), by Location of Deployment 2024 & 2032
- Figure 34: South America Seismic Services Market Revenue (Million), by Country 2024 & 2032
- Figure 35: South America Seismic Services Market Revenue Share (%), by Country 2024 & 2032
- Figure 36: Middle East and Africa Seismic Services Market Revenue (Million), by Service 2024 & 2032
- Figure 37: Middle East and Africa Seismic Services Market Revenue Share (%), by Service 2024 & 2032
- Figure 38: Middle East and Africa Seismic Services Market Revenue (Million), by Location of Deployment 2024 & 2032
- Figure 39: Middle East and Africa Seismic Services Market Revenue Share (%), by Location of Deployment 2024 & 2032
- Figure 40: Middle East and Africa Seismic Services Market Revenue (Million), by Country 2024 & 2032
- Figure 41: Middle East and Africa Seismic Services Market Revenue Share (%), by Country 2024 & 2032
List of Tables
- Table 1: Global Seismic Services Market Revenue Million Forecast, by Region 2019 & 2032
- Table 2: Global Seismic Services Market Revenue Million Forecast, by Service 2019 & 2032
- Table 3: Global Seismic Services Market Revenue Million Forecast, by Location of Deployment 2019 & 2032
- Table 4: Global Seismic Services Market Revenue Million Forecast, by Region 2019 & 2032
- Table 5: Global Seismic Services Market Revenue Million Forecast, by Country 2019 & 2032
- Table 6: United States Seismic Services Market Revenue (Million) Forecast, by Application 2019 & 2032
- Table 7: Canada Seismic Services Market Revenue (Million) Forecast, by Application 2019 & 2032
- Table 8: Mexico Seismic Services Market Revenue (Million) Forecast, by Application 2019 & 2032
- Table 9: Global Seismic Services Market Revenue Million Forecast, by Country 2019 & 2032
- Table 10: Germany Seismic Services Market Revenue (Million) Forecast, by Application 2019 & 2032
- Table 11: United Kingdom Seismic Services Market Revenue (Million) Forecast, by Application 2019 & 2032
- Table 12: France Seismic Services Market Revenue (Million) Forecast, by Application 2019 & 2032
- Table 13: Spain Seismic Services Market Revenue (Million) Forecast, by Application 2019 & 2032
- Table 14: Italy Seismic Services Market Revenue (Million) Forecast, by Application 2019 & 2032
- Table 15: Spain Seismic Services Market Revenue (Million) Forecast, by Application 2019 & 2032
- Table 16: Belgium Seismic Services Market Revenue (Million) Forecast, by Application 2019 & 2032
- Table 17: Netherland Seismic Services Market Revenue (Million) Forecast, by Application 2019 & 2032
- Table 18: Nordics Seismic Services Market Revenue (Million) Forecast, by Application 2019 & 2032
- Table 19: Rest of Europe Seismic Services Market Revenue (Million) Forecast, by Application 2019 & 2032
- Table 20: Global Seismic Services Market Revenue Million Forecast, by Country 2019 & 2032
- Table 21: China Seismic Services Market Revenue (Million) Forecast, by Application 2019 & 2032
- Table 22: Japan Seismic Services Market Revenue (Million) Forecast, by Application 2019 & 2032
- Table 23: India Seismic Services Market Revenue (Million) Forecast, by Application 2019 & 2032
- Table 24: South Korea Seismic Services Market Revenue (Million) Forecast, by Application 2019 & 2032
- Table 25: Southeast Asia Seismic Services Market Revenue (Million) Forecast, by Application 2019 & 2032
- Table 26: Australia Seismic Services Market Revenue (Million) Forecast, by Application 2019 & 2032
- Table 27: Indonesia Seismic Services Market Revenue (Million) Forecast, by Application 2019 & 2032
- Table 28: Phillipes Seismic Services Market Revenue (Million) Forecast, by Application 2019 & 2032
- Table 29: Singapore Seismic Services Market Revenue (Million) Forecast, by Application 2019 & 2032
- Table 30: Thailandc Seismic Services Market Revenue (Million) Forecast, by Application 2019 & 2032
- Table 31: Rest of Asia Pacific Seismic Services Market Revenue (Million) Forecast, by Application 2019 & 2032
- Table 32: Global Seismic Services Market Revenue Million Forecast, by Country 2019 & 2032
- Table 33: Brazil Seismic Services Market Revenue (Million) Forecast, by Application 2019 & 2032
- Table 34: Argentina Seismic Services Market Revenue (Million) Forecast, by Application 2019 & 2032
- Table 35: Peru Seismic Services Market Revenue (Million) Forecast, by Application 2019 & 2032
- Table 36: Chile Seismic Services Market Revenue (Million) Forecast, by Application 2019 & 2032
- Table 37: Colombia Seismic Services Market Revenue (Million) Forecast, by Application 2019 & 2032
- Table 38: Ecuador Seismic Services Market Revenue (Million) Forecast, by Application 2019 & 2032
- Table 39: Venezuela Seismic Services Market Revenue (Million) Forecast, by Application 2019 & 2032
- Table 40: Rest of South America Seismic Services Market Revenue (Million) Forecast, by Application 2019 & 2032
- Table 41: Global Seismic Services Market Revenue Million Forecast, by Country 2019 & 2032
- Table 42: United Arab Emirates Seismic Services Market Revenue (Million) Forecast, by Application 2019 & 2032
- Table 43: Saudi Arabia Seismic Services Market Revenue (Million) Forecast, by Application 2019 & 2032
- Table 44: South Africa Seismic Services Market Revenue (Million) Forecast, by Application 2019 & 2032
- Table 45: Rest of Middle East and Africa Seismic Services Market Revenue (Million) Forecast, by Application 2019 & 2032
- Table 46: Global Seismic Services Market Revenue Million Forecast, by Service 2019 & 2032
- Table 47: Global Seismic Services Market Revenue Million Forecast, by Location of Deployment 2019 & 2032
- Table 48: Global Seismic Services Market Revenue Million Forecast, by Country 2019 & 2032
- Table 49: United States of America Seismic Services Market Revenue (Million) Forecast, by Application 2019 & 2032
- Table 50: Canada Seismic Services Market Revenue (Million) Forecast, by Application 2019 & 2032
- Table 51: Rest of North America Seismic Services Market Revenue (Million) Forecast, by Application 2019 & 2032
- Table 52: Global Seismic Services Market Revenue Million Forecast, by Service 2019 & 2032
- Table 53: Global Seismic Services Market Revenue Million Forecast, by Location of Deployment 2019 & 2032
- Table 54: Global Seismic Services Market Revenue Million Forecast, by Country 2019 & 2032
- Table 55: China Seismic Services Market Revenue (Million) Forecast, by Application 2019 & 2032
- Table 56: India Seismic Services Market Revenue (Million) Forecast, by Application 2019 & 2032
- Table 57: Australia Seismic Services Market Revenue (Million) Forecast, by Application 2019 & 2032
- Table 58: Rest of Asia Pacific Seismic Services Market Revenue (Million) Forecast, by Application 2019 & 2032
- Table 59: Global Seismic Services Market Revenue Million Forecast, by Service 2019 & 2032
- Table 60: Global Seismic Services Market Revenue Million Forecast, by Location of Deployment 2019 & 2032
- Table 61: Global Seismic Services Market Revenue Million Forecast, by Country 2019 & 2032
- Table 62: Germany Seismic Services Market Revenue (Million) Forecast, by Application 2019 & 2032
- Table 63: Russia Seismic Services Market Revenue (Million) Forecast, by Application 2019 & 2032
- Table 64: United Kingdom Seismic Services Market Revenue (Million) Forecast, by Application 2019 & 2032
- Table 65: France Seismic Services Market Revenue (Million) Forecast, by Application 2019 & 2032
- Table 66: Rest of Europe Seismic Services Market Revenue (Million) Forecast, by Application 2019 & 2032
- Table 67: Global Seismic Services Market Revenue Million Forecast, by Service 2019 & 2032
- Table 68: Global Seismic Services Market Revenue Million Forecast, by Location of Deployment 2019 & 2032
- Table 69: Global Seismic Services Market Revenue Million Forecast, by Country 2019 & 2032
- Table 70: Brazil Seismic Services Market Revenue (Million) Forecast, by Application 2019 & 2032
- Table 71: Argentina Seismic Services Market Revenue (Million) Forecast, by Application 2019 & 2032
- Table 72: Rest of the South America Seismic Services Market Revenue (Million) Forecast, by Application 2019 & 2032
- Table 73: Global Seismic Services Market Revenue Million Forecast, by Service 2019 & 2032
- Table 74: Global Seismic Services Market Revenue Million Forecast, by Location of Deployment 2019 & 2032
- Table 75: Global Seismic Services Market Revenue Million Forecast, by Country 2019 & 2032
- Table 76: United Arab Emirates Seismic Services Market Revenue (Million) Forecast, by Application 2019 & 2032
- Table 77: Saudi Arabia Seismic Services Market Revenue (Million) Forecast, by Application 2019 & 2032
- Table 78: Iran Seismic Services Market Revenue (Million) Forecast, by Application 2019 & 2032
- Table 79: Iraq Seismic Services Market Revenue (Million) Forecast, by Application 2019 & 2032
- Table 80: Rest of the Middle East and Africa Seismic Services Market Revenue (Million) Forecast, by Application 2019 & 2032
Frequently Asked Questions
1. What is the projected Compound Annual Growth Rate (CAGR) of the Seismic Services Market?
The projected CAGR is approximately 3.10%.
2. Which companies are prominent players in the Seismic Services Market?
Key companies in the market include SAExploration Holdings Inc, China Oilfield Services Limited, ION Geophysical Corporation, Shearwater GeoServices Holding AS, Fugro NV, Schlumberger NV, CGG SA, Briscoe Group Limited, Halliburton Company, SeaBird Exploration PLC, Magseis Fairfield ASA (WGP Group Ltd), TGS ASA, Polarcus Ltd, PGS ASA.
3. What are the main segments of the Seismic Services Market?
The market segments include Service, Location of Deployment.
4. Can you provide details about the market size?
The market size is estimated to be USD 5.61 Million as of 2022.
5. What are some drivers contributing to market growth?
4.; Increasing Exploration in Offshore Areas4.; The Strengthening of Crude Oil Prices. Making the Upstream Activities Economically Feasible.
6. What are the notable trends driving market growth?
Increasing Demand from the Offshore Oil and Gas Industry.
7. Are there any restraints impacting market growth?
4.; Shifting to Renewable Energy Sources.
8. Can you provide examples of recent developments in the market?
In May 2023, TGS, in partnership with PGS and Schlumberger, has secured pre-funding for a 6,885 square kilometer (2,658 square miles) multi-client 3D seismic survey offshore Malaysia in the North Luconia Province of the Sarawak Basin.
9. What pricing options are available for accessing the report?
Pricing options include single-user, multi-user, and enterprise licenses priced at USD 4750, USD 5250, and USD 8750 respectively.
10. Is the market size provided in terms of value or volume?
The market size is provided in terms of value, measured in Million.
11. Are there any specific market keywords associated with the report?
Yes, the market keyword associated with the report is "Seismic Services Market," which aids in identifying and referencing the specific market segment covered.
12. How do I determine which pricing option suits my needs best?
The pricing options vary based on user requirements and access needs. Individual users may opt for single-user licenses, while businesses requiring broader access may choose multi-user or enterprise licenses for cost-effective access to the report.
13. Are there any additional resources or data provided in the Seismic Services Market report?
While the report offers comprehensive insights, it's advisable to review the specific contents or supplementary materials provided to ascertain if additional resources or data are available.
14. How can I stay updated on further developments or reports in the Seismic Services Market?
To stay informed about further developments, trends, and reports in the Seismic Services Market, consider subscribing to industry newsletters, following relevant companies and organizations, or regularly checking reputable industry news sources and publications.
Methodology
Step 1 - Identification of Relevant Samples Size from Population Database


Step 2 - Approaches for Defining Global Market Size (Value, Volume* & Price*)

Note*: In applicable scenarios
Step 3 - Data Sources
Primary Research
- Web Analytics
- Survey Reports
- Research Institute
- Latest Research Reports
- Opinion Leaders
Secondary Research
- Annual Reports
- White Paper
- Latest Press Release
- Industry Association
- Paid Database
- Investor Presentations

Step 4 - Data Triangulation
Involves using different sources of information in order to increase the validity of a study
These sources are likely to be stakeholders in a program - participants, other researchers, program staff, other community members, and so on.
Then we put all data in single framework & apply various statistical tools to find out the dynamic on the market.
During the analysis stage, feedback from the stakeholder groups would be compared to determine areas of agreement as well as areas of divergence
