

Key Insights
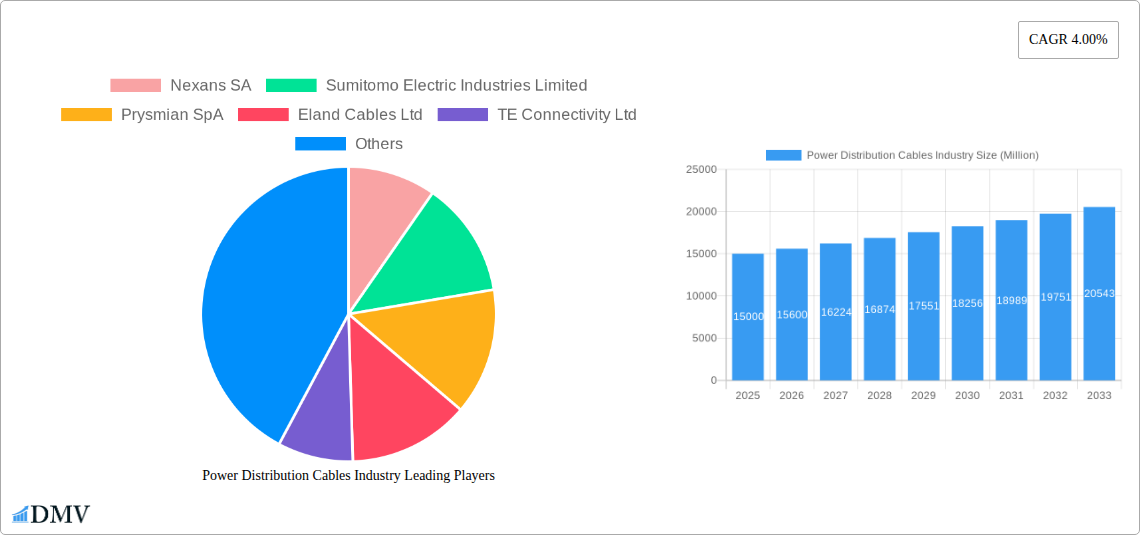
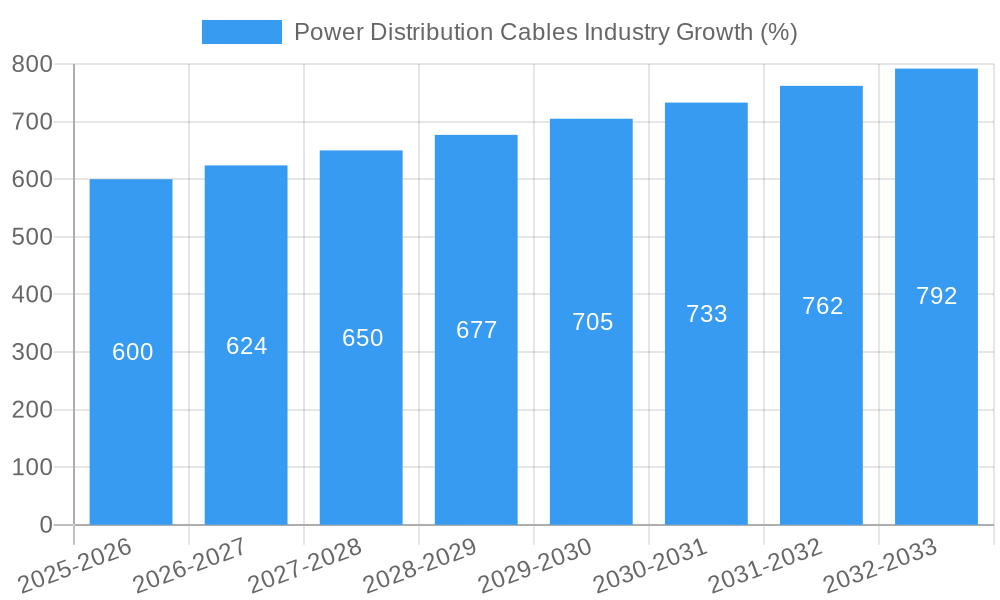
The global power distribution cables market is experiencing steady growth, driven by increasing urbanization, industrialization, and the expansion of electricity grids worldwide. A Compound Annual Growth Rate (CAGR) of 4.00% from 2019 to 2024 suggests a robust market, projected to continue this positive trajectory through 2033. Key drivers include rising energy demand fueled by population growth and economic development, particularly in emerging economies across Asia-Pacific and South America. The shift towards renewable energy sources, including solar and wind power, is also boosting demand for specialized power distribution cables. Furthermore, government initiatives focused on improving infrastructure and grid modernization are creating favorable conditions for market expansion. The market is segmented by voltage level (low, medium, high), location of deployment (overhead, underground, submarine), and geography. High-voltage cables are experiencing significant demand due to the increasing need for long-distance power transmission and integration of large-scale renewable energy projects. Underground and submarine cable deployments are also witnessing growth, driven by safety concerns and the need for reliable offshore energy infrastructure. Major market players such as Nexans SA, Sumitomo Electric Industries Limited, Prysmian SpA, and others are investing in research and development to improve cable technology, focusing on enhanced efficiency, durability, and sustainability.
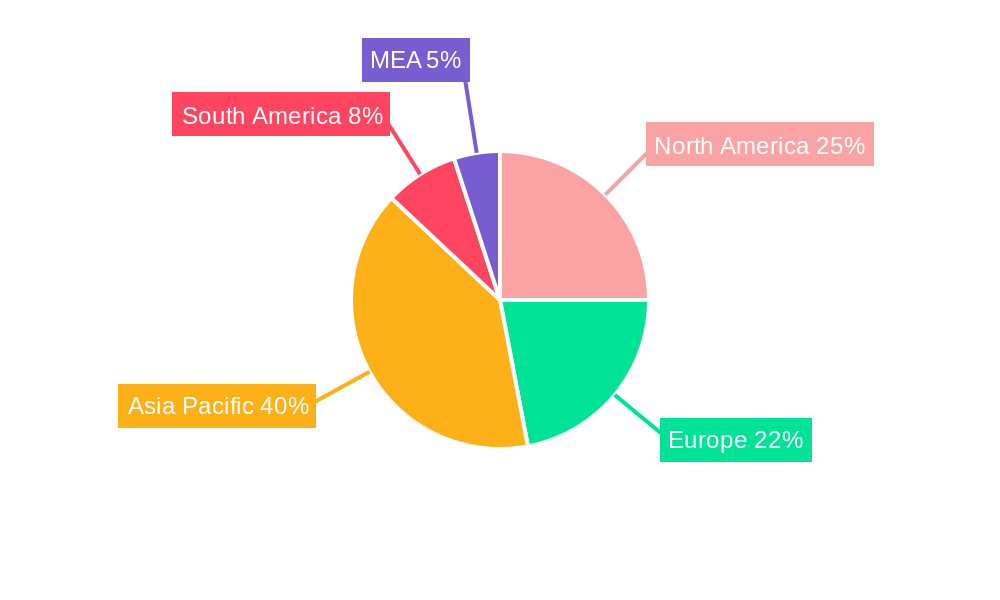
While the market presents significant opportunities, certain restraints exist. Fluctuations in raw material prices, particularly copper and aluminum, can impact production costs and profitability. Stringent environmental regulations regarding cable manufacturing and disposal also present challenges. Competition among established players is intense, requiring companies to constantly innovate and differentiate their product offerings. Despite these challenges, the long-term outlook for the power distribution cables market remains positive, fueled by consistent growth in global energy demand and ongoing infrastructure development. The market is expected to witness considerable expansion in various regions, with Asia-Pacific anticipated to lead the way due to rapid economic growth and increasing investments in power infrastructure. Growth in North America and Europe will also continue, driven by modernization projects and increasing renewable energy adoption.
Power Distribution Cables Industry Market Report: 2019-2033
This comprehensive report provides an in-depth analysis of the global power distribution cables industry, offering invaluable insights for stakeholders seeking to navigate this dynamic market. With a study period spanning 2019-2033, a base year of 2025, and a forecast period of 2025-2033, this report delivers a robust understanding of past performance, current trends, and future projections. The market is valued at xx Million in 2025 and is projected to reach xx Million by 2033, exhibiting a CAGR of xx%.
Power Distribution Cables Industry Market Composition & Trends
The power distribution cables market is characterized by a moderately concentrated landscape, with key players such as Nexans SA, Sumitomo Electric Industries Limited, Prysmian SpA, and ABB Limited holding significant market share. In 2025, these companies collectively account for approximately xx% of the global market. The market exhibits continuous innovation driven by the increasing demand for higher voltage capacity, improved efficiency, and enhanced durability. Stringent regulatory frameworks regarding safety and environmental compliance significantly impact market dynamics. Substitute products, such as wireless power transmission technologies, pose a potential threat, albeit currently limited in widespread adoption. End-user industries, including utilities, renewable energy sectors, and the construction industry, are driving demand. M&A activities have played a role in market consolidation, with recent deals valued at approximately xx Million, primarily focused on expanding geographical reach and technological capabilities.
- Market Share Distribution (2025): Nexans SA (xx%), Sumitomo Electric Industries (xx%), Prysmian SpA (xx%), ABB Limited (xx%), Others (xx%)
- Top 3 M&A Deals (2019-2024): Deal 1: xx Million; Deal 2: xx Million; Deal 3: xx Million
Power Distribution Cables Industry Industry Evolution
The power distribution cables industry has witnessed consistent growth fueled by rising energy demand globally and extensive infrastructure development projects. From 2019 to 2024, the market experienced a CAGR of xx%, driven by increasing urbanization, industrialization, and the growing adoption of renewable energy sources. Technological advancements, such as the development of high-voltage direct current (HVDC) cables and the incorporation of smart grid technologies, have significantly enhanced efficiency and reliability. Consumer demand is shifting towards more sustainable and environmentally friendly cable solutions, leading to increased investments in recyclable and biodegradable materials. This trend, along with government initiatives promoting energy efficiency and grid modernization, further contributes to market expansion. The forecast period (2025-2033) anticipates continued growth, with a projected CAGR of xx%, driven by ongoing infrastructure investments and the expansion of renewable energy capacities. This growth will be influenced by advancements in materials science, allowing for cables with improved performance and longevity.
Leading Regions, Countries, or Segments in Power Distribution Cables Industry
The Asia-Pacific region currently dominates the power distribution cables market, driven by rapid economic growth and significant infrastructure development in countries like China and India. High-voltage cable segments are witnessing strong growth due to increasing demand from large-scale power transmission projects. Underground cable deployment remains the dominant segment, reflecting the preference for reliable and safe power delivery in urban areas and densely populated regions.
- Key Drivers for Asia-Pacific Dominance:
- Massive investments in power grid modernization and expansion.
- Growing demand for electricity from burgeoning industrial and residential sectors.
- Favorable government policies supporting renewable energy integration.
- High-Voltage Segment Growth:
- Increased adoption in long-distance power transmission projects.
- Growing demand for renewable energy integration via large-scale projects.
- Underground Cable Deployment:
- Protection from environmental factors and improved safety.
- Reduced visual impact compared to overhead lines.
Power Distribution Cables Industry Product Innovations
Recent innovations in power distribution cables focus on enhancing efficiency, durability, and sustainability. Advancements in material science have led to the development of cables with improved thermal conductivity, reducing energy loss during transmission. The integration of sensors and smart grid technologies enables real-time monitoring of cable health, improving predictive maintenance and reducing downtime. Furthermore, the industry is witnessing a growing adoption of eco-friendly materials and manufacturing processes, minimizing the environmental footprint of cable production and disposal. These innovations, combined with ongoing efforts to increase cable capacity and lifespan, are shaping the future of power distribution.
Propelling Factors for Power Distribution Cables Industry Growth
The power distribution cables industry is propelled by several key factors. Firstly, the global rise in energy demand, fueled by population growth and industrialization, necessitates expanded power transmission infrastructure. Secondly, the growing adoption of renewable energy sources, such as solar and wind power, requires robust and efficient power distribution networks. Finally, government initiatives promoting grid modernization and energy efficiency further stimulate market growth by creating a conducive regulatory environment. Investments in smart grid technologies are also boosting market expansion.
Obstacles in the Power Distribution Cables Industry Market
The power distribution cables market faces several challenges. Fluctuations in raw material prices, particularly copper and aluminum, impact production costs and profitability. Supply chain disruptions, exacerbated by geopolitical events and pandemics, can lead to delays and production shortfalls. Intense competition among established players and the emergence of new entrants also present significant challenges. Furthermore, stringent regulatory compliance requirements, coupled with environmental concerns, create additional hurdles for market participants.
Future Opportunities in Power Distribution Cables Industry
Future opportunities lie in the growing adoption of HVDC technology for long-distance power transmission, the expansion into emerging markets with limited power infrastructure, and the development of advanced cable monitoring systems using IoT technologies. The increasing demand for sustainable and environmentally friendly cables presents a significant opportunity for companies focused on innovation in material science and manufacturing processes. Furthermore, the integration of smart grid technologies and digitalization will open up new avenues for market expansion and value creation.
Major Players in the Power Distribution Cables Industry Ecosystem
- Nexans SA
- Sumitomo Electric Industries Limited
- Prysmian SpA
- Eland Cables Ltd
- TE Connectivity Ltd
- NKT A/S
- Brugg Kabel AG
- ABB Limited
Key Developments in Power Distribution Cables Industry Industry
- December 2022: NKT awarded a turnkey cable system contract for the NOAKA area in the North Sea, involving over 255 kilometers of 145kV high-voltage AC power cables. This significant project highlights the growing demand for high-voltage cables in offshore wind energy projects.
- February 2022: Sumitomo Electric Industries secured a USD 200 Million contract to supply an HVDC cable to ADNOC in the UAE. This deal underscores the increasing importance of HVDC technology in long-distance power transmission projects and the expansion of the market in the Middle East.
Strategic Power Distribution Cables Industry Market Forecast
The power distribution cables market is poised for sustained growth driven by ongoing infrastructure development, the global shift towards renewable energy, and technological advancements in cable design and manufacturing. The increasing adoption of smart grid technologies and the growing demand for high-voltage cables, particularly in offshore wind energy projects, will significantly contribute to market expansion. The market is expected to witness significant growth in emerging economies, alongside the continuous innovation in sustainable and efficient cable solutions.
Power Distribution Cables Industry Segmentation
-
1. Voltage Level
- 1.1. Low
- 1.2. Medium
- 1.3. High
-
2. Location of Deployment
- 2.1. Overhead
- 2.2. Underground
- 2.3. Submarine
Power Distribution Cables Industry Segmentation By Geography
- 1. North America
- 2. Europe
- 3. Asia Pacific
- 4. South America
- 5. Middle East and Africa
Power Distribution Cables Industry REPORT HIGHLIGHTS
| Aspects | Details |
|---|---|
| Study Period | 2019-2033 |
| Base Year | 2024 |
| Estimated Year | 2025 |
| Forecast Period | 2025-2033 |
| Historical Period | 2019-2024 |
| Growth Rate | CAGR of 4.00% from 2019-2033 |
| Segmentation |
|
Table of Contents
- 1. Introduction
- 1.1. Research Scope
- 1.2. Market Segmentation
- 1.3. Research Methodology
- 1.4. Definitions and Assumptions
- 2. Executive Summary
- 2.1. Introduction
- 3. Market Dynamics
- 3.1. Introduction
- 3.2. Market Drivers
- 3.2.1 Urbanization is a major driver for the power distribution cables market. As cities expand
- 3.2.2 there is a need for reliable and upgraded electrical infrastructure to meet the growing energy demand. Developing countries
- 3.2.3 in particular
- 3.2.4 are investing heavily in modernizing their power distribution systems to accommodate population growth and economic expansion.
- 3.3. Market Restrains
- 3.3.1 The initial capital investment required to manufacture and install power distribution cables can be significant. This includes costs related to raw materials
- 3.3.2 manufacturing processes
- 3.3.3 and installation infrastructure.
- 3.4. Market Trends
- 3.4.1 The smart grid is a major trend in the power distribution sector. Smart grids use advanced communication and control technologies to improve the reliability and efficiency of power distribution. They enable real-time monitoring
- 3.4.2 fault detection
- 3.4.3 and optimization of energy use
- 3.4.4 reducing losses and enhancing grid stability.
- 4. Market Factor Analysis
- 4.1. Porters Five Forces
- 4.2. Supply/Value Chain
- 4.3. PESTEL analysis
- 4.4. Market Entropy
- 4.5. Patent/Trademark Analysis
- 5. Global Power Distribution Cables Industry Analysis, Insights and Forecast, 2019-2031
- 5.1. Market Analysis, Insights and Forecast - by Voltage Level
- 5.1.1. Low
- 5.1.2. Medium
- 5.1.3. High
- 5.2. Market Analysis, Insights and Forecast - by Location of Deployment
- 5.2.1. Overhead
- 5.2.2. Underground
- 5.2.3. Submarine
- 5.3. Market Analysis, Insights and Forecast - by Region
- 5.3.1. North America
- 5.3.2. Europe
- 5.3.3. Asia Pacific
- 5.3.4. South America
- 5.3.5. Middle East and Africa
- 5.1. Market Analysis, Insights and Forecast - by Voltage Level
- 6. North America Power Distribution Cables Industry Analysis, Insights and Forecast, 2019-2031
- 6.1. Market Analysis, Insights and Forecast - by Voltage Level
- 6.1.1. Low
- 6.1.2. Medium
- 6.1.3. High
- 6.2. Market Analysis, Insights and Forecast - by Location of Deployment
- 6.2.1. Overhead
- 6.2.2. Underground
- 6.2.3. Submarine
- 6.1. Market Analysis, Insights and Forecast - by Voltage Level
- 7. Europe Power Distribution Cables Industry Analysis, Insights and Forecast, 2019-2031
- 7.1. Market Analysis, Insights and Forecast - by Voltage Level
- 7.1.1. Low
- 7.1.2. Medium
- 7.1.3. High
- 7.2. Market Analysis, Insights and Forecast - by Location of Deployment
- 7.2.1. Overhead
- 7.2.2. Underground
- 7.2.3. Submarine
- 7.1. Market Analysis, Insights and Forecast - by Voltage Level
- 8. Asia Pacific Power Distribution Cables Industry Analysis, Insights and Forecast, 2019-2031
- 8.1. Market Analysis, Insights and Forecast - by Voltage Level
- 8.1.1. Low
- 8.1.2. Medium
- 8.1.3. High
- 8.2. Market Analysis, Insights and Forecast - by Location of Deployment
- 8.2.1. Overhead
- 8.2.2. Underground
- 8.2.3. Submarine
- 8.1. Market Analysis, Insights and Forecast - by Voltage Level
- 9. South America Power Distribution Cables Industry Analysis, Insights and Forecast, 2019-2031
- 9.1. Market Analysis, Insights and Forecast - by Voltage Level
- 9.1.1. Low
- 9.1.2. Medium
- 9.1.3. High
- 9.2. Market Analysis, Insights and Forecast - by Location of Deployment
- 9.2.1. Overhead
- 9.2.2. Underground
- 9.2.3. Submarine
- 9.1. Market Analysis, Insights and Forecast - by Voltage Level
- 10. Middle East and Africa Power Distribution Cables Industry Analysis, Insights and Forecast, 2019-2031
- 10.1. Market Analysis, Insights and Forecast - by Voltage Level
- 10.1.1. Low
- 10.1.2. Medium
- 10.1.3. High
- 10.2. Market Analysis, Insights and Forecast - by Location of Deployment
- 10.2.1. Overhead
- 10.2.2. Underground
- 10.2.3. Submarine
- 10.1. Market Analysis, Insights and Forecast - by Voltage Level
- 11. North America Power Distribution Cables Industry Analysis, Insights and Forecast, 2019-2031
- 11.1. Market Analysis, Insights and Forecast - By Country/Sub-region
- 11.1.1 United States
- 11.1.2 Canada
- 11.1.3 Mexico
- 12. Europe Power Distribution Cables Industry Analysis, Insights and Forecast, 2019-2031
- 12.1. Market Analysis, Insights and Forecast - By Country/Sub-region
- 12.1.1 Germany
- 12.1.2 United Kingdom
- 12.1.3 France
- 12.1.4 Spain
- 12.1.5 Italy
- 12.1.6 Spain
- 12.1.7 Belgium
- 12.1.8 Netherland
- 12.1.9 Nordics
- 12.1.10 Rest of Europe
- 13. Asia Pacific Power Distribution Cables Industry Analysis, Insights and Forecast, 2019-2031
- 13.1. Market Analysis, Insights and Forecast - By Country/Sub-region
- 13.1.1 China
- 13.1.2 Japan
- 13.1.3 India
- 13.1.4 South Korea
- 13.1.5 Southeast Asia
- 13.1.6 Australia
- 13.1.7 Indonesia
- 13.1.8 Phillipes
- 13.1.9 Singapore
- 13.1.10 Thailandc
- 13.1.11 Rest of Asia Pacific
- 14. South America Power Distribution Cables Industry Analysis, Insights and Forecast, 2019-2031
- 14.1. Market Analysis, Insights and Forecast - By Country/Sub-region
- 14.1.1 Brazil
- 14.1.2 Argentina
- 14.1.3 Peru
- 14.1.4 Chile
- 14.1.5 Colombia
- 14.1.6 Ecuador
- 14.1.7 Venezuela
- 14.1.8 Rest of South America
- 15. North America Power Distribution Cables Industry Analysis, Insights and Forecast, 2019-2031
- 15.1. Market Analysis, Insights and Forecast - By Country/Sub-region
- 15.1.1 United States
- 15.1.2 Canada
- 15.1.3 Mexico
- 16. MEA Power Distribution Cables Industry Analysis, Insights and Forecast, 2019-2031
- 16.1. Market Analysis, Insights and Forecast - By Country/Sub-region
- 16.1.1 United Arab Emirates
- 16.1.2 Saudi Arabia
- 16.1.3 South Africa
- 16.1.4 Rest of Middle East and Africa
- 17. Competitive Analysis
- 17.1. Global Market Share Analysis 2024
- 17.2. Company Profiles
- 17.2.1 Nexans SA
- 17.2.1.1. Overview
- 17.2.1.2. Products
- 17.2.1.3. SWOT Analysis
- 17.2.1.4. Recent Developments
- 17.2.1.5. Financials (Based on Availability)
- 17.2.2 Sumitomo Electric Industries Limited
- 17.2.2.1. Overview
- 17.2.2.2. Products
- 17.2.2.3. SWOT Analysis
- 17.2.2.4. Recent Developments
- 17.2.2.5. Financials (Based on Availability)
- 17.2.3 Prysmian SpA
- 17.2.3.1. Overview
- 17.2.3.2. Products
- 17.2.3.3. SWOT Analysis
- 17.2.3.4. Recent Developments
- 17.2.3.5. Financials (Based on Availability)
- 17.2.4 Eland Cables Ltd
- 17.2.4.1. Overview
- 17.2.4.2. Products
- 17.2.4.3. SWOT Analysis
- 17.2.4.4. Recent Developments
- 17.2.4.5. Financials (Based on Availability)
- 17.2.5 TE Connectivity Ltd
- 17.2.5.1. Overview
- 17.2.5.2. Products
- 17.2.5.3. SWOT Analysis
- 17.2.5.4. Recent Developments
- 17.2.5.5. Financials (Based on Availability)
- 17.2.6 NKT A/S
- 17.2.6.1. Overview
- 17.2.6.2. Products
- 17.2.6.3. SWOT Analysis
- 17.2.6.4. Recent Developments
- 17.2.6.5. Financials (Based on Availability)
- 17.2.7 Brugg Kabel AG
- 17.2.7.1. Overview
- 17.2.7.2. Products
- 17.2.7.3. SWOT Analysis
- 17.2.7.4. Recent Developments
- 17.2.7.5. Financials (Based on Availability)
- 17.2.8 ABB Limited
- 17.2.8.1. Overview
- 17.2.8.2. Products
- 17.2.8.3. SWOT Analysis
- 17.2.8.4. Recent Developments
- 17.2.8.5. Financials (Based on Availability)
- 17.2.1 Nexans SA
List of Figures
- Figure 1: Global Power Distribution Cables Industry Revenue Breakdown (Million, %) by Region 2024 & 2032
- Figure 2: North America Power Distribution Cables Industry Revenue (Million), by Country 2024 & 2032
- Figure 3: North America Power Distribution Cables Industry Revenue Share (%), by Country 2024 & 2032
- Figure 4: Europe Power Distribution Cables Industry Revenue (Million), by Country 2024 & 2032
- Figure 5: Europe Power Distribution Cables Industry Revenue Share (%), by Country 2024 & 2032
- Figure 6: Asia Pacific Power Distribution Cables Industry Revenue (Million), by Country 2024 & 2032
- Figure 7: Asia Pacific Power Distribution Cables Industry Revenue Share (%), by Country 2024 & 2032
- Figure 8: South America Power Distribution Cables Industry Revenue (Million), by Country 2024 & 2032
- Figure 9: South America Power Distribution Cables Industry Revenue Share (%), by Country 2024 & 2032
- Figure 10: North America Power Distribution Cables Industry Revenue (Million), by Country 2024 & 2032
- Figure 11: North America Power Distribution Cables Industry Revenue Share (%), by Country 2024 & 2032
- Figure 12: MEA Power Distribution Cables Industry Revenue (Million), by Country 2024 & 2032
- Figure 13: MEA Power Distribution Cables Industry Revenue Share (%), by Country 2024 & 2032
- Figure 14: North America Power Distribution Cables Industry Revenue (Million), by Voltage Level 2024 & 2032
- Figure 15: North America Power Distribution Cables Industry Revenue Share (%), by Voltage Level 2024 & 2032
- Figure 16: North America Power Distribution Cables Industry Revenue (Million), by Location of Deployment 2024 & 2032
- Figure 17: North America Power Distribution Cables Industry Revenue Share (%), by Location of Deployment 2024 & 2032
- Figure 18: North America Power Distribution Cables Industry Revenue (Million), by Country 2024 & 2032
- Figure 19: North America Power Distribution Cables Industry Revenue Share (%), by Country 2024 & 2032
- Figure 20: Europe Power Distribution Cables Industry Revenue (Million), by Voltage Level 2024 & 2032
- Figure 21: Europe Power Distribution Cables Industry Revenue Share (%), by Voltage Level 2024 & 2032
- Figure 22: Europe Power Distribution Cables Industry Revenue (Million), by Location of Deployment 2024 & 2032
- Figure 23: Europe Power Distribution Cables Industry Revenue Share (%), by Location of Deployment 2024 & 2032
- Figure 24: Europe Power Distribution Cables Industry Revenue (Million), by Country 2024 & 2032
- Figure 25: Europe Power Distribution Cables Industry Revenue Share (%), by Country 2024 & 2032
- Figure 26: Asia Pacific Power Distribution Cables Industry Revenue (Million), by Voltage Level 2024 & 2032
- Figure 27: Asia Pacific Power Distribution Cables Industry Revenue Share (%), by Voltage Level 2024 & 2032
- Figure 28: Asia Pacific Power Distribution Cables Industry Revenue (Million), by Location of Deployment 2024 & 2032
- Figure 29: Asia Pacific Power Distribution Cables Industry Revenue Share (%), by Location of Deployment 2024 & 2032
- Figure 30: Asia Pacific Power Distribution Cables Industry Revenue (Million), by Country 2024 & 2032
- Figure 31: Asia Pacific Power Distribution Cables Industry Revenue Share (%), by Country 2024 & 2032
- Figure 32: South America Power Distribution Cables Industry Revenue (Million), by Voltage Level 2024 & 2032
- Figure 33: South America Power Distribution Cables Industry Revenue Share (%), by Voltage Level 2024 & 2032
- Figure 34: South America Power Distribution Cables Industry Revenue (Million), by Location of Deployment 2024 & 2032
- Figure 35: South America Power Distribution Cables Industry Revenue Share (%), by Location of Deployment 2024 & 2032
- Figure 36: South America Power Distribution Cables Industry Revenue (Million), by Country 2024 & 2032
- Figure 37: South America Power Distribution Cables Industry Revenue Share (%), by Country 2024 & 2032
- Figure 38: Middle East and Africa Power Distribution Cables Industry Revenue (Million), by Voltage Level 2024 & 2032
- Figure 39: Middle East and Africa Power Distribution Cables Industry Revenue Share (%), by Voltage Level 2024 & 2032
- Figure 40: Middle East and Africa Power Distribution Cables Industry Revenue (Million), by Location of Deployment 2024 & 2032
- Figure 41: Middle East and Africa Power Distribution Cables Industry Revenue Share (%), by Location of Deployment 2024 & 2032
- Figure 42: Middle East and Africa Power Distribution Cables Industry Revenue (Million), by Country 2024 & 2032
- Figure 43: Middle East and Africa Power Distribution Cables Industry Revenue Share (%), by Country 2024 & 2032
List of Tables
- Table 1: Global Power Distribution Cables Industry Revenue Million Forecast, by Region 2019 & 2032
- Table 2: Global Power Distribution Cables Industry Revenue Million Forecast, by Voltage Level 2019 & 2032
- Table 3: Global Power Distribution Cables Industry Revenue Million Forecast, by Location of Deployment 2019 & 2032
- Table 4: Global Power Distribution Cables Industry Revenue Million Forecast, by Region 2019 & 2032
- Table 5: Global Power Distribution Cables Industry Revenue Million Forecast, by Country 2019 & 2032
- Table 6: United States Power Distribution Cables Industry Revenue (Million) Forecast, by Application 2019 & 2032
- Table 7: Canada Power Distribution Cables Industry Revenue (Million) Forecast, by Application 2019 & 2032
- Table 8: Mexico Power Distribution Cables Industry Revenue (Million) Forecast, by Application 2019 & 2032
- Table 9: Global Power Distribution Cables Industry Revenue Million Forecast, by Country 2019 & 2032
- Table 10: Germany Power Distribution Cables Industry Revenue (Million) Forecast, by Application 2019 & 2032
- Table 11: United Kingdom Power Distribution Cables Industry Revenue (Million) Forecast, by Application 2019 & 2032
- Table 12: France Power Distribution Cables Industry Revenue (Million) Forecast, by Application 2019 & 2032
- Table 13: Spain Power Distribution Cables Industry Revenue (Million) Forecast, by Application 2019 & 2032
- Table 14: Italy Power Distribution Cables Industry Revenue (Million) Forecast, by Application 2019 & 2032
- Table 15: Spain Power Distribution Cables Industry Revenue (Million) Forecast, by Application 2019 & 2032
- Table 16: Belgium Power Distribution Cables Industry Revenue (Million) Forecast, by Application 2019 & 2032
- Table 17: Netherland Power Distribution Cables Industry Revenue (Million) Forecast, by Application 2019 & 2032
- Table 18: Nordics Power Distribution Cables Industry Revenue (Million) Forecast, by Application 2019 & 2032
- Table 19: Rest of Europe Power Distribution Cables Industry Revenue (Million) Forecast, by Application 2019 & 2032
- Table 20: Global Power Distribution Cables Industry Revenue Million Forecast, by Country 2019 & 2032
- Table 21: China Power Distribution Cables Industry Revenue (Million) Forecast, by Application 2019 & 2032
- Table 22: Japan Power Distribution Cables Industry Revenue (Million) Forecast, by Application 2019 & 2032
- Table 23: India Power Distribution Cables Industry Revenue (Million) Forecast, by Application 2019 & 2032
- Table 24: South Korea Power Distribution Cables Industry Revenue (Million) Forecast, by Application 2019 & 2032
- Table 25: Southeast Asia Power Distribution Cables Industry Revenue (Million) Forecast, by Application 2019 & 2032
- Table 26: Australia Power Distribution Cables Industry Revenue (Million) Forecast, by Application 2019 & 2032
- Table 27: Indonesia Power Distribution Cables Industry Revenue (Million) Forecast, by Application 2019 & 2032
- Table 28: Phillipes Power Distribution Cables Industry Revenue (Million) Forecast, by Application 2019 & 2032
- Table 29: Singapore Power Distribution Cables Industry Revenue (Million) Forecast, by Application 2019 & 2032
- Table 30: Thailandc Power Distribution Cables Industry Revenue (Million) Forecast, by Application 2019 & 2032
- Table 31: Rest of Asia Pacific Power Distribution Cables Industry Revenue (Million) Forecast, by Application 2019 & 2032
- Table 32: Global Power Distribution Cables Industry Revenue Million Forecast, by Country 2019 & 2032
- Table 33: Brazil Power Distribution Cables Industry Revenue (Million) Forecast, by Application 2019 & 2032
- Table 34: Argentina Power Distribution Cables Industry Revenue (Million) Forecast, by Application 2019 & 2032
- Table 35: Peru Power Distribution Cables Industry Revenue (Million) Forecast, by Application 2019 & 2032
- Table 36: Chile Power Distribution Cables Industry Revenue (Million) Forecast, by Application 2019 & 2032
- Table 37: Colombia Power Distribution Cables Industry Revenue (Million) Forecast, by Application 2019 & 2032
- Table 38: Ecuador Power Distribution Cables Industry Revenue (Million) Forecast, by Application 2019 & 2032
- Table 39: Venezuela Power Distribution Cables Industry Revenue (Million) Forecast, by Application 2019 & 2032
- Table 40: Rest of South America Power Distribution Cables Industry Revenue (Million) Forecast, by Application 2019 & 2032
- Table 41: Global Power Distribution Cables Industry Revenue Million Forecast, by Country 2019 & 2032
- Table 42: United States Power Distribution Cables Industry Revenue (Million) Forecast, by Application 2019 & 2032
- Table 43: Canada Power Distribution Cables Industry Revenue (Million) Forecast, by Application 2019 & 2032
- Table 44: Mexico Power Distribution Cables Industry Revenue (Million) Forecast, by Application 2019 & 2032
- Table 45: Global Power Distribution Cables Industry Revenue Million Forecast, by Country 2019 & 2032
- Table 46: United Arab Emirates Power Distribution Cables Industry Revenue (Million) Forecast, by Application 2019 & 2032
- Table 47: Saudi Arabia Power Distribution Cables Industry Revenue (Million) Forecast, by Application 2019 & 2032
- Table 48: South Africa Power Distribution Cables Industry Revenue (Million) Forecast, by Application 2019 & 2032
- Table 49: Rest of Middle East and Africa Power Distribution Cables Industry Revenue (Million) Forecast, by Application 2019 & 2032
- Table 50: Global Power Distribution Cables Industry Revenue Million Forecast, by Voltage Level 2019 & 2032
- Table 51: Global Power Distribution Cables Industry Revenue Million Forecast, by Location of Deployment 2019 & 2032
- Table 52: Global Power Distribution Cables Industry Revenue Million Forecast, by Country 2019 & 2032
- Table 53: Global Power Distribution Cables Industry Revenue Million Forecast, by Voltage Level 2019 & 2032
- Table 54: Global Power Distribution Cables Industry Revenue Million Forecast, by Location of Deployment 2019 & 2032
- Table 55: Global Power Distribution Cables Industry Revenue Million Forecast, by Country 2019 & 2032
- Table 56: Global Power Distribution Cables Industry Revenue Million Forecast, by Voltage Level 2019 & 2032
- Table 57: Global Power Distribution Cables Industry Revenue Million Forecast, by Location of Deployment 2019 & 2032
- Table 58: Global Power Distribution Cables Industry Revenue Million Forecast, by Country 2019 & 2032
- Table 59: Global Power Distribution Cables Industry Revenue Million Forecast, by Voltage Level 2019 & 2032
- Table 60: Global Power Distribution Cables Industry Revenue Million Forecast, by Location of Deployment 2019 & 2032
- Table 61: Global Power Distribution Cables Industry Revenue Million Forecast, by Country 2019 & 2032
- Table 62: Global Power Distribution Cables Industry Revenue Million Forecast, by Voltage Level 2019 & 2032
- Table 63: Global Power Distribution Cables Industry Revenue Million Forecast, by Location of Deployment 2019 & 2032
- Table 64: Global Power Distribution Cables Industry Revenue Million Forecast, by Country 2019 & 2032
Frequently Asked Questions
1. What is the projected Compound Annual Growth Rate (CAGR) of the Power Distribution Cables Industry?
The projected CAGR is approximately 4.00%.
2. Which companies are prominent players in the Power Distribution Cables Industry?
Key companies in the market include Nexans SA, Sumitomo Electric Industries Limited, Prysmian SpA, Eland Cables Ltd, TE Connectivity Ltd, NKT A/S, Brugg Kabel AG, ABB Limited.
3. What are the main segments of the Power Distribution Cables Industry?
The market segments include Voltage Level, Location of Deployment.
4. Can you provide details about the market size?
The market size is estimated to be USD XX Million as of 2022.
5. What are some drivers contributing to market growth?
Urbanization is a major driver for the power distribution cables market. As cities expand. there is a need for reliable and upgraded electrical infrastructure to meet the growing energy demand. Developing countries. in particular. are investing heavily in modernizing their power distribution systems to accommodate population growth and economic expansion..
6. What are the notable trends driving market growth?
The smart grid is a major trend in the power distribution sector. Smart grids use advanced communication and control technologies to improve the reliability and efficiency of power distribution. They enable real-time monitoring. fault detection. and optimization of energy use. reducing losses and enhancing grid stability..
7. Are there any restraints impacting market growth?
The initial capital investment required to manufacture and install power distribution cables can be significant. This includes costs related to raw materials. manufacturing processes. and installation infrastructure..
8. Can you provide examples of recent developments in the market?
December 2022: NKT was awarded a turnkey cable system contract for the electrification of the North of Alvheim (NOA) and Krafla offshore fields in the North Sea's NOAKA area. More than 255 kilometers of 145kV high-voltage AC power cables will be designed, manufactured, and installed by the cable-laying vessel NKT Victoria.
9. What pricing options are available for accessing the report?
Pricing options include single-user, multi-user, and enterprise licenses priced at USD 4750, USD 5250, and USD 8750 respectively.
10. Is the market size provided in terms of value or volume?
The market size is provided in terms of value, measured in Million.
11. Are there any specific market keywords associated with the report?
Yes, the market keyword associated with the report is "Power Distribution Cables Industry," which aids in identifying and referencing the specific market segment covered.
12. How do I determine which pricing option suits my needs best?
The pricing options vary based on user requirements and access needs. Individual users may opt for single-user licenses, while businesses requiring broader access may choose multi-user or enterprise licenses for cost-effective access to the report.
13. Are there any additional resources or data provided in the Power Distribution Cables Industry report?
While the report offers comprehensive insights, it's advisable to review the specific contents or supplementary materials provided to ascertain if additional resources or data are available.
14. How can I stay updated on further developments or reports in the Power Distribution Cables Industry?
To stay informed about further developments, trends, and reports in the Power Distribution Cables Industry, consider subscribing to industry newsletters, following relevant companies and organizations, or regularly checking reputable industry news sources and publications.
Methodology
Step 1 - Identification of Relevant Samples Size from Population Database


Step 2 - Approaches for Defining Global Market Size (Value, Volume* & Price*)

Note*: In applicable scenarios
Step 3 - Data Sources
Primary Research
- Web Analytics
- Survey Reports
- Research Institute
- Latest Research Reports
- Opinion Leaders
Secondary Research
- Annual Reports
- White Paper
- Latest Press Release
- Industry Association
- Paid Database
- Investor Presentations

Step 4 - Data Triangulation
Involves using different sources of information in order to increase the validity of a study
These sources are likely to be stakeholders in a program - participants, other researchers, program staff, other community members, and so on.
Then we put all data in single framework & apply various statistical tools to find out the dynamic on the market.
During the analysis stage, feedback from the stakeholder groups would be compared to determine areas of agreement as well as areas of divergence
