

Key Insights
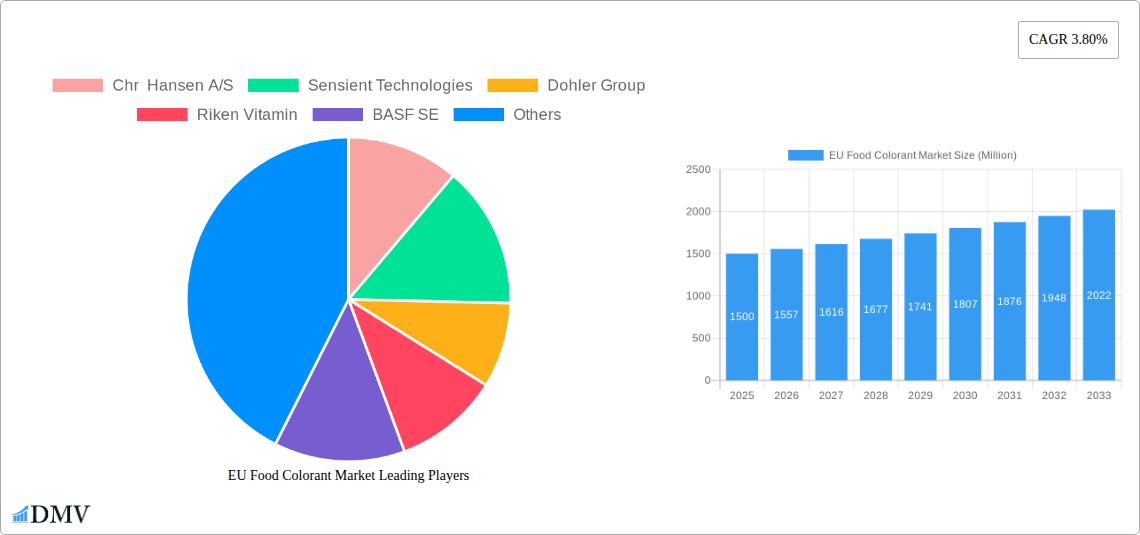
The EU food colorant market, exhibiting a Compound Annual Growth Rate (CAGR) of 3.80%, presents a dynamic landscape shaped by several key factors. The market's expansion is fueled by increasing consumer demand for visually appealing food products, particularly within the confectionery and beverage sectors. This trend is further amplified by the growing popularity of processed foods and the expanding global food industry. Natural colorants are gaining significant traction, driven by rising health consciousness and a preference for products perceived as cleaner and healthier. This shift toward natural ingredients is impacting the market share of synthetic colorants, although synthetic colorants still retain significant market dominance due to their cost-effectiveness and consistent color delivery. Regulatory changes and evolving consumer preferences for specific colorants are also influencing market dynamics. For instance, stringent regulations regarding the use of certain artificial colors are driving innovation in natural colorant development and application. Furthermore, regional variations in consumer preferences and regulatory landscapes across different European countries contribute to the market's complexity. The overall market is competitive, with major players focusing on innovation, product diversification, and strategic partnerships to strengthen their market positions. Given the projected CAGR, the EU food colorant market is poised for substantial growth in the coming years.
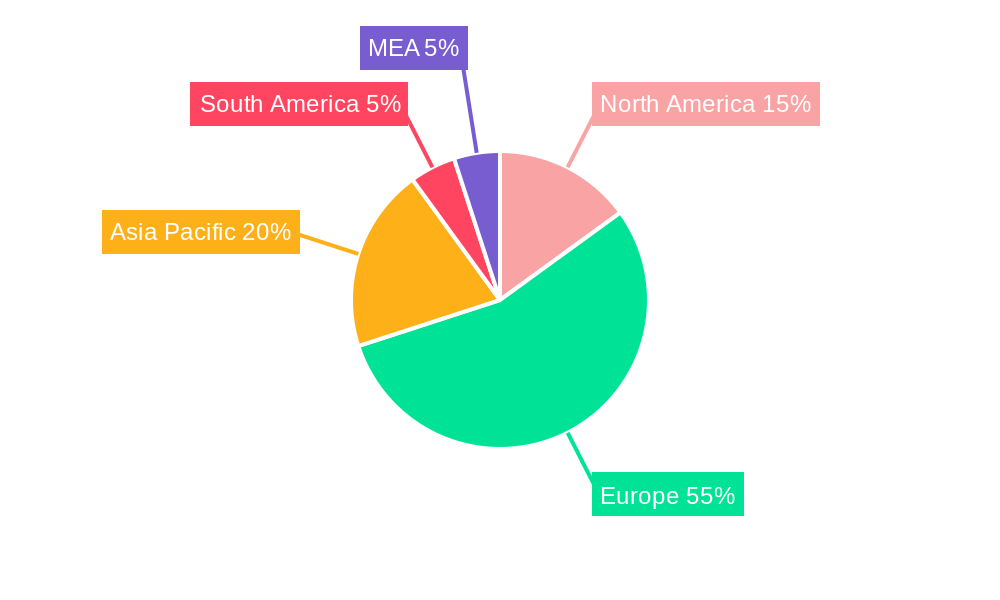
The geographical distribution of the EU food colorant market reflects varying levels of economic development and consumer behavior within the region. Germany, the United Kingdom, and France are expected to be leading markets due to their significant food processing industries and high consumption of processed food products. However, other countries in the region are also experiencing growth, driven by rising disposable incomes and changing dietary habits. The market is segmented by product type (natural vs. synthetic) and application (beverage, dairy, bakery, etc.), allowing for a detailed understanding of consumer preferences and market opportunities within specific product categories. The competitive landscape includes both established multinational corporations and smaller regional players, resulting in ongoing innovation and a dynamic competitive environment. Future growth will be influenced by technological advancements, such as the development of more stable and cost-effective natural colorants, and evolving consumer trends toward healthier, more sustainable food products.
EU Food Colorant Market: A Comprehensive Report (2019-2033)
This insightful report provides a detailed analysis of the European Union (EU) food colorant market, offering a comprehensive overview of its current state, future trajectory, and key players. The study period spans from 2019 to 2033, with 2025 serving as the base and estimated year. This report is essential for stakeholders seeking to understand market dynamics, identify growth opportunities, and make informed strategic decisions within this dynamic sector. The market is estimated to be worth xx Million in 2025 and is projected to reach xx Million by 2033.
EU Food Colorant Market Composition & Trends
This section delves into the competitive landscape of the EU food colorant market, analyzing market concentration, innovation drivers, regulatory influences, substitute products, end-user profiles, and mergers & acquisitions (M&A) activities. The market is characterized by a moderately concentrated structure, with key players holding significant market share. Chr. Hansen A/S, Sensient Technologies, Dohler Group, Riken Vitamin, BASF SE, Koninklijke DSM N.V., D&D Williamson & Co, and Givaudan (Naturex) are among the prominent companies shaping the market. However, the presence of numerous smaller players also contributes to market dynamism.
- Market Share Distribution: Chr. Hansen A/S holds approximately xx% market share in 2025, followed by Sensient Technologies with xx%, and BASF SE with xx%. The remaining share is distributed among other players.
- Innovation Catalysts: Growing demand for natural colorants, stringent regulations, and rising consumer awareness of health and sustainability are driving innovation.
- Regulatory Landscape: EU regulations on food additives, particularly concerning the labeling and safety of colorants, significantly impact market dynamics.
- Substitute Products: Natural alternatives and innovative extraction techniques are posing a growing challenge to traditional synthetic colorants.
- End-User Profiles: Major end-use segments include beverages, dairy & frozen products, bakery, meat, poultry & seafood, and confectionery.
- M&A Activities: The past five years have witnessed xx M&A deals, with an average deal value of xx Million. These activities reflect the consolidation efforts within the industry and the pursuit of expansion opportunities.
EU Food Colorant Market Industry Evolution
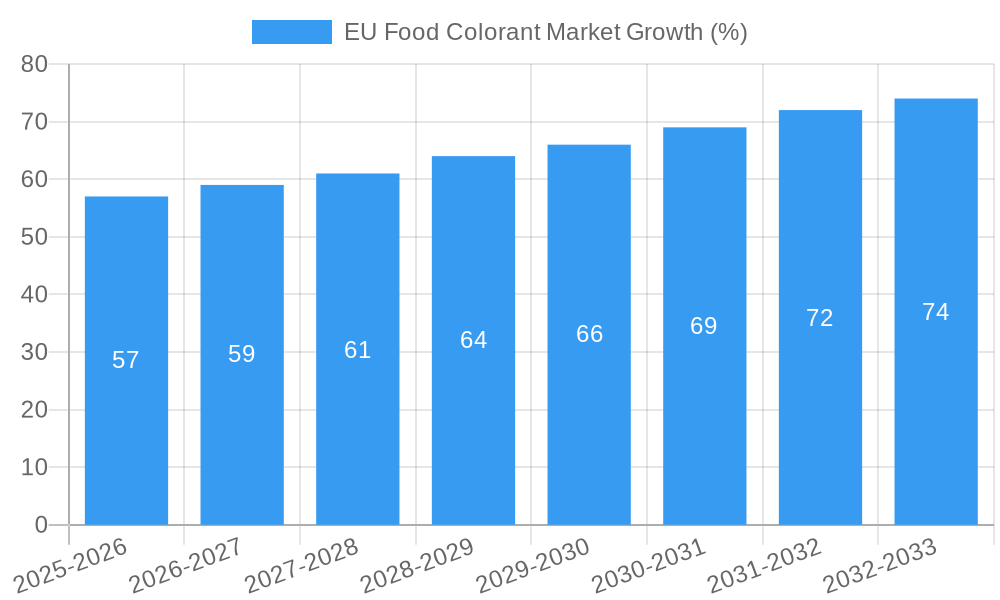
This section explores the historical and projected growth trajectories of the EU food colorant market, analyzing technological advancements and evolving consumer preferences. The market experienced a Compound Annual Growth Rate (CAGR) of xx% during the historical period (2019-2024) and is projected to maintain a CAGR of xx% during the forecast period (2025-2033). This growth is fueled by several factors. The increasing demand for processed foods, coupled with a rising preference for visually appealing products, is driving up demand for food colorants. Simultaneously, growing consumer health consciousness has prompted a surge in demand for natural colorants as consumers seek healthier options. Technological innovations, including the development of cleaner production methods and novel color extraction techniques, are also playing a key role. The adoption rate of natural colorants is increasing, with an estimated xx% of the market share in 2025, indicating a noteworthy shift in consumer and industry preferences.
Leading Regions, Countries, or Segments in EU Food Colorant Market
This section pinpoints the leading regions, countries, and segments within the EU food colorant market.
- By Product Type: The natural color segment is projected to experience faster growth than the synthetic color segment, driven by increased consumer demand for natural and clean-label products.
- By Application: The beverage segment currently holds the largest market share due to high demand for visually appealing drinks. The confectionery segment is also a significant consumer of food colorants.
- Key Drivers (Bullet Points):
- Investment Trends: Significant investments in research and development of natural colorants.
- Regulatory Support: EU regulations promoting the use of natural ingredients.
- Consumer Preferences: Shifting consumer preferences towards natural and healthier food choices.
- Technological Advancements: Development of superior extraction processes and improved color stability.
The dominance of specific regions and countries within the EU market is largely influenced by factors such as manufacturing capabilities, consumer preferences, and regulatory environments. Germany, France, and the UK represent significant markets due to their large populations and established food processing industries.
EU Food Colorant Market Product Innovations
Recent innovations have focused on developing more stable, vibrant, and naturally derived colorants. Companies are investing heavily in researching and extracting colors from natural sources, such as fruits, vegetables, and algae, to cater to the growing demand for clean-label products. New technologies, such as microencapsulation, are employed to improve the stability and shelf-life of these natural colorants. These innovations often involve unique selling propositions centered around improved color intensity, cost-effectiveness, and enhanced processing stability.
Propelling Factors for EU Food Colorant Market Growth
Several factors are driving the growth of the EU food colorant market. The increasing demand for processed foods, particularly in convenience food segments, fuels the need for attractive and visually appealing products. Additionally, the growth in the food and beverage industry, coupled with changing consumer preferences for enhanced aesthetics in food products, contributes significantly to market expansion. Technological advancements in color extraction and stabilization techniques are also contributing positively.
Obstacles in the EU Food Colorant Market
The EU food colorant market faces several challenges. Stricter EU regulations regarding the approval and labeling of food colorants increase compliance costs for manufacturers. Fluctuations in raw material prices and supply chain disruptions, especially for natural colorants, represent another obstacle. The increasing intensity of competition, with the emergence of new entrants and the growth of private label brands, also poses a significant challenge.
Future Opportunities in EU Food Colorant Market
Emerging opportunities lie in the growing demand for clean-label and natural food colorants. Developing sustainable and cost-effective extraction methods for natural colorants presents significant potential. Expanding into niche markets, such as functional foods and personalized nutrition, also offers promising prospects. Moreover, research into novel colorants from alternative sources and the development of innovative delivery systems will drive future growth.
Major Players in the EU Food Colorant Market Ecosystem
- Chr. Hansen A/S
- Sensient Technologies
- Dohler Group
- Riken Vitamin
- BASF SE
- Koninklijke DSM N.V.
- D&D Williamson & Co
- Givaudan (Naturex)
- List Not Exhaustive
Key Developments in EU Food Colorant Market Industry
- 2022-03: Launch of a new line of natural red colorants by Chr. Hansen A/S.
- 2023-06: Acquisition of a smaller colorant manufacturer by Sensient Technologies.
- 2024-09: Publication of updated EU regulations on food colorant labeling. (Specific details on further developments would be added in the full report)
Strategic EU Food Colorant Market Forecast
The EU food colorant market is poised for significant growth, driven by the increasing demand for processed foods, evolving consumer preferences, and technological advancements. The growing preference for natural and clean-label products will continue to reshape market dynamics. Opportunities exist in developing innovative and sustainable solutions that address the growing concerns around health, sustainability, and cost-effectiveness. The market's future is bright, characterized by further consolidation, innovation, and a focus on meeting the ever-evolving needs of the consumer and regulatory landscape.
EU Food Colorant Market Segmentation
-
1. Product Type
- 1.1. Natural Color
- 1.2. Synthetic Color
-
2. Application
- 2.1. Beverage
- 2.2. Dairy & Frozen Product
- 2.3. Bakery
- 2.4. Meat, Poultry & Seafood
- 2.5. Confectionery
- 2.6. Others
EU Food Colorant Market Segmentation By Geography
- 1. Spain
- 2. United Kingdom
- 3. Germany
- 4. France
- 5. Italy
- 6. Russia
- 7. Rest of Europe
EU Food Colorant Market REPORT HIGHLIGHTS
| Aspects | Details |
|---|---|
| Study Period | 2019-2033 |
| Base Year | 2024 |
| Estimated Year | 2025 |
| Forecast Period | 2025-2033 |
| Historical Period | 2019-2024 |
| Growth Rate | CAGR of 3.80% from 2019-2033 |
| Segmentation |
|
Table of Contents
- 1. Introduction
- 1.1. Research Scope
- 1.2. Market Segmentation
- 1.3. Research Methodology
- 1.4. Definitions and Assumptions
- 2. Executive Summary
- 2.1. Introduction
- 3. Market Dynamics
- 3.1. Introduction
- 3.2. Market Drivers
- 3.2.1. The Rising Awareness of the Health Benefits Associated with Collagen Consumption; Rising Sport and Fitness Trends Drives the Market Growth
- 3.3. Market Restrains
- 3.3.1. Concerns over the Source and Animal Welfare in Collagen Extraction Limit the Market Growth
- 3.4. Market Trends
- 3.4.1. United Kingdom Held the Largest Market Share
- 4. Market Factor Analysis
- 4.1. Porters Five Forces
- 4.2. Supply/Value Chain
- 4.3. PESTEL analysis
- 4.4. Market Entropy
- 4.5. Patent/Trademark Analysis
- 5. Global EU Food Colorant Market Analysis, Insights and Forecast, 2019-2031
- 5.1. Market Analysis, Insights and Forecast - by Product Type
- 5.1.1. Natural Color
- 5.1.2. Synthetic Color
- 5.2. Market Analysis, Insights and Forecast - by Application
- 5.2.1. Beverage
- 5.2.2. Dairy & Frozen Product
- 5.2.3. Bakery
- 5.2.4. Meat, Poultry & Seafood
- 5.2.5. Confectionery
- 5.2.6. Others
- 5.3. Market Analysis, Insights and Forecast - by Region
- 5.3.1. Spain
- 5.3.2. United Kingdom
- 5.3.3. Germany
- 5.3.4. France
- 5.3.5. Italy
- 5.3.6. Russia
- 5.3.7. Rest of Europe
- 5.1. Market Analysis, Insights and Forecast - by Product Type
- 6. Spain EU Food Colorant Market Analysis, Insights and Forecast, 2019-2031
- 6.1. Market Analysis, Insights and Forecast - by Product Type
- 6.1.1. Natural Color
- 6.1.2. Synthetic Color
- 6.2. Market Analysis, Insights and Forecast - by Application
- 6.2.1. Beverage
- 6.2.2. Dairy & Frozen Product
- 6.2.3. Bakery
- 6.2.4. Meat, Poultry & Seafood
- 6.2.5. Confectionery
- 6.2.6. Others
- 6.1. Market Analysis, Insights and Forecast - by Product Type
- 7. United Kingdom EU Food Colorant Market Analysis, Insights and Forecast, 2019-2031
- 7.1. Market Analysis, Insights and Forecast - by Product Type
- 7.1.1. Natural Color
- 7.1.2. Synthetic Color
- 7.2. Market Analysis, Insights and Forecast - by Application
- 7.2.1. Beverage
- 7.2.2. Dairy & Frozen Product
- 7.2.3. Bakery
- 7.2.4. Meat, Poultry & Seafood
- 7.2.5. Confectionery
- 7.2.6. Others
- 7.1. Market Analysis, Insights and Forecast - by Product Type
- 8. Germany EU Food Colorant Market Analysis, Insights and Forecast, 2019-2031
- 8.1. Market Analysis, Insights and Forecast - by Product Type
- 8.1.1. Natural Color
- 8.1.2. Synthetic Color
- 8.2. Market Analysis, Insights and Forecast - by Application
- 8.2.1. Beverage
- 8.2.2. Dairy & Frozen Product
- 8.2.3. Bakery
- 8.2.4. Meat, Poultry & Seafood
- 8.2.5. Confectionery
- 8.2.6. Others
- 8.1. Market Analysis, Insights and Forecast - by Product Type
- 9. France EU Food Colorant Market Analysis, Insights and Forecast, 2019-2031
- 9.1. Market Analysis, Insights and Forecast - by Product Type
- 9.1.1. Natural Color
- 9.1.2. Synthetic Color
- 9.2. Market Analysis, Insights and Forecast - by Application
- 9.2.1. Beverage
- 9.2.2. Dairy & Frozen Product
- 9.2.3. Bakery
- 9.2.4. Meat, Poultry & Seafood
- 9.2.5. Confectionery
- 9.2.6. Others
- 9.1. Market Analysis, Insights and Forecast - by Product Type
- 10. Italy EU Food Colorant Market Analysis, Insights and Forecast, 2019-2031
- 10.1. Market Analysis, Insights and Forecast - by Product Type
- 10.1.1. Natural Color
- 10.1.2. Synthetic Color
- 10.2. Market Analysis, Insights and Forecast - by Application
- 10.2.1. Beverage
- 10.2.2. Dairy & Frozen Product
- 10.2.3. Bakery
- 10.2.4. Meat, Poultry & Seafood
- 10.2.5. Confectionery
- 10.2.6. Others
- 10.1. Market Analysis, Insights and Forecast - by Product Type
- 11. Russia EU Food Colorant Market Analysis, Insights and Forecast, 2019-2031
- 11.1. Market Analysis, Insights and Forecast - by Product Type
- 11.1.1. Natural Color
- 11.1.2. Synthetic Color
- 11.2. Market Analysis, Insights and Forecast - by Application
- 11.2.1. Beverage
- 11.2.2. Dairy & Frozen Product
- 11.2.3. Bakery
- 11.2.4. Meat, Poultry & Seafood
- 11.2.5. Confectionery
- 11.2.6. Others
- 11.1. Market Analysis, Insights and Forecast - by Product Type
- 12. Rest of Europe EU Food Colorant Market Analysis, Insights and Forecast, 2019-2031
- 12.1. Market Analysis, Insights and Forecast - by Product Type
- 12.1.1. Natural Color
- 12.1.2. Synthetic Color
- 12.2. Market Analysis, Insights and Forecast - by Application
- 12.2.1. Beverage
- 12.2.2. Dairy & Frozen Product
- 12.2.3. Bakery
- 12.2.4. Meat, Poultry & Seafood
- 12.2.5. Confectionery
- 12.2.6. Others
- 12.1. Market Analysis, Insights and Forecast - by Product Type
- 13. North America EU Food Colorant Market Analysis, Insights and Forecast, 2019-2031
- 13.1. Market Analysis, Insights and Forecast - By Country/Sub-region
- 13.1.1 United States
- 13.1.2 Canada
- 13.1.3 Mexico
- 14. Europe EU Food Colorant Market Analysis, Insights and Forecast, 2019-2031
- 14.1. Market Analysis, Insights and Forecast - By Country/Sub-region
- 14.1.1 Germany
- 14.1.2 United Kingdom
- 14.1.3 France
- 14.1.4 Spain
- 14.1.5 Italy
- 14.1.6 Spain
- 14.1.7 Belgium
- 14.1.8 Netherland
- 14.1.9 Nordics
- 14.1.10 Rest of Europe
- 15. Asia Pacific EU Food Colorant Market Analysis, Insights and Forecast, 2019-2031
- 15.1. Market Analysis, Insights and Forecast - By Country/Sub-region
- 15.1.1 China
- 15.1.2 Japan
- 15.1.3 India
- 15.1.4 South Korea
- 15.1.5 Southeast Asia
- 15.1.6 Australia
- 15.1.7 Indonesia
- 15.1.8 Phillipes
- 15.1.9 Singapore
- 15.1.10 Thailandc
- 15.1.11 Rest of Asia Pacific
- 16. South America EU Food Colorant Market Analysis, Insights and Forecast, 2019-2031
- 16.1. Market Analysis, Insights and Forecast - By Country/Sub-region
- 16.1.1 Brazil
- 16.1.2 Argentina
- 16.1.3 Peru
- 16.1.4 Chile
- 16.1.5 Colombia
- 16.1.6 Ecuador
- 16.1.7 Venezuela
- 16.1.8 Rest of South America
- 17. North America EU Food Colorant Market Analysis, Insights and Forecast, 2019-2031
- 17.1. Market Analysis, Insights and Forecast - By Country/Sub-region
- 17.1.1 United States
- 17.1.2 Canada
- 17.1.3 Mexico
- 18. MEA EU Food Colorant Market Analysis, Insights and Forecast, 2019-2031
- 18.1. Market Analysis, Insights and Forecast - By Country/Sub-region
- 18.1.1 United Arab Emirates
- 18.1.2 Saudi Arabia
- 18.1.3 South Africa
- 18.1.4 Rest of Middle East and Africa
- 19. Competitive Analysis
- 19.1. Global Market Share Analysis 2024
- 19.2. Company Profiles
- 19.2.1 Chr Hansen A/S
- 19.2.1.1. Overview
- 19.2.1.2. Products
- 19.2.1.3. SWOT Analysis
- 19.2.1.4. Recent Developments
- 19.2.1.5. Financials (Based on Availability)
- 19.2.2 Sensient Technologies
- 19.2.2.1. Overview
- 19.2.2.2. Products
- 19.2.2.3. SWOT Analysis
- 19.2.2.4. Recent Developments
- 19.2.2.5. Financials (Based on Availability)
- 19.2.3 Dohler Group
- 19.2.3.1. Overview
- 19.2.3.2. Products
- 19.2.3.3. SWOT Analysis
- 19.2.3.4. Recent Developments
- 19.2.3.5. Financials (Based on Availability)
- 19.2.4 Riken Vitamin
- 19.2.4.1. Overview
- 19.2.4.2. Products
- 19.2.4.3. SWOT Analysis
- 19.2.4.4. Recent Developments
- 19.2.4.5. Financials (Based on Availability)
- 19.2.5 BASF SE
- 19.2.5.1. Overview
- 19.2.5.2. Products
- 19.2.5.3. SWOT Analysis
- 19.2.5.4. Recent Developments
- 19.2.5.5. Financials (Based on Availability)
- 19.2.6 Koninklijke DSM N V
- 19.2.6.1. Overview
- 19.2.6.2. Products
- 19.2.6.3. SWOT Analysis
- 19.2.6.4. Recent Developments
- 19.2.6.5. Financials (Based on Availability)
- 19.2.7 D D Williamson & Co
- 19.2.7.1. Overview
- 19.2.7.2. Products
- 19.2.7.3. SWOT Analysis
- 19.2.7.4. Recent Developments
- 19.2.7.5. Financials (Based on Availability)
- 19.2.8 Givaudan (Naturex)*List Not Exhaustive
- 19.2.8.1. Overview
- 19.2.8.2. Products
- 19.2.8.3. SWOT Analysis
- 19.2.8.4. Recent Developments
- 19.2.8.5. Financials (Based on Availability)
- 19.2.1 Chr Hansen A/S
List of Figures
- Figure 1: Global EU Food Colorant Market Revenue Breakdown (Million, %) by Region 2024 & 2032
- Figure 2: North America EU Food Colorant Market Revenue (Million), by Country 2024 & 2032
- Figure 3: North America EU Food Colorant Market Revenue Share (%), by Country 2024 & 2032
- Figure 4: Europe EU Food Colorant Market Revenue (Million), by Country 2024 & 2032
- Figure 5: Europe EU Food Colorant Market Revenue Share (%), by Country 2024 & 2032
- Figure 6: Asia Pacific EU Food Colorant Market Revenue (Million), by Country 2024 & 2032
- Figure 7: Asia Pacific EU Food Colorant Market Revenue Share (%), by Country 2024 & 2032
- Figure 8: South America EU Food Colorant Market Revenue (Million), by Country 2024 & 2032
- Figure 9: South America EU Food Colorant Market Revenue Share (%), by Country 2024 & 2032
- Figure 10: North America EU Food Colorant Market Revenue (Million), by Country 2024 & 2032
- Figure 11: North America EU Food Colorant Market Revenue Share (%), by Country 2024 & 2032
- Figure 12: MEA EU Food Colorant Market Revenue (Million), by Country 2024 & 2032
- Figure 13: MEA EU Food Colorant Market Revenue Share (%), by Country 2024 & 2032
- Figure 14: Spain EU Food Colorant Market Revenue (Million), by Product Type 2024 & 2032
- Figure 15: Spain EU Food Colorant Market Revenue Share (%), by Product Type 2024 & 2032
- Figure 16: Spain EU Food Colorant Market Revenue (Million), by Application 2024 & 2032
- Figure 17: Spain EU Food Colorant Market Revenue Share (%), by Application 2024 & 2032
- Figure 18: Spain EU Food Colorant Market Revenue (Million), by Country 2024 & 2032
- Figure 19: Spain EU Food Colorant Market Revenue Share (%), by Country 2024 & 2032
- Figure 20: United Kingdom EU Food Colorant Market Revenue (Million), by Product Type 2024 & 2032
- Figure 21: United Kingdom EU Food Colorant Market Revenue Share (%), by Product Type 2024 & 2032
- Figure 22: United Kingdom EU Food Colorant Market Revenue (Million), by Application 2024 & 2032
- Figure 23: United Kingdom EU Food Colorant Market Revenue Share (%), by Application 2024 & 2032
- Figure 24: United Kingdom EU Food Colorant Market Revenue (Million), by Country 2024 & 2032
- Figure 25: United Kingdom EU Food Colorant Market Revenue Share (%), by Country 2024 & 2032
- Figure 26: Germany EU Food Colorant Market Revenue (Million), by Product Type 2024 & 2032
- Figure 27: Germany EU Food Colorant Market Revenue Share (%), by Product Type 2024 & 2032
- Figure 28: Germany EU Food Colorant Market Revenue (Million), by Application 2024 & 2032
- Figure 29: Germany EU Food Colorant Market Revenue Share (%), by Application 2024 & 2032
- Figure 30: Germany EU Food Colorant Market Revenue (Million), by Country 2024 & 2032
- Figure 31: Germany EU Food Colorant Market Revenue Share (%), by Country 2024 & 2032
- Figure 32: France EU Food Colorant Market Revenue (Million), by Product Type 2024 & 2032
- Figure 33: France EU Food Colorant Market Revenue Share (%), by Product Type 2024 & 2032
- Figure 34: France EU Food Colorant Market Revenue (Million), by Application 2024 & 2032
- Figure 35: France EU Food Colorant Market Revenue Share (%), by Application 2024 & 2032
- Figure 36: France EU Food Colorant Market Revenue (Million), by Country 2024 & 2032
- Figure 37: France EU Food Colorant Market Revenue Share (%), by Country 2024 & 2032
- Figure 38: Italy EU Food Colorant Market Revenue (Million), by Product Type 2024 & 2032
- Figure 39: Italy EU Food Colorant Market Revenue Share (%), by Product Type 2024 & 2032
- Figure 40: Italy EU Food Colorant Market Revenue (Million), by Application 2024 & 2032
- Figure 41: Italy EU Food Colorant Market Revenue Share (%), by Application 2024 & 2032
- Figure 42: Italy EU Food Colorant Market Revenue (Million), by Country 2024 & 2032
- Figure 43: Italy EU Food Colorant Market Revenue Share (%), by Country 2024 & 2032
- Figure 44: Russia EU Food Colorant Market Revenue (Million), by Product Type 2024 & 2032
- Figure 45: Russia EU Food Colorant Market Revenue Share (%), by Product Type 2024 & 2032
- Figure 46: Russia EU Food Colorant Market Revenue (Million), by Application 2024 & 2032
- Figure 47: Russia EU Food Colorant Market Revenue Share (%), by Application 2024 & 2032
- Figure 48: Russia EU Food Colorant Market Revenue (Million), by Country 2024 & 2032
- Figure 49: Russia EU Food Colorant Market Revenue Share (%), by Country 2024 & 2032
- Figure 50: Rest of Europe EU Food Colorant Market Revenue (Million), by Product Type 2024 & 2032
- Figure 51: Rest of Europe EU Food Colorant Market Revenue Share (%), by Product Type 2024 & 2032
- Figure 52: Rest of Europe EU Food Colorant Market Revenue (Million), by Application 2024 & 2032
- Figure 53: Rest of Europe EU Food Colorant Market Revenue Share (%), by Application 2024 & 2032
- Figure 54: Rest of Europe EU Food Colorant Market Revenue (Million), by Country 2024 & 2032
- Figure 55: Rest of Europe EU Food Colorant Market Revenue Share (%), by Country 2024 & 2032
List of Tables
- Table 1: Global EU Food Colorant Market Revenue Million Forecast, by Region 2019 & 2032
- Table 2: Global EU Food Colorant Market Revenue Million Forecast, by Product Type 2019 & 2032
- Table 3: Global EU Food Colorant Market Revenue Million Forecast, by Application 2019 & 2032
- Table 4: Global EU Food Colorant Market Revenue Million Forecast, by Region 2019 & 2032
- Table 5: Global EU Food Colorant Market Revenue Million Forecast, by Country 2019 & 2032
- Table 6: United States EU Food Colorant Market Revenue (Million) Forecast, by Application 2019 & 2032
- Table 7: Canada EU Food Colorant Market Revenue (Million) Forecast, by Application 2019 & 2032
- Table 8: Mexico EU Food Colorant Market Revenue (Million) Forecast, by Application 2019 & 2032
- Table 9: Global EU Food Colorant Market Revenue Million Forecast, by Country 2019 & 2032
- Table 10: Germany EU Food Colorant Market Revenue (Million) Forecast, by Application 2019 & 2032
- Table 11: United Kingdom EU Food Colorant Market Revenue (Million) Forecast, by Application 2019 & 2032
- Table 12: France EU Food Colorant Market Revenue (Million) Forecast, by Application 2019 & 2032
- Table 13: Spain EU Food Colorant Market Revenue (Million) Forecast, by Application 2019 & 2032
- Table 14: Italy EU Food Colorant Market Revenue (Million) Forecast, by Application 2019 & 2032
- Table 15: Spain EU Food Colorant Market Revenue (Million) Forecast, by Application 2019 & 2032
- Table 16: Belgium EU Food Colorant Market Revenue (Million) Forecast, by Application 2019 & 2032
- Table 17: Netherland EU Food Colorant Market Revenue (Million) Forecast, by Application 2019 & 2032
- Table 18: Nordics EU Food Colorant Market Revenue (Million) Forecast, by Application 2019 & 2032
- Table 19: Rest of Europe EU Food Colorant Market Revenue (Million) Forecast, by Application 2019 & 2032
- Table 20: Global EU Food Colorant Market Revenue Million Forecast, by Country 2019 & 2032
- Table 21: China EU Food Colorant Market Revenue (Million) Forecast, by Application 2019 & 2032
- Table 22: Japan EU Food Colorant Market Revenue (Million) Forecast, by Application 2019 & 2032
- Table 23: India EU Food Colorant Market Revenue (Million) Forecast, by Application 2019 & 2032
- Table 24: South Korea EU Food Colorant Market Revenue (Million) Forecast, by Application 2019 & 2032
- Table 25: Southeast Asia EU Food Colorant Market Revenue (Million) Forecast, by Application 2019 & 2032
- Table 26: Australia EU Food Colorant Market Revenue (Million) Forecast, by Application 2019 & 2032
- Table 27: Indonesia EU Food Colorant Market Revenue (Million) Forecast, by Application 2019 & 2032
- Table 28: Phillipes EU Food Colorant Market Revenue (Million) Forecast, by Application 2019 & 2032
- Table 29: Singapore EU Food Colorant Market Revenue (Million) Forecast, by Application 2019 & 2032
- Table 30: Thailandc EU Food Colorant Market Revenue (Million) Forecast, by Application 2019 & 2032
- Table 31: Rest of Asia Pacific EU Food Colorant Market Revenue (Million) Forecast, by Application 2019 & 2032
- Table 32: Global EU Food Colorant Market Revenue Million Forecast, by Country 2019 & 2032
- Table 33: Brazil EU Food Colorant Market Revenue (Million) Forecast, by Application 2019 & 2032
- Table 34: Argentina EU Food Colorant Market Revenue (Million) Forecast, by Application 2019 & 2032
- Table 35: Peru EU Food Colorant Market Revenue (Million) Forecast, by Application 2019 & 2032
- Table 36: Chile EU Food Colorant Market Revenue (Million) Forecast, by Application 2019 & 2032
- Table 37: Colombia EU Food Colorant Market Revenue (Million) Forecast, by Application 2019 & 2032
- Table 38: Ecuador EU Food Colorant Market Revenue (Million) Forecast, by Application 2019 & 2032
- Table 39: Venezuela EU Food Colorant Market Revenue (Million) Forecast, by Application 2019 & 2032
- Table 40: Rest of South America EU Food Colorant Market Revenue (Million) Forecast, by Application 2019 & 2032
- Table 41: Global EU Food Colorant Market Revenue Million Forecast, by Country 2019 & 2032
- Table 42: United States EU Food Colorant Market Revenue (Million) Forecast, by Application 2019 & 2032
- Table 43: Canada EU Food Colorant Market Revenue (Million) Forecast, by Application 2019 & 2032
- Table 44: Mexico EU Food Colorant Market Revenue (Million) Forecast, by Application 2019 & 2032
- Table 45: Global EU Food Colorant Market Revenue Million Forecast, by Country 2019 & 2032
- Table 46: United Arab Emirates EU Food Colorant Market Revenue (Million) Forecast, by Application 2019 & 2032
- Table 47: Saudi Arabia EU Food Colorant Market Revenue (Million) Forecast, by Application 2019 & 2032
- Table 48: South Africa EU Food Colorant Market Revenue (Million) Forecast, by Application 2019 & 2032
- Table 49: Rest of Middle East and Africa EU Food Colorant Market Revenue (Million) Forecast, by Application 2019 & 2032
- Table 50: Global EU Food Colorant Market Revenue Million Forecast, by Product Type 2019 & 2032
- Table 51: Global EU Food Colorant Market Revenue Million Forecast, by Application 2019 & 2032
- Table 52: Global EU Food Colorant Market Revenue Million Forecast, by Country 2019 & 2032
- Table 53: Global EU Food Colorant Market Revenue Million Forecast, by Product Type 2019 & 2032
- Table 54: Global EU Food Colorant Market Revenue Million Forecast, by Application 2019 & 2032
- Table 55: Global EU Food Colorant Market Revenue Million Forecast, by Country 2019 & 2032
- Table 56: Global EU Food Colorant Market Revenue Million Forecast, by Product Type 2019 & 2032
- Table 57: Global EU Food Colorant Market Revenue Million Forecast, by Application 2019 & 2032
- Table 58: Global EU Food Colorant Market Revenue Million Forecast, by Country 2019 & 2032
- Table 59: Global EU Food Colorant Market Revenue Million Forecast, by Product Type 2019 & 2032
- Table 60: Global EU Food Colorant Market Revenue Million Forecast, by Application 2019 & 2032
- Table 61: Global EU Food Colorant Market Revenue Million Forecast, by Country 2019 & 2032
- Table 62: Global EU Food Colorant Market Revenue Million Forecast, by Product Type 2019 & 2032
- Table 63: Global EU Food Colorant Market Revenue Million Forecast, by Application 2019 & 2032
- Table 64: Global EU Food Colorant Market Revenue Million Forecast, by Country 2019 & 2032
- Table 65: Global EU Food Colorant Market Revenue Million Forecast, by Product Type 2019 & 2032
- Table 66: Global EU Food Colorant Market Revenue Million Forecast, by Application 2019 & 2032
- Table 67: Global EU Food Colorant Market Revenue Million Forecast, by Country 2019 & 2032
- Table 68: Global EU Food Colorant Market Revenue Million Forecast, by Product Type 2019 & 2032
- Table 69: Global EU Food Colorant Market Revenue Million Forecast, by Application 2019 & 2032
- Table 70: Global EU Food Colorant Market Revenue Million Forecast, by Country 2019 & 2032
Frequently Asked Questions
1. What is the projected Compound Annual Growth Rate (CAGR) of the EU Food Colorant Market?
The projected CAGR is approximately 3.80%.
2. Which companies are prominent players in the EU Food Colorant Market?
Key companies in the market include Chr Hansen A/S, Sensient Technologies, Dohler Group, Riken Vitamin, BASF SE, Koninklijke DSM N V, D D Williamson & Co, Givaudan (Naturex)*List Not Exhaustive.
3. What are the main segments of the EU Food Colorant Market?
The market segments include Product Type, Application.
4. Can you provide details about the market size?
The market size is estimated to be USD XX Million as of 2022.
5. What are some drivers contributing to market growth?
The Rising Awareness of the Health Benefits Associated with Collagen Consumption; Rising Sport and Fitness Trends Drives the Market Growth.
6. What are the notable trends driving market growth?
United Kingdom Held the Largest Market Share.
7. Are there any restraints impacting market growth?
Concerns over the Source and Animal Welfare in Collagen Extraction Limit the Market Growth.
8. Can you provide examples of recent developments in the market?
N/A
9. What pricing options are available for accessing the report?
Pricing options include single-user, multi-user, and enterprise licenses priced at USD 4750, USD 5250, and USD 8750 respectively.
10. Is the market size provided in terms of value or volume?
The market size is provided in terms of value, measured in Million.
11. Are there any specific market keywords associated with the report?
Yes, the market keyword associated with the report is "EU Food Colorant Market," which aids in identifying and referencing the specific market segment covered.
12. How do I determine which pricing option suits my needs best?
The pricing options vary based on user requirements and access needs. Individual users may opt for single-user licenses, while businesses requiring broader access may choose multi-user or enterprise licenses for cost-effective access to the report.
13. Are there any additional resources or data provided in the EU Food Colorant Market report?
While the report offers comprehensive insights, it's advisable to review the specific contents or supplementary materials provided to ascertain if additional resources or data are available.
14. How can I stay updated on further developments or reports in the EU Food Colorant Market?
To stay informed about further developments, trends, and reports in the EU Food Colorant Market, consider subscribing to industry newsletters, following relevant companies and organizations, or regularly checking reputable industry news sources and publications.
Methodology
Step 1 - Identification of Relevant Samples Size from Population Database


Step 2 - Approaches for Defining Global Market Size (Value, Volume* & Price*)

Note*: In applicable scenarios
Step 3 - Data Sources
Primary Research
- Web Analytics
- Survey Reports
- Research Institute
- Latest Research Reports
- Opinion Leaders
Secondary Research
- Annual Reports
- White Paper
- Latest Press Release
- Industry Association
- Paid Database
- Investor Presentations

Step 4 - Data Triangulation
Involves using different sources of information in order to increase the validity of a study
These sources are likely to be stakeholders in a program - participants, other researchers, program staff, other community members, and so on.
Then we put all data in single framework & apply various statistical tools to find out the dynamic on the market.
During the analysis stage, feedback from the stakeholder groups would be compared to determine areas of agreement as well as areas of divergence
