

Key Insights
The African tea market is projected to reach $4.01 billion by 2025, with an anticipated Compound Annual Growth Rate (CAGR) of 7.7% from 2025 to 2033. This growth is propelled by increasing disposable incomes and a young, expanding demographic. Consumers are increasingly favoring tea as a healthier beverage option over sugary drinks, further bolstered by established traditional tea-drinking customs across the continent. Key growth drivers include rising consumer demand for ready-to-drink and CTC tea formats. Challenges such as fluctuating global tea prices and competition from coffee and soft drinks persist. The market is characterized by a fragmented competitive landscape featuring multinational corporations and regional brands. Significant growth is expected in prominent markets like South Africa, Kenya, and Tanzania, with black tea dominating demand, followed by green tea and other varieties. Distribution channels are led by supermarkets and hypermarkets, with online retail emerging as a rapidly growing segment.
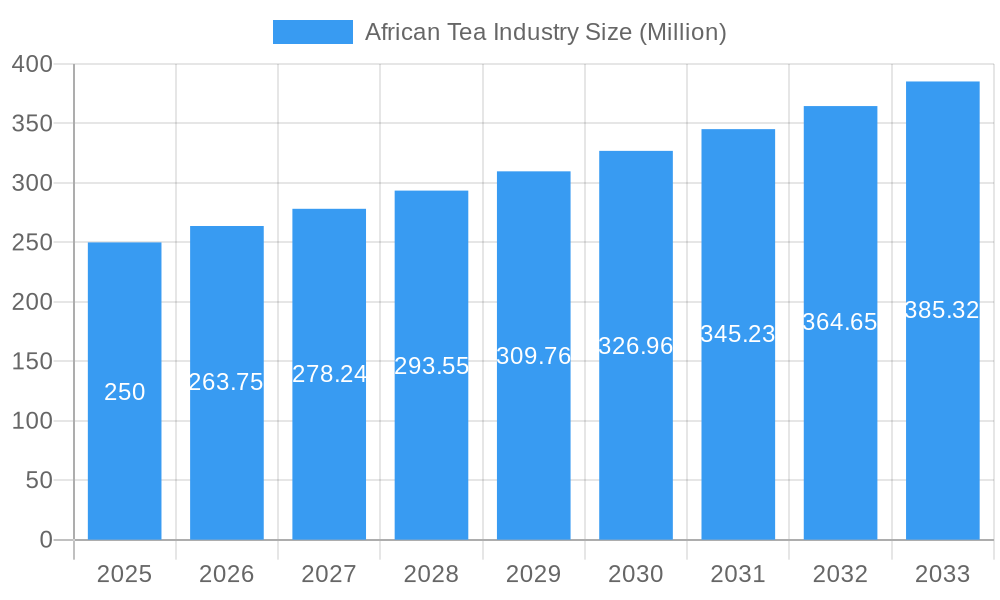
African Tea Industry Market Size (In Billion)
Future growth in the African tea market necessitates strategic approaches to capitalize on opportunities and mitigate challenges. Market participants are emphasizing product innovation, including flavored and organic tea varieties, to meet diverse consumer preferences. Targeted marketing campaigns highlighting tea's health benefits and cultural significance are vital for sales acceleration. Geographic expansion and enhanced distribution networks, particularly in underserved regions, are crucial growth strategies. Leveraging e-commerce platforms to reach a wider consumer base, especially in urban centers, is essential for increased market penetration and competitive advantage. Proactive strategies, such as ensuring sustainable sourcing and optimizing supply chains, are necessary to manage price volatility and competitive pressures.
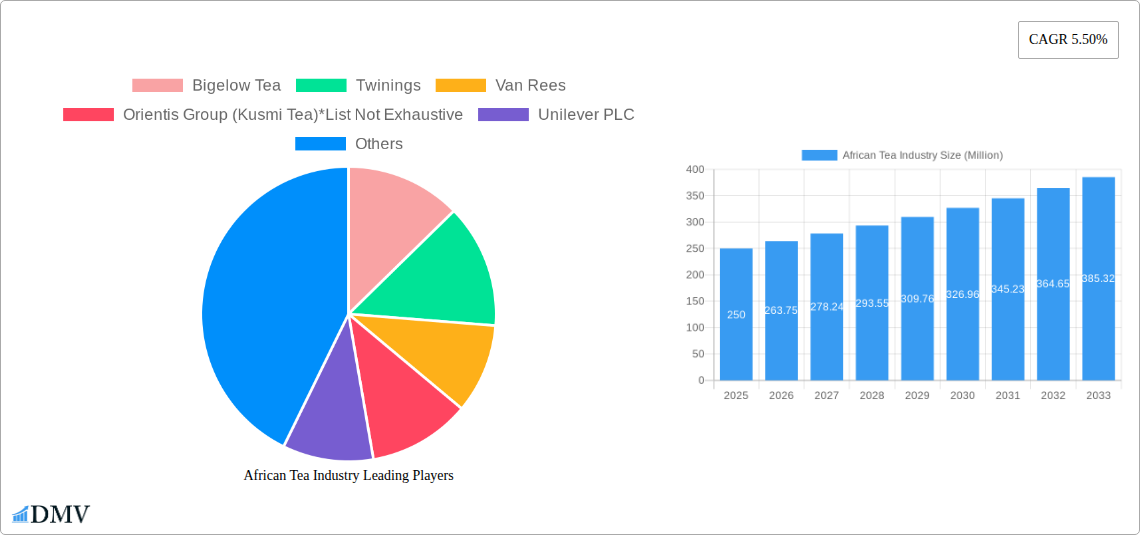
African Tea Industry Company Market Share
African Tea Industry: Market Analysis, Trends, and Forecast (2019-2033)
This comprehensive report delivers an in-depth analysis of the African tea industry, projecting a market valuation exceeding xx Million by 2033. Spanning the historical period (2019-2024), base year (2025), and forecast period (2025-2033), this study provides invaluable insights for stakeholders seeking to navigate this dynamic market. We meticulously examine market segmentation, key players, growth drivers, and challenges, offering a robust forecast to guide strategic decision-making.
African Tea Industry Market Composition & Trends
This section analyzes the competitive landscape, innovation drivers, regulatory environment, substitute products, consumer profiles, and merger & acquisition (M&A) activities within the African tea market. Market concentration reveals a moderately fragmented landscape, with key players like Unilever PLC, Bigelow Tea, Twinings, and Tata Global Beverages holding significant, yet not dominant, shares. The market share distribution shows Unilever PLC leading with an estimated xx% in 2025, followed by Tata Global Beverages at xx%, and others collectively accounting for the remaining xx%.
- Market Concentration: Moderately fragmented, with no single dominant player.
- Innovation Catalysts: Growing demand for specialty teas (e.g., herbal infusions, organic options), coupled with advancements in packaging and distribution technologies.
- Regulatory Landscape: Variable across African nations, impacting trade and production practices. Further research into specific country regulations is recommended.
- Substitute Products: Coffee, herbal infusions, and other beverages compete for consumer preference.
- End-User Profiles: Diverse, ranging from individual consumers to large-scale food service establishments. Detailed demographic data is available in the full report.
- M&A Activities: Moderate activity observed during the historical period (2019-2024), with deal values totaling approximately xx Million. Increased M&A activity is predicted in the forecast period. Examples and details of these transactions can be found within the full report.
African Tea Industry Industry Evolution
The African tea industry has witnessed significant evolution during the study period. Market growth trajectories have been influenced by several factors including fluctuating commodity prices, changing consumer preferences, and technological advancements. Between 2019 and 2024, the market exhibited a Compound Annual Growth Rate (CAGR) of xx%, driven primarily by increasing consumer disposable incomes and a rise in tea consumption, especially in urban areas. Technological advancements, such as improved tea processing techniques and efficient supply chain management, have further boosted efficiency and product quality. However, challenges remain, including the impact of climate change on tea production and the need for sustainable agricultural practices. The report provides a granular examination of these trends and their potential impact on future growth. The projected CAGR for 2025-2033 is estimated to be xx%, signifying continued market expansion, albeit at a potentially slower rate.
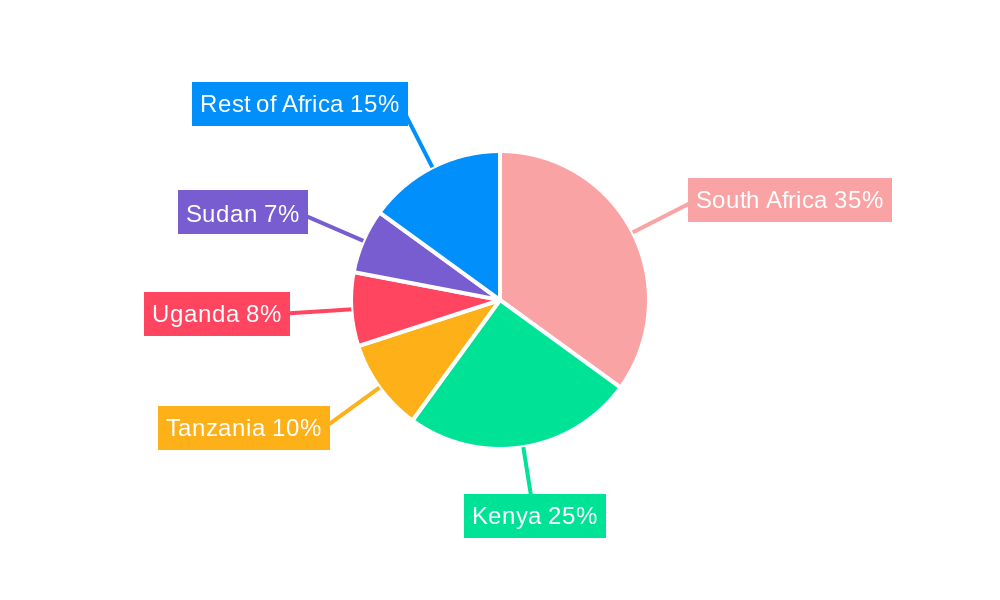
Leading Regions, Countries, or Segments in African Tea Industry
The African tea market exhibits regional variations in consumption patterns and production capacities. Kenya and Tanzania remain dominant in tea production and export, owing to favorable climatic conditions and established tea estates. The segment analysis reveals that Black Tea holds the largest market share among product types, while CTC tea (Crushed, Teared, and Curled Tea) accounts for the majority of tea form sold. Supermarkets/hypermarkets are the primary distribution channel.
Key Drivers for Dominance:
- Kenya & Tanzania: Established tea industry infrastructure, favorable climate, government support, and substantial export markets.
- Black Tea: Wide consumer acceptance, established production infrastructure, and cost-effectiveness.
- CTC Tea: Suitability for mass production, affordability, and wide consumer appeal.
- Supermarkets/Hypermarkets: Extensive reach, established distribution networks, and strong consumer preference for readily available products.
Detailed regional breakdown including market size and growth projections are included within the full report.
African Tea Industry Product Innovations
Significant innovation is shaping the African tea industry. The focus is on developing value-added products, such as flavored teas, organic teas, and ready-to-drink (RTD) options. Technological advancements in packaging (e.g., single-serve sachets) and distribution channels (e.g., e-commerce platforms) are also impacting the market. These innovations improve convenience, meet evolving consumer preferences, and address sustainability concerns. Key innovations are further discussed in the full report.
Propelling Factors for African Tea Industry Growth
Several factors fuel the growth of the African tea industry. Rising disposable incomes, particularly within the burgeoning middle class, are boosting demand for premium and specialty teas. Favorable government policies promoting agricultural development, coupled with investments in infrastructure and technology, are also supporting the sector's expansion. Lastly, the increasing awareness of tea's health benefits adds to its appeal and drives consumption.
Obstacles in the African Tea Industry Market
The African tea industry faces several significant hurdles. Climate change poses a major threat, impacting tea yields and quality. Supply chain inefficiencies and logistical challenges increase production costs and hinder timely delivery. Intense competition from substitute beverages and fluctuating global commodity prices further complicate the market dynamics. The report provides a detailed analysis of these challenges, including quantifiable impacts on market growth.
Future Opportunities in African Tea Industry
The African tea industry presents substantial future opportunities. The expansion of e-commerce platforms opens new avenues for distribution and reaching wider consumer segments. Growth in the premium and specialty tea segments presents a significant opportunity for value addition and higher profit margins. Moreover, increased investments in sustainable and ethical tea production practices will improve brand reputation and appeal to environmentally conscious consumers.
Major Players in the African Tea Industry Ecosystem
- Bigelow Tea
- Twinings
- Van Rees
- Orientis Group (Kusmi Tea)
- Unilever PLC
- DavidsTea
- Tata Global Beverages
- Chebango Tea Company
- Dilmah
- Hain Celestial
Key Developments in African Tea Industry Industry
- 2022-Q4: Unilever PLC launches a new line of organic teas in South Africa.
- 2023-Q1: Tata Global Beverages announces a strategic investment in tea processing technology in Kenya.
- 2023-Q3: A major merger occurs between two smaller tea companies in Tanzania (Details within report).
Strategic African Tea Industry Market Forecast
The African tea market is poised for continued expansion driven by multiple factors. Increasing consumer demand, especially for premium and specialty teas, coupled with technological advancements and strategic investments, will propel market growth in the coming years. This report provides granular forecasting data, segment-wise projections, and detailed regional analysis, enabling stakeholders to make informed business decisions in this thriving industry. The predicted market value in 2033 will be significantly higher than 2025, showcasing considerable potential for future investment and growth.
African Tea Industry Segmentation
-
1. Form
- 1.1. Leaf Tea
- 1.2. CTC Tea (Crushed, Teared, and Curled Tea)
-
2. Product Type
- 2.1. Black Tea
- 2.2. Green Tea
- 2.3. Other Types (White and Oolong)
-
3. Distribution Channel
- 3.1. Supermarkets/Hypermarkets
- 3.2. Specialist Retailers
- 3.3. Convenience Stores
- 3.4. Online Retailers
- 3.5. Other Channels
-
4. Geography
- 4.1. South Africa
- 4.2. Egypt
- 4.3. Rest of Africa
African Tea Industry Segmentation By Geography
- 1. South Africa
- 2. Egypt
- 3. Rest of Africa
African Tea Industry Regional Market Share
Geographic Coverage of African Tea Industry
African Tea Industry REPORT HIGHLIGHTS
| Aspects | Details |
|---|---|
| Study Period | 2020-2034 |
| Base Year | 2025 |
| Estimated Year | 2026 |
| Forecast Period | 2026-2034 |
| Historical Period | 2020-2025 |
| Growth Rate | CAGR of 7.7% from 2020-2034 |
| Segmentation |
|
Table of Contents
- 1. Introduction
- 1.1. Research Scope
- 1.2. Market Segmentation
- 1.3. Research Objective
- 1.4. Definitions and Assumptions
- 2. Executive Summary
- 2.1. Market Snapshot
- 3. Market Dynamics
- 3.1. Market Drivers
- 3.2. Market Restrains
- 3.3. Market Trends
- 3.4. Market Opportunities
- 4. Market Factor Analysis
- 4.1. Porters Five Forces
- 4.1.1. Bargaining Power of Suppliers
- 4.1.2. Bargaining Power of Buyers
- 4.1.3. Threat of New Entrants
- 4.1.4. Threat of Substitutes
- 4.1.5. Competitive Rivalry
- 4.2. PESTEL analysis
- 4.3. BCG Analysis
- 4.3.1. Stars (High Growth, High Market Share)
- 4.3.2. Cash Cows (Low Growth, High Market Share)
- 4.3.3. Question Mark (High Growth, Low Market Share)
- 4.3.4. Dogs (Low Growth, Low Market Share)
- 4.4. Ansoff Matrix Analysis
- 4.5. Supply Chain Analysis
- 4.6. Regulatory Landscape
- 4.7. Current Market Potential and Opportunity Assessment (TAM–SAM–SOM Framework)
- 4.8. DMV Analyst Note
- 4.1. Porters Five Forces
- 5. Market Analysis, Insights and Forecast 2021-2033
- 5.1. Market Analysis, Insights and Forecast - by Form
- 5.1.1. Leaf Tea
- 5.1.2. CTC Tea (Crushed, Teared, and Curled Tea)
- 5.2. Market Analysis, Insights and Forecast - by Product Type
- 5.2.1. Black Tea
- 5.2.2. Green Tea
- 5.2.3. Other Types (White and Oolong)
- 5.3. Market Analysis, Insights and Forecast - by Distribution Channel
- 5.3.1. Supermarkets/Hypermarkets
- 5.3.2. Specialist Retailers
- 5.3.3. Convenience Stores
- 5.3.4. Online Retailers
- 5.3.5. Other Channels
- 5.4. Market Analysis, Insights and Forecast - by Geography
- 5.4.1. South Africa
- 5.4.2. Egypt
- 5.4.3. Rest of Africa
- 5.5. Market Analysis, Insights and Forecast - by Region
- 5.5.1. South Africa
- 5.5.2. Egypt
- 5.5.3. Rest of Africa
- 5.1. Market Analysis, Insights and Forecast - by Form
- 6. African Tea Industry Analysis, Insights and Forecast, 2021-2033
- 6.1. Market Analysis, Insights and Forecast - by Form
- 6.1.1. Leaf Tea
- 6.1.2. CTC Tea (Crushed, Teared, and Curled Tea)
- 6.2. Market Analysis, Insights and Forecast - by Product Type
- 6.2.1. Black Tea
- 6.2.2. Green Tea
- 6.2.3. Other Types (White and Oolong)
- 6.3. Market Analysis, Insights and Forecast - by Distribution Channel
- 6.3.1. Supermarkets/Hypermarkets
- 6.3.2. Specialist Retailers
- 6.3.3. Convenience Stores
- 6.3.4. Online Retailers
- 6.3.5. Other Channels
- 6.4. Market Analysis, Insights and Forecast - by Geography
- 6.4.1. South Africa
- 6.4.2. Egypt
- 6.4.3. Rest of Africa
- 6.1. Market Analysis, Insights and Forecast - by Form
- 7. South Africa African Tea Industry Analysis, Insights and Forecast, 2020-2032
- 7.1. Market Analysis, Insights and Forecast - by Form
- 7.1.1. Leaf Tea
- 7.1.2. CTC Tea (Crushed, Teared, and Curled Tea)
- 7.2. Market Analysis, Insights and Forecast - by Product Type
- 7.2.1. Black Tea
- 7.2.2. Green Tea
- 7.2.3. Other Types (White and Oolong)
- 7.3. Market Analysis, Insights and Forecast - by Distribution Channel
- 7.3.1. Supermarkets/Hypermarkets
- 7.3.2. Specialist Retailers
- 7.3.3. Convenience Stores
- 7.3.4. Online Retailers
- 7.3.5. Other Channels
- 7.4. Market Analysis, Insights and Forecast - by Geography
- 7.4.1. South Africa
- 7.4.2. Egypt
- 7.4.3. Rest of Africa
- 7.1. Market Analysis, Insights and Forecast - by Form
- 8. Egypt African Tea Industry Analysis, Insights and Forecast, 2020-2032
- 8.1. Market Analysis, Insights and Forecast - by Form
- 8.1.1. Leaf Tea
- 8.1.2. CTC Tea (Crushed, Teared, and Curled Tea)
- 8.2. Market Analysis, Insights and Forecast - by Product Type
- 8.2.1. Black Tea
- 8.2.2. Green Tea
- 8.2.3. Other Types (White and Oolong)
- 8.3. Market Analysis, Insights and Forecast - by Distribution Channel
- 8.3.1. Supermarkets/Hypermarkets
- 8.3.2. Specialist Retailers
- 8.3.3. Convenience Stores
- 8.3.4. Online Retailers
- 8.3.5. Other Channels
- 8.4. Market Analysis, Insights and Forecast - by Geography
- 8.4.1. South Africa
- 8.4.2. Egypt
- 8.4.3. Rest of Africa
- 8.1. Market Analysis, Insights and Forecast - by Form
- 9. Rest of Africa African Tea Industry Analysis, Insights and Forecast, 2020-2032
- 9.1. Market Analysis, Insights and Forecast - by Form
- 9.1.1. Leaf Tea
- 9.1.2. CTC Tea (Crushed, Teared, and Curled Tea)
- 9.2. Market Analysis, Insights and Forecast - by Product Type
- 9.2.1. Black Tea
- 9.2.2. Green Tea
- 9.2.3. Other Types (White and Oolong)
- 9.3. Market Analysis, Insights and Forecast - by Distribution Channel
- 9.3.1. Supermarkets/Hypermarkets
- 9.3.2. Specialist Retailers
- 9.3.3. Convenience Stores
- 9.3.4. Online Retailers
- 9.3.5. Other Channels
- 9.4. Market Analysis, Insights and Forecast - by Geography
- 9.4.1. South Africa
- 9.4.2. Egypt
- 9.4.3. Rest of Africa
- 9.1. Market Analysis, Insights and Forecast - by Form
- 10. Competitive Analysis
- 10.1. Company Profiles
- 10.1.1 Bigelow Tea
- 10.1.1.1. Company Overview
- 10.1.1.2. Products
- 10.1.1.3. Company Financials
- 10.1.1.4. SWOT Analysis
- 10.1.2 Twinings
- 10.1.2.1. Company Overview
- 10.1.2.2. Products
- 10.1.2.3. Company Financials
- 10.1.2.4. SWOT Analysis
- 10.1.3 Van Rees
- 10.1.3.1. Company Overview
- 10.1.3.2. Products
- 10.1.3.3. Company Financials
- 10.1.3.4. SWOT Analysis
- 10.1.4 Orientis Group (Kusmi Tea)*List Not Exhaustive
- 10.1.4.1. Company Overview
- 10.1.4.2. Products
- 10.1.4.3. Company Financials
- 10.1.4.4. SWOT Analysis
- 10.1.5 Unilever PLC
- 10.1.5.1. Company Overview
- 10.1.5.2. Products
- 10.1.5.3. Company Financials
- 10.1.5.4. SWOT Analysis
- 10.1.6 DavidsTea
- 10.1.6.1. Company Overview
- 10.1.6.2. Products
- 10.1.6.3. Company Financials
- 10.1.6.4. SWOT Analysis
- 10.1.7 Tata Global Beverages
- 10.1.7.1. Company Overview
- 10.1.7.2. Products
- 10.1.7.3. Company Financials
- 10.1.7.4. SWOT Analysis
- 10.1.8 Chebango Tea Company
- 10.1.8.1. Company Overview
- 10.1.8.2. Products
- 10.1.8.3. Company Financials
- 10.1.8.4. SWOT Analysis
- 10.1.9 Dilmah
- 10.1.9.1. Company Overview
- 10.1.9.2. Products
- 10.1.9.3. Company Financials
- 10.1.9.4. SWOT Analysis
- 10.1.10 Hain Celestial
- 10.1.10.1. Company Overview
- 10.1.10.2. Products
- 10.1.10.3. Company Financials
- 10.1.10.4. SWOT Analysis
- 10.1.1 Bigelow Tea
- 10.2. Market Entropy
- 10.2.1 Company's Key Areas Served
- 10.2.2 Recent Developments
- 10.3. Company Market Share Analysis 2025
- 10.3.1 Top 5 Companies Market Share Analysis
- 10.3.2 Top 3 Companies Market Share Analysis
- 10.4. List of Potential Customers
- 11. Research Methodology
List of Figures
- Figure 1: African Tea Industry Revenue Breakdown (billion, %) by Product 2025 & 2033
- Figure 2: African Tea Industry Share (%) by Company 2025
List of Tables
- Table 1: African Tea Industry Revenue billion Forecast, by Form 2020 & 2033
- Table 2: African Tea Industry Volume K Tons Forecast, by Form 2020 & 2033
- Table 3: African Tea Industry Revenue billion Forecast, by Product Type 2020 & 2033
- Table 4: African Tea Industry Volume K Tons Forecast, by Product Type 2020 & 2033
- Table 5: African Tea Industry Revenue billion Forecast, by Distribution Channel 2020 & 2033
- Table 6: African Tea Industry Volume K Tons Forecast, by Distribution Channel 2020 & 2033
- Table 7: African Tea Industry Revenue billion Forecast, by Geography 2020 & 2033
- Table 8: African Tea Industry Volume K Tons Forecast, by Geography 2020 & 2033
- Table 9: African Tea Industry Revenue billion Forecast, by Region 2020 & 2033
- Table 10: African Tea Industry Volume K Tons Forecast, by Region 2020 & 2033
- Table 11: African Tea Industry Revenue billion Forecast, by Form 2020 & 2033
- Table 12: African Tea Industry Volume K Tons Forecast, by Form 2020 & 2033
- Table 13: African Tea Industry Revenue billion Forecast, by Product Type 2020 & 2033
- Table 14: African Tea Industry Volume K Tons Forecast, by Product Type 2020 & 2033
- Table 15: African Tea Industry Revenue billion Forecast, by Distribution Channel 2020 & 2033
- Table 16: African Tea Industry Volume K Tons Forecast, by Distribution Channel 2020 & 2033
- Table 17: African Tea Industry Revenue billion Forecast, by Geography 2020 & 2033
- Table 18: African Tea Industry Volume K Tons Forecast, by Geography 2020 & 2033
- Table 19: African Tea Industry Revenue billion Forecast, by Country 2020 & 2033
- Table 20: African Tea Industry Volume K Tons Forecast, by Country 2020 & 2033
- Table 21: African Tea Industry Revenue billion Forecast, by Form 2020 & 2033
- Table 22: African Tea Industry Volume K Tons Forecast, by Form 2020 & 2033
- Table 23: African Tea Industry Revenue billion Forecast, by Product Type 2020 & 2033
- Table 24: African Tea Industry Volume K Tons Forecast, by Product Type 2020 & 2033
- Table 25: African Tea Industry Revenue billion Forecast, by Distribution Channel 2020 & 2033
- Table 26: African Tea Industry Volume K Tons Forecast, by Distribution Channel 2020 & 2033
- Table 27: African Tea Industry Revenue billion Forecast, by Geography 2020 & 2033
- Table 28: African Tea Industry Volume K Tons Forecast, by Geography 2020 & 2033
- Table 29: African Tea Industry Revenue billion Forecast, by Country 2020 & 2033
- Table 30: African Tea Industry Volume K Tons Forecast, by Country 2020 & 2033
- Table 31: African Tea Industry Revenue billion Forecast, by Form 2020 & 2033
- Table 32: African Tea Industry Volume K Tons Forecast, by Form 2020 & 2033
- Table 33: African Tea Industry Revenue billion Forecast, by Product Type 2020 & 2033
- Table 34: African Tea Industry Volume K Tons Forecast, by Product Type 2020 & 2033
- Table 35: African Tea Industry Revenue billion Forecast, by Distribution Channel 2020 & 2033
- Table 36: African Tea Industry Volume K Tons Forecast, by Distribution Channel 2020 & 2033
- Table 37: African Tea Industry Revenue billion Forecast, by Geography 2020 & 2033
- Table 38: African Tea Industry Volume K Tons Forecast, by Geography 2020 & 2033
- Table 39: African Tea Industry Revenue billion Forecast, by Country 2020 & 2033
- Table 40: African Tea Industry Volume K Tons Forecast, by Country 2020 & 2033
Frequently Asked Questions
1. What is the projected Compound Annual Growth Rate (CAGR) of the African Tea Industry?
The projected CAGR is approximately 7.7%.
2. Which companies are prominent players in the African Tea Industry?
Key companies in the market include Bigelow Tea, Twinings, Van Rees, Orientis Group (Kusmi Tea)*List Not Exhaustive, Unilever PLC, DavidsTea, Tata Global Beverages, Chebango Tea Company, Dilmah, Hain Celestial.
3. What are the main segments of the African Tea Industry?
The market segments include Form, Product Type, Distribution Channel, Geography.
4. Can you provide details about the market size?
The market size is estimated to be USD 4.01 billion as of 2022.
5. What are some drivers contributing to market growth?
Increasing Demand for Herbal Teas; Increasing Consumer Awareness about Health Benefits of Tea.
6. What are the notable trends driving market growth?
Increasing Tea Production in African Countries.
7. Are there any restraints impacting market growth?
High Cost of Production of Green Tea.
8. Can you provide examples of recent developments in the market?
N/A
9. What pricing options are available for accessing the report?
Pricing options include single-user, multi-user, and enterprise licenses priced at USD 4750, USD 5250, and USD 8750 respectively.
10. Is the market size provided in terms of value or volume?
The market size is provided in terms of value, measured in billion and volume, measured in K Tons.
11. Are there any specific market keywords associated with the report?
Yes, the market keyword associated with the report is "African Tea Industry," which aids in identifying and referencing the specific market segment covered.
12. How do I determine which pricing option suits my needs best?
The pricing options vary based on user requirements and access needs. Individual users may opt for single-user licenses, while businesses requiring broader access may choose multi-user or enterprise licenses for cost-effective access to the report.
13. Are there any additional resources or data provided in the African Tea Industry report?
While the report offers comprehensive insights, it's advisable to review the specific contents or supplementary materials provided to ascertain if additional resources or data are available.
14. How can I stay updated on further developments or reports in the African Tea Industry?
To stay informed about further developments, trends, and reports in the African Tea Industry, consider subscribing to industry newsletters, following relevant companies and organizations, or regularly checking reputable industry news sources and publications.
Methodology
Step 1 - Identification of Relevant Samples Size from Population Database


Step 2 - Approaches for Defining Global Market Size (Value, Volume* & Price*)

Note*: In applicable scenarios
Step 3 - Data Sources
Primary Research
- Web Analytics
- Survey Reports
- Research Institute
- Latest Research Reports
- Opinion Leaders
Secondary Research
- Annual Reports
- White Paper
- Latest Press Release
- Industry Association
- Paid Database
- Investor Presentations

Step 4 - Data Triangulation
Involves using different sources of information in order to increase the validity of a study
These sources are likely to be stakeholders in a program - participants, other researchers, program staff, other community members, and so on.
Then we put all data in single framework & apply various statistical tools to find out the dynamic on the market.
During the analysis stage, feedback from the stakeholder groups would be compared to determine areas of agreement as well as areas of divergence