

Key Insights
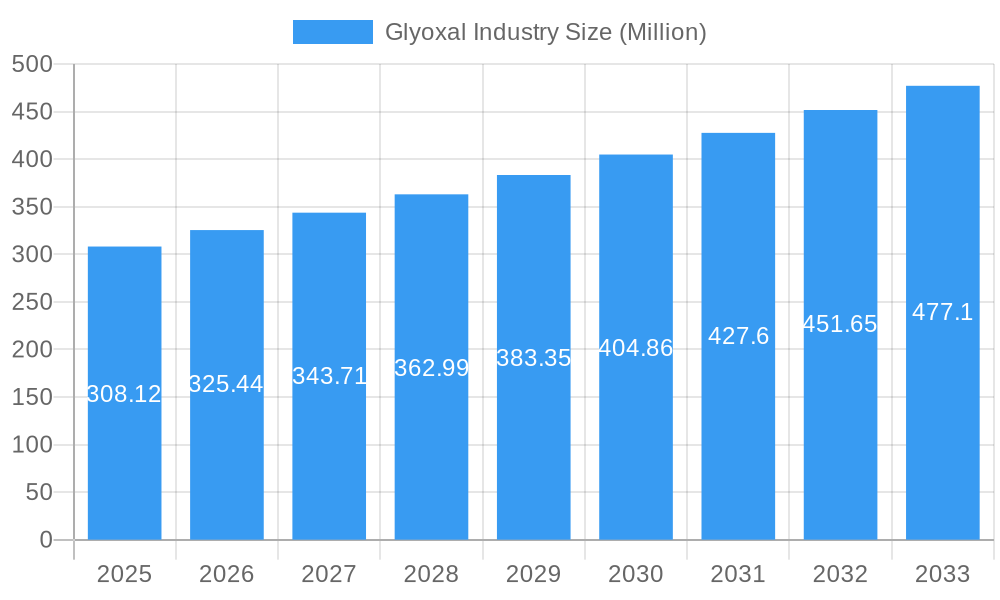
The global Glyoxal market is projected for significant expansion, forecast to reach 368.1 million by 2025, with a Compound Annual Growth Rate (CAGR) of 5.9% through 2033. This growth is driven by escalating demand across key sectors including adhesives & sealants, paints & coatings, and as a vital chemical intermediate. The textile industry utilizes glyoxal for enhanced fabric finishing and crease resistance, while its application in oil and gas, particularly hydraulic fracturing fluids, further bolsters market performance. Continuous innovation in glyoxal derivatives and production methods is enhancing its value proposition and cost-efficiency across industries.
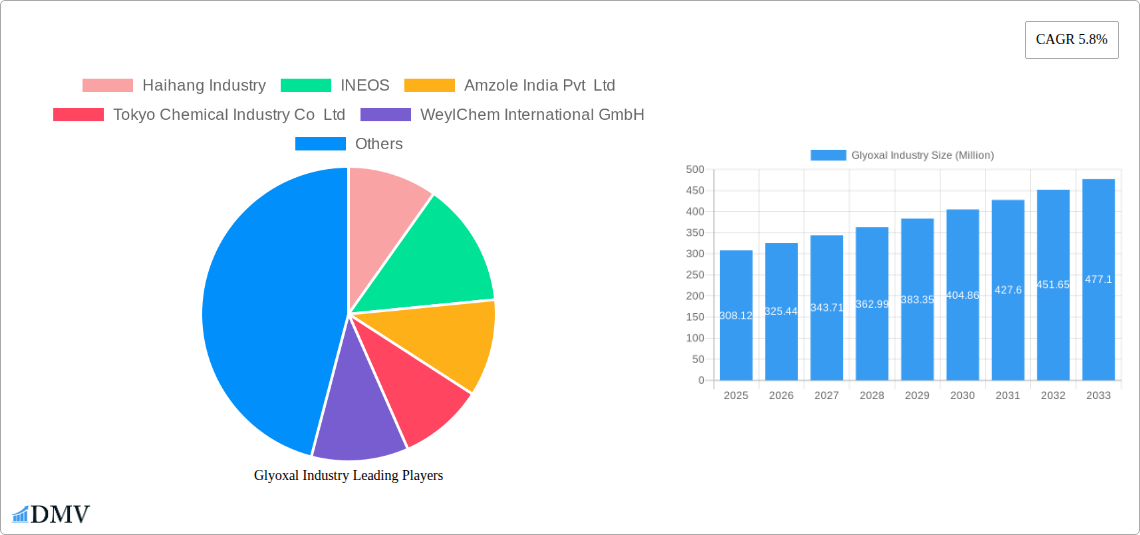
Glyoxal Industry Market Size (In Million)
Geographically, the Asia Pacific region, spearheaded by China and India, is expected to lead market growth, fueled by rapid industrialization and expanding manufacturing capabilities. North America and Europe remain substantial markets with robust chemical sectors and consistent application-based demand. Key market players, including BASF SE, INEOS, and Tokyo Chemical Industry Co Ltd, are actively investing in R&D and production capacity expansion to meet global demand. Market participants must navigate potential challenges such as fluctuating raw material costs and evolving environmental regulations to maintain a competitive edge and ensure sustainable development.
Glyoxal Industry Company Market Share
Glyoxal Industry Market Analysis: Trends, Forecast & Opportunities (2019-2033)
This comprehensive report provides an in-depth analysis of the global Glyoxal industry, offering critical insights for stakeholders navigating this dynamic market. Covering the study period of 2019–2033, with a base year of 2025 and an estimated year of 2025, this report delves into historical trends, current market dynamics, and future projections. The forecast period extends from 2025 to 2033, building upon the historical period of 2019–2024. Gain a strategic advantage with detailed market composition, industry evolution, regional dominance, product innovations, growth drivers, potential obstacles, emerging opportunities, key player profiles, and significant industry developments.
Glyoxal Industry Market Composition & Trends
The global Glyoxal market exhibits a moderate to high degree of concentration, with key players investing significantly in R&D to drive innovation and differentiate their product offerings. Innovation catalysts include the development of novel glyoxal derivatives with enhanced performance characteristics and wider application ranges, particularly in high-growth sectors. The regulatory landscape, while evolving, generally favors the safe and responsible production and use of glyoxal, with a growing emphasis on environmental sustainability. Substitute products, though present in certain niche applications, struggle to replicate the cost-effectiveness and broad efficacy of glyoxal in its primary uses. End-user profiles span diverse industries, from textiles and paints to oil and gas, each with unique quality and performance demands. Mergers and acquisitions (M&A) activities are anticipated to remain a strategic tool for market consolidation and expansion, with estimated M&A deal values potentially reaching XX Million in the coming years. Market share distribution is expected to see slight shifts as new entrants and established players vie for dominance.
Glyoxal Industry Industry Evolution
The Glyoxal industry has undergone significant evolution, characterized by a consistent growth trajectory driven by escalating demand across a multitude of industrial applications. Over the historical period of 2019–2024, the market witnessed a Compound Annual Growth Rate (CAGR) of approximately XX%, a trend projected to continue into the forecast period of 2025–2033. Technological advancements have been pivotal in shaping this evolution. Innovations in glyoxal synthesis processes have led to improved purity, reduced production costs, and enhanced environmental profiles, making glyoxal a more attractive and sustainable chemical intermediate. For instance, advancements in catalytic processes have allowed for higher yields and lower energy consumption in manufacturing. Furthermore, the development of specialized glyoxal formulations tailored for specific end-use industries has broadened its applicability and deepened its market penetration. Shifting consumer demands, particularly the growing preference for eco-friendly and high-performance materials in sectors like textiles and coatings, have further propelled the adoption of glyoxal-based solutions. The increasing awareness of glyoxal's efficacy as a cross-linking agent and its role in improving the durability and performance of various products have cemented its position as a vital industrial chemical. The market has adapted to these changes by investing in research and development to create solutions that meet the stringent requirements of modern manufacturing and sustainability goals, with adoption metrics for advanced glyoxal applications projected to rise by XX% by 2030.
Leading Regions, Countries, or Segments in Glyoxal Industry
The Textile segment consistently emerges as a dominant force within the Glyoxal industry, driven by a confluence of key factors that underscore its critical role in fabric finishing and processing. Investment trends within the textile manufacturing hubs, particularly in Asia, are robust, fueled by increasing domestic consumption and export demands. Regulatory support for eco-friendly textile production, which often leverages glyoxal-based solutions for formaldehyde-free finishing, further amplifies its adoption.
- Key Drivers in the Textile Segment:
- Formaldehyde Replacement: Glyoxal's ability to act as an effective cross-linking agent for cellulose fibers, offering wrinkle resistance and dimensional stability without the harmful effects of formaldehyde, is a major catalyst.
- Performance Enhancement: It significantly improves crease recovery, durability, and dye fixation in textiles, leading to higher quality and longer-lasting fabrics.
- Growing Apparel Market: The expanding global apparel market, especially in emerging economies, directly translates to increased demand for textile processing chemicals.
- Sustainable Manufacturing Initiatives: The push for greener manufacturing processes aligns perfectly with glyoxal's potential to reduce environmental impact compared to traditional alternatives.
In-depth analysis reveals that the dominance of the textile segment is also a reflection of the broader economic landscape. The continuous expansion of the global apparel industry, coupled with a rising consumer preference for high-quality, durable, and sustainably produced textiles, creates a perpetual demand for glyoxal. Countries with strong textile manufacturing bases, such as China, India, and Bangladesh, are therefore key consumers and drivers of the glyoxal market within this segment. The Paints and Coatings segment also presents significant growth, particularly with the demand for low-VOC (Volatile Organic Compound) formulations where glyoxal plays a role in enhancing film properties and durability. While Adhesives and Sealants represent a steady application, and Oil and Gas Exploration shows cyclical demand, the sheer volume and consistent requirement for performance enhancements in textiles solidify its leading position.
Glyoxal Industry Product Innovations
Product innovations in the Glyoxal industry are focused on enhancing performance and expanding applications. Novel glyoxal derivatives are being developed with improved cross-linking efficiency and reduced environmental impact. For instance, microencapsulated glyoxal formulations offer controlled release properties, leading to prolonged efficacy in applications like textile finishing and wood treatment. Furthermore, research into bio-based glyoxal production methods is gaining traction, aiming to provide a more sustainable alternative to petrochemical-derived glyoxal. These advancements are crucial for meeting the growing demand for high-performance, eco-friendly chemical solutions.
Propelling Factors for Glyoxal Industry Growth
The Glyoxal industry's growth is propelled by several key factors. Technologically, advancements in synthesis processes leading to higher purity and cost-effectiveness are significant. Economically, the expanding textile industry, burgeoning paints and coatings sector, and the sustained demand for adhesives and sealants globally provide a robust market base. Regulatory influences, particularly the increasing drive for formaldehyde-free alternatives in textiles and consumer goods, directly favor glyoxal adoption. The overall market growth is projected to be around XX% from 2025 to 2033, driven by these multifaceted influences.
Obstacles in the Glyoxal Industry Market
Despite its growth, the Glyoxal industry faces certain obstacles. Stringent environmental regulations in some regions regarding chemical production and handling can increase operational costs. Supply chain disruptions, exacerbated by geopolitical events and raw material price volatility, can impact availability and pricing. Intense competitive pressures from both established players and emerging regional manufacturers can lead to price wars and pressure on profit margins. Furthermore, the perception of glyoxal as a hazardous chemical in certain applications, despite its benefits when handled correctly, can pose a restraint to market penetration in sensitive sectors.
Future Opportunities in Glyoxal Industry
Emerging opportunities in the Glyoxal industry are abundant. The increasing focus on sustainable and bio-based chemicals presents a significant avenue for growth, with research into bio-derived glyoxal production poised to capture new market segments. Expansion into developing economies with rapidly growing industrial bases, particularly in Asia and Africa, offers substantial untapped potential. The development of advanced glyoxal formulations for niche applications in electronics, water treatment, and pharmaceuticals could open up high-value markets. Consumer trends favoring eco-friendly and durable products will continue to drive demand for glyoxal-based solutions.
Major Players in the Glyoxal Industry Ecosystem
- Haihang Industry
- INEOS
- Amzole India Pvt Ltd
- Tokyo Chemical Industry Co Ltd
- WeylChem International GmbH
- BASF SE
- Hubei Hongyuan Pharmaceutical Technology Co Ltd
- Toronto Research Chemicals
- Zhonglan Industry Co Ltd
- Thermo Fisher Scientific
Key Developments in Glyoxal Industry Industry
- 2024 (Q3): BASF SE launched a new eco-friendly glyoxal-based textile finishing agent, enhancing durability and reducing environmental impact.
- 2023 (Q4): INEOS acquired a specialty chemicals plant, potentially increasing its glyoxal production capacity by XX Million metric tons.
- 2023 (Q2): Amzole India Pvt Ltd announced plans to expand its glyoxal manufacturing facility to meet growing domestic demand in India.
- 2022 (Q4): WeylChem International GmbH introduced a novel glyoxal derivative for enhanced performance in industrial coatings, reporting XX% improvement in scratch resistance.
- 2022 (Q1): Tokyo Chemical Industry Co Ltd reported a XX% increase in R&D expenditure focused on sustainable glyoxal production methods.
Strategic Glyoxal Industry Market Forecast
The strategic Glyoxal industry market forecast indicates a robust and upward trajectory. Growth catalysts include the sustained global demand from the textile, paints, and coatings sectors, coupled with the increasing preference for eco-friendly alternatives to traditional chemicals like formaldehyde. Emerging opportunities in bio-based glyoxal production and expansion into developing markets will further fuel this growth. The market is expected to witness steady expansion driven by technological advancements in production efficiency and the development of specialized glyoxal applications, positioning it for significant value creation in the coming decade.
Glyoxal Industry Segmentation
-
1. Application
- 1.1. Adhesives and Sealants
- 1.2. Intermediates
- 1.3. Oil and Gas Exploration
- 1.4. Paints and Coatings
- 1.5. Textile
- 1.6. Other Applications
Glyoxal Industry Segmentation By Geography
-
1. Asia Pacific
- 1.1. China
- 1.2. India
- 1.3. Japan
- 1.4. South Korea
- 1.5. Rest of Asia Pacific
-
2. North America
- 2.1. United States
- 2.2. Canada
- 2.3. Mexico
-
3. Europe
- 3.1. Germany
- 3.2. United Kingdom
- 3.3. Italy
- 3.4. France
- 3.5. Rest of Europe
-
4. South America
- 4.1. Brazil
- 4.2. Argentina
- 4.3. Rest of South America
- 5. Middle East
-
6. Saudi Arabia
- 6.1. South Africa
- 6.2. Rest of Middle East
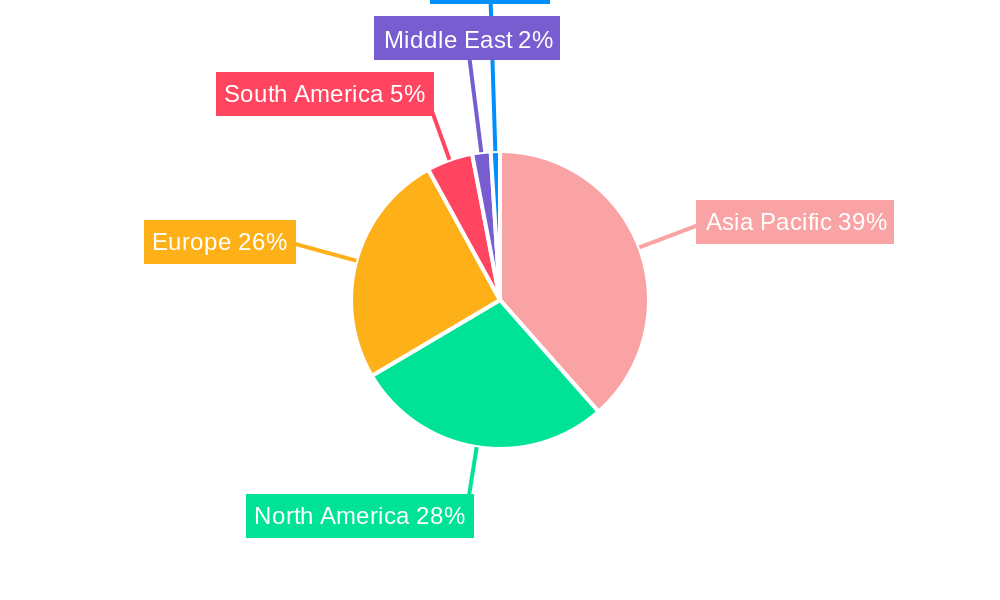
Glyoxal Industry Regional Market Share
Geographic Coverage of Glyoxal Industry
Glyoxal Industry REPORT HIGHLIGHTS
| Aspects | Details |
|---|---|
| Study Period | 2020-2034 |
| Base Year | 2025 |
| Estimated Year | 2026 |
| Forecast Period | 2026-2034 |
| Historical Period | 2020-2025 |
| Growth Rate | CAGR of 5.9% from 2020-2034 |
| Segmentation |
|
Table of Contents
- 1. Introduction
- 1.1. Research Scope
- 1.2. Market Segmentation
- 1.3. Research Objective
- 1.4. Definitions and Assumptions
- 2. Executive Summary
- 2.1. Market Snapshot
- 3. Market Dynamics
- 3.1. Market Drivers
- 3.2. Market Restrains
- 3.3. Market Trends
- 3.4. Market Opportunities
- 4. Market Factor Analysis
- 4.1. Porters Five Forces
- 4.1.1. Bargaining Power of Suppliers
- 4.1.2. Bargaining Power of Buyers
- 4.1.3. Threat of New Entrants
- 4.1.4. Threat of Substitutes
- 4.1.5. Competitive Rivalry
- 4.2. PESTEL analysis
- 4.3. BCG Analysis
- 4.3.1. Stars (High Growth, High Market Share)
- 4.3.2. Cash Cows (Low Growth, High Market Share)
- 4.3.3. Question Mark (High Growth, Low Market Share)
- 4.3.4. Dogs (Low Growth, Low Market Share)
- 4.4. Ansoff Matrix Analysis
- 4.5. Supply Chain Analysis
- 4.6. Regulatory Landscape
- 4.7. Current Market Potential and Opportunity Assessment (TAM–SAM–SOM Framework)
- 4.8. DMV Analyst Note
- 4.1. Porters Five Forces
- 5. Market Analysis, Insights and Forecast 2021-2033
- 5.1. Market Analysis, Insights and Forecast - by Application
- 5.1.1. Adhesives and Sealants
- 5.1.2. Intermediates
- 5.1.3. Oil and Gas Exploration
- 5.1.4. Paints and Coatings
- 5.1.5. Textile
- 5.1.6. Other Applications
- 5.2. Market Analysis, Insights and Forecast - by Region
- 5.2.1. Asia Pacific
- 5.2.2. North America
- 5.2.3. Europe
- 5.2.4. South America
- 5.2.5. Middle East
- 5.2.6. Saudi Arabia
- 5.1. Market Analysis, Insights and Forecast - by Application
- 6. Global Glyoxal Industry Analysis, Insights and Forecast, 2021-2033
- 6.1. Market Analysis, Insights and Forecast - by Application
- 6.1.1. Adhesives and Sealants
- 6.1.2. Intermediates
- 6.1.3. Oil and Gas Exploration
- 6.1.4. Paints and Coatings
- 6.1.5. Textile
- 6.1.6. Other Applications
- 6.1. Market Analysis, Insights and Forecast - by Application
- 7. Asia Pacific Glyoxal Industry Analysis, Insights and Forecast, 2020-2032
- 7.1. Market Analysis, Insights and Forecast - by Application
- 7.1.1. Adhesives and Sealants
- 7.1.2. Intermediates
- 7.1.3. Oil and Gas Exploration
- 7.1.4. Paints and Coatings
- 7.1.5. Textile
- 7.1.6. Other Applications
- 7.1. Market Analysis, Insights and Forecast - by Application
- 8. North America Glyoxal Industry Analysis, Insights and Forecast, 2020-2032
- 8.1. Market Analysis, Insights and Forecast - by Application
- 8.1.1. Adhesives and Sealants
- 8.1.2. Intermediates
- 8.1.3. Oil and Gas Exploration
- 8.1.4. Paints and Coatings
- 8.1.5. Textile
- 8.1.6. Other Applications
- 8.1. Market Analysis, Insights and Forecast - by Application
- 9. Europe Glyoxal Industry Analysis, Insights and Forecast, 2020-2032
- 9.1. Market Analysis, Insights and Forecast - by Application
- 9.1.1. Adhesives and Sealants
- 9.1.2. Intermediates
- 9.1.3. Oil and Gas Exploration
- 9.1.4. Paints and Coatings
- 9.1.5. Textile
- 9.1.6. Other Applications
- 9.1. Market Analysis, Insights and Forecast - by Application
- 10. South America Glyoxal Industry Analysis, Insights and Forecast, 2020-2032
- 10.1. Market Analysis, Insights and Forecast - by Application
- 10.1.1. Adhesives and Sealants
- 10.1.2. Intermediates
- 10.1.3. Oil and Gas Exploration
- 10.1.4. Paints and Coatings
- 10.1.5. Textile
- 10.1.6. Other Applications
- 10.1. Market Analysis, Insights and Forecast - by Application
- 11. Middle East Glyoxal Industry Analysis, Insights and Forecast, 2020-2032
- 11.1. Market Analysis, Insights and Forecast - by Application
- 11.1.1. Adhesives and Sealants
- 11.1.2. Intermediates
- 11.1.3. Oil and Gas Exploration
- 11.1.4. Paints and Coatings
- 11.1.5. Textile
- 11.1.6. Other Applications
- 11.1. Market Analysis, Insights and Forecast - by Application
- 12. Saudi Arabia Glyoxal Industry Analysis, Insights and Forecast, 2020-2032
- 12.1. Market Analysis, Insights and Forecast - by Application
- 12.1.1. Adhesives and Sealants
- 12.1.2. Intermediates
- 12.1.3. Oil and Gas Exploration
- 12.1.4. Paints and Coatings
- 12.1.5. Textile
- 12.1.6. Other Applications
- 12.1. Market Analysis, Insights and Forecast - by Application
- 13. Competitive Analysis
- 13.1. Company Profiles
- 13.1.1 Haihang Industry
- 13.1.1.1. Company Overview
- 13.1.1.2. Products
- 13.1.1.3. Company Financials
- 13.1.1.4. SWOT Analysis
- 13.1.2 INEOS
- 13.1.2.1. Company Overview
- 13.1.2.2. Products
- 13.1.2.3. Company Financials
- 13.1.2.4. SWOT Analysis
- 13.1.3 Amzole India Pvt Ltd
- 13.1.3.1. Company Overview
- 13.1.3.2. Products
- 13.1.3.3. Company Financials
- 13.1.3.4. SWOT Analysis
- 13.1.4 Tokyo Chemical Industry Co Ltd
- 13.1.4.1. Company Overview
- 13.1.4.2. Products
- 13.1.4.3. Company Financials
- 13.1.4.4. SWOT Analysis
- 13.1.5 WeylChem International GmbH
- 13.1.5.1. Company Overview
- 13.1.5.2. Products
- 13.1.5.3. Company Financials
- 13.1.5.4. SWOT Analysis
- 13.1.6 BASF SE
- 13.1.6.1. Company Overview
- 13.1.6.2. Products
- 13.1.6.3. Company Financials
- 13.1.6.4. SWOT Analysis
- 13.1.7 Hubei Hongyuan Pharmaceutical Technology Co Ltd
- 13.1.7.1. Company Overview
- 13.1.7.2. Products
- 13.1.7.3. Company Financials
- 13.1.7.4. SWOT Analysis
- 13.1.8 Toronto Research Chemicals
- 13.1.8.1. Company Overview
- 13.1.8.2. Products
- 13.1.8.3. Company Financials
- 13.1.8.4. SWOT Analysis
- 13.1.9 Zhonglan Industry Co Ltd
- 13.1.9.1. Company Overview
- 13.1.9.2. Products
- 13.1.9.3. Company Financials
- 13.1.9.4. SWOT Analysis
- 13.1.10 Thermo Fisher Scientific
- 13.1.10.1. Company Overview
- 13.1.10.2. Products
- 13.1.10.3. Company Financials
- 13.1.10.4. SWOT Analysis
- 13.1.1 Haihang Industry
- 13.2. Market Entropy
- 13.2.1 Company's Key Areas Served
- 13.2.2 Recent Developments
- 13.3. Company Market Share Analysis 2025
- 13.3.1 Top 5 Companies Market Share Analysis
- 13.3.2 Top 3 Companies Market Share Analysis
- 13.4. List of Potential Customers
- 14. Research Methodology
List of Figures
- Figure 1: Global Glyoxal Industry Revenue Breakdown (million, %) by Region 2025 & 2033
- Figure 2: Global Glyoxal Industry Volume Breakdown (K Tons, %) by Region 2025 & 2033
- Figure 3: Asia Pacific Glyoxal Industry Revenue (million), by Application 2025 & 2033
- Figure 4: Asia Pacific Glyoxal Industry Volume (K Tons), by Application 2025 & 2033
- Figure 5: Asia Pacific Glyoxal Industry Revenue Share (%), by Application 2025 & 2033
- Figure 6: Asia Pacific Glyoxal Industry Volume Share (%), by Application 2025 & 2033
- Figure 7: Asia Pacific Glyoxal Industry Revenue (million), by Country 2025 & 2033
- Figure 8: Asia Pacific Glyoxal Industry Volume (K Tons), by Country 2025 & 2033
- Figure 9: Asia Pacific Glyoxal Industry Revenue Share (%), by Country 2025 & 2033
- Figure 10: Asia Pacific Glyoxal Industry Volume Share (%), by Country 2025 & 2033
- Figure 11: North America Glyoxal Industry Revenue (million), by Application 2025 & 2033
- Figure 12: North America Glyoxal Industry Volume (K Tons), by Application 2025 & 2033
- Figure 13: North America Glyoxal Industry Revenue Share (%), by Application 2025 & 2033
- Figure 14: North America Glyoxal Industry Volume Share (%), by Application 2025 & 2033
- Figure 15: North America Glyoxal Industry Revenue (million), by Country 2025 & 2033
- Figure 16: North America Glyoxal Industry Volume (K Tons), by Country 2025 & 2033
- Figure 17: North America Glyoxal Industry Revenue Share (%), by Country 2025 & 2033
- Figure 18: North America Glyoxal Industry Volume Share (%), by Country 2025 & 2033
- Figure 19: Europe Glyoxal Industry Revenue (million), by Application 2025 & 2033
- Figure 20: Europe Glyoxal Industry Volume (K Tons), by Application 2025 & 2033
- Figure 21: Europe Glyoxal Industry Revenue Share (%), by Application 2025 & 2033
- Figure 22: Europe Glyoxal Industry Volume Share (%), by Application 2025 & 2033
- Figure 23: Europe Glyoxal Industry Revenue (million), by Country 2025 & 2033
- Figure 24: Europe Glyoxal Industry Volume (K Tons), by Country 2025 & 2033
- Figure 25: Europe Glyoxal Industry Revenue Share (%), by Country 2025 & 2033
- Figure 26: Europe Glyoxal Industry Volume Share (%), by Country 2025 & 2033
- Figure 27: South America Glyoxal Industry Revenue (million), by Application 2025 & 2033
- Figure 28: South America Glyoxal Industry Volume (K Tons), by Application 2025 & 2033
- Figure 29: South America Glyoxal Industry Revenue Share (%), by Application 2025 & 2033
- Figure 30: South America Glyoxal Industry Volume Share (%), by Application 2025 & 2033
- Figure 31: South America Glyoxal Industry Revenue (million), by Country 2025 & 2033
- Figure 32: South America Glyoxal Industry Volume (K Tons), by Country 2025 & 2033
- Figure 33: South America Glyoxal Industry Revenue Share (%), by Country 2025 & 2033
- Figure 34: South America Glyoxal Industry Volume Share (%), by Country 2025 & 2033
- Figure 35: Middle East Glyoxal Industry Revenue (million), by Application 2025 & 2033
- Figure 36: Middle East Glyoxal Industry Volume (K Tons), by Application 2025 & 2033
- Figure 37: Middle East Glyoxal Industry Revenue Share (%), by Application 2025 & 2033
- Figure 38: Middle East Glyoxal Industry Volume Share (%), by Application 2025 & 2033
- Figure 39: Middle East Glyoxal Industry Revenue (million), by Country 2025 & 2033
- Figure 40: Middle East Glyoxal Industry Volume (K Tons), by Country 2025 & 2033
- Figure 41: Middle East Glyoxal Industry Revenue Share (%), by Country 2025 & 2033
- Figure 42: Middle East Glyoxal Industry Volume Share (%), by Country 2025 & 2033
- Figure 43: Saudi Arabia Glyoxal Industry Revenue (million), by Application 2025 & 2033
- Figure 44: Saudi Arabia Glyoxal Industry Volume (K Tons), by Application 2025 & 2033
- Figure 45: Saudi Arabia Glyoxal Industry Revenue Share (%), by Application 2025 & 2033
- Figure 46: Saudi Arabia Glyoxal Industry Volume Share (%), by Application 2025 & 2033
- Figure 47: Saudi Arabia Glyoxal Industry Revenue (million), by Country 2025 & 2033
- Figure 48: Saudi Arabia Glyoxal Industry Volume (K Tons), by Country 2025 & 2033
- Figure 49: Saudi Arabia Glyoxal Industry Revenue Share (%), by Country 2025 & 2033
- Figure 50: Saudi Arabia Glyoxal Industry Volume Share (%), by Country 2025 & 2033
List of Tables
- Table 1: Global Glyoxal Industry Revenue million Forecast, by Application 2020 & 2033
- Table 2: Global Glyoxal Industry Volume K Tons Forecast, by Application 2020 & 2033
- Table 3: Global Glyoxal Industry Revenue million Forecast, by Region 2020 & 2033
- Table 4: Global Glyoxal Industry Volume K Tons Forecast, by Region 2020 & 2033
- Table 5: Global Glyoxal Industry Revenue million Forecast, by Application 2020 & 2033
- Table 6: Global Glyoxal Industry Volume K Tons Forecast, by Application 2020 & 2033
- Table 7: Global Glyoxal Industry Revenue million Forecast, by Country 2020 & 2033
- Table 8: Global Glyoxal Industry Volume K Tons Forecast, by Country 2020 & 2033
- Table 9: China Glyoxal Industry Revenue (million) Forecast, by Application 2020 & 2033
- Table 10: China Glyoxal Industry Volume (K Tons) Forecast, by Application 2020 & 2033
- Table 11: India Glyoxal Industry Revenue (million) Forecast, by Application 2020 & 2033
- Table 12: India Glyoxal Industry Volume (K Tons) Forecast, by Application 2020 & 2033
- Table 13: Japan Glyoxal Industry Revenue (million) Forecast, by Application 2020 & 2033
- Table 14: Japan Glyoxal Industry Volume (K Tons) Forecast, by Application 2020 & 2033
- Table 15: South Korea Glyoxal Industry Revenue (million) Forecast, by Application 2020 & 2033
- Table 16: South Korea Glyoxal Industry Volume (K Tons) Forecast, by Application 2020 & 2033
- Table 17: Rest of Asia Pacific Glyoxal Industry Revenue (million) Forecast, by Application 2020 & 2033
- Table 18: Rest of Asia Pacific Glyoxal Industry Volume (K Tons) Forecast, by Application 2020 & 2033
- Table 19: Global Glyoxal Industry Revenue million Forecast, by Application 2020 & 2033
- Table 20: Global Glyoxal Industry Volume K Tons Forecast, by Application 2020 & 2033
- Table 21: Global Glyoxal Industry Revenue million Forecast, by Country 2020 & 2033
- Table 22: Global Glyoxal Industry Volume K Tons Forecast, by Country 2020 & 2033
- Table 23: United States Glyoxal Industry Revenue (million) Forecast, by Application 2020 & 2033
- Table 24: United States Glyoxal Industry Volume (K Tons) Forecast, by Application 2020 & 2033
- Table 25: Canada Glyoxal Industry Revenue (million) Forecast, by Application 2020 & 2033
- Table 26: Canada Glyoxal Industry Volume (K Tons) Forecast, by Application 2020 & 2033
- Table 27: Mexico Glyoxal Industry Revenue (million) Forecast, by Application 2020 & 2033
- Table 28: Mexico Glyoxal Industry Volume (K Tons) Forecast, by Application 2020 & 2033
- Table 29: Global Glyoxal Industry Revenue million Forecast, by Application 2020 & 2033
- Table 30: Global Glyoxal Industry Volume K Tons Forecast, by Application 2020 & 2033
- Table 31: Global Glyoxal Industry Revenue million Forecast, by Country 2020 & 2033
- Table 32: Global Glyoxal Industry Volume K Tons Forecast, by Country 2020 & 2033
- Table 33: Germany Glyoxal Industry Revenue (million) Forecast, by Application 2020 & 2033
- Table 34: Germany Glyoxal Industry Volume (K Tons) Forecast, by Application 2020 & 2033
- Table 35: United Kingdom Glyoxal Industry Revenue (million) Forecast, by Application 2020 & 2033
- Table 36: United Kingdom Glyoxal Industry Volume (K Tons) Forecast, by Application 2020 & 2033
- Table 37: Italy Glyoxal Industry Revenue (million) Forecast, by Application 2020 & 2033
- Table 38: Italy Glyoxal Industry Volume (K Tons) Forecast, by Application 2020 & 2033
- Table 39: France Glyoxal Industry Revenue (million) Forecast, by Application 2020 & 2033
- Table 40: France Glyoxal Industry Volume (K Tons) Forecast, by Application 2020 & 2033
- Table 41: Rest of Europe Glyoxal Industry Revenue (million) Forecast, by Application 2020 & 2033
- Table 42: Rest of Europe Glyoxal Industry Volume (K Tons) Forecast, by Application 2020 & 2033
- Table 43: Global Glyoxal Industry Revenue million Forecast, by Application 2020 & 2033
- Table 44: Global Glyoxal Industry Volume K Tons Forecast, by Application 2020 & 2033
- Table 45: Global Glyoxal Industry Revenue million Forecast, by Country 2020 & 2033
- Table 46: Global Glyoxal Industry Volume K Tons Forecast, by Country 2020 & 2033
- Table 47: Brazil Glyoxal Industry Revenue (million) Forecast, by Application 2020 & 2033
- Table 48: Brazil Glyoxal Industry Volume (K Tons) Forecast, by Application 2020 & 2033
- Table 49: Argentina Glyoxal Industry Revenue (million) Forecast, by Application 2020 & 2033
- Table 50: Argentina Glyoxal Industry Volume (K Tons) Forecast, by Application 2020 & 2033
- Table 51: Rest of South America Glyoxal Industry Revenue (million) Forecast, by Application 2020 & 2033
- Table 52: Rest of South America Glyoxal Industry Volume (K Tons) Forecast, by Application 2020 & 2033
- Table 53: Global Glyoxal Industry Revenue million Forecast, by Application 2020 & 2033
- Table 54: Global Glyoxal Industry Volume K Tons Forecast, by Application 2020 & 2033
- Table 55: Global Glyoxal Industry Revenue million Forecast, by Country 2020 & 2033
- Table 56: Global Glyoxal Industry Volume K Tons Forecast, by Country 2020 & 2033
- Table 57: Global Glyoxal Industry Revenue million Forecast, by Application 2020 & 2033
- Table 58: Global Glyoxal Industry Volume K Tons Forecast, by Application 2020 & 2033
- Table 59: Global Glyoxal Industry Revenue million Forecast, by Country 2020 & 2033
- Table 60: Global Glyoxal Industry Volume K Tons Forecast, by Country 2020 & 2033
- Table 61: South Africa Glyoxal Industry Revenue (million) Forecast, by Application 2020 & 2033
- Table 62: South Africa Glyoxal Industry Volume (K Tons) Forecast, by Application 2020 & 2033
- Table 63: Rest of Middle East Glyoxal Industry Revenue (million) Forecast, by Application 2020 & 2033
- Table 64: Rest of Middle East Glyoxal Industry Volume (K Tons) Forecast, by Application 2020 & 2033
Frequently Asked Questions
1. What is the projected Compound Annual Growth Rate (CAGR) of the Glyoxal Industry?
The projected CAGR is approximately 5.9%.
2. Which companies are prominent players in the Glyoxal Industry?
Key companies in the market include Haihang Industry, INEOS, Amzole India Pvt Ltd, Tokyo Chemical Industry Co Ltd, WeylChem International GmbH, BASF SE, Hubei Hongyuan Pharmaceutical Technology Co Ltd, Toronto Research Chemicals, Zhonglan Industry Co Ltd, Thermo Fisher Scientific.
3. What are the main segments of the Glyoxal Industry?
The market segments include Application.
4. Can you provide details about the market size?
The market size is estimated to be USD 368.1 million as of 2022.
5. What are some drivers contributing to market growth?
; Increasing Applications of Glyoxal in Fabrics; Growing Demand for Glyoxal as an Intermediate.
6. What are the notable trends driving market growth?
Increasing Demand for Glyoxal as an Intermediate and Crosslinkers.
7. Are there any restraints impacting market growth?
; Associated Health Issues; Unfavorable Conditions Arising due to the Impact of COVID-19; Other Restraints.
8. Can you provide examples of recent developments in the market?
N/A
9. What pricing options are available for accessing the report?
Pricing options include single-user, multi-user, and enterprise licenses priced at USD 4750, USD 5250, and USD 8750 respectively.
10. Is the market size provided in terms of value or volume?
The market size is provided in terms of value, measured in million and volume, measured in K Tons.
11. Are there any specific market keywords associated with the report?
Yes, the market keyword associated with the report is "Glyoxal Industry," which aids in identifying and referencing the specific market segment covered.
12. How do I determine which pricing option suits my needs best?
The pricing options vary based on user requirements and access needs. Individual users may opt for single-user licenses, while businesses requiring broader access may choose multi-user or enterprise licenses for cost-effective access to the report.
13. Are there any additional resources or data provided in the Glyoxal Industry report?
While the report offers comprehensive insights, it's advisable to review the specific contents or supplementary materials provided to ascertain if additional resources or data are available.
14. How can I stay updated on further developments or reports in the Glyoxal Industry?
To stay informed about further developments, trends, and reports in the Glyoxal Industry, consider subscribing to industry newsletters, following relevant companies and organizations, or regularly checking reputable industry news sources and publications.
Methodology
Step 1 - Identification of Relevant Samples Size from Population Database


Step 2 - Approaches for Defining Global Market Size (Value, Volume* & Price*)

Note*: In applicable scenarios
Step 3 - Data Sources
Primary Research
- Web Analytics
- Survey Reports
- Research Institute
- Latest Research Reports
- Opinion Leaders
Secondary Research
- Annual Reports
- White Paper
- Latest Press Release
- Industry Association
- Paid Database
- Investor Presentations

Step 4 - Data Triangulation
Involves using different sources of information in order to increase the validity of a study
These sources are likely to be stakeholders in a program - participants, other researchers, program staff, other community members, and so on.
Then we put all data in single framework & apply various statistical tools to find out the dynamic on the market.
During the analysis stage, feedback from the stakeholder groups would be compared to determine areas of agreement as well as areas of divergence