

Key Insights
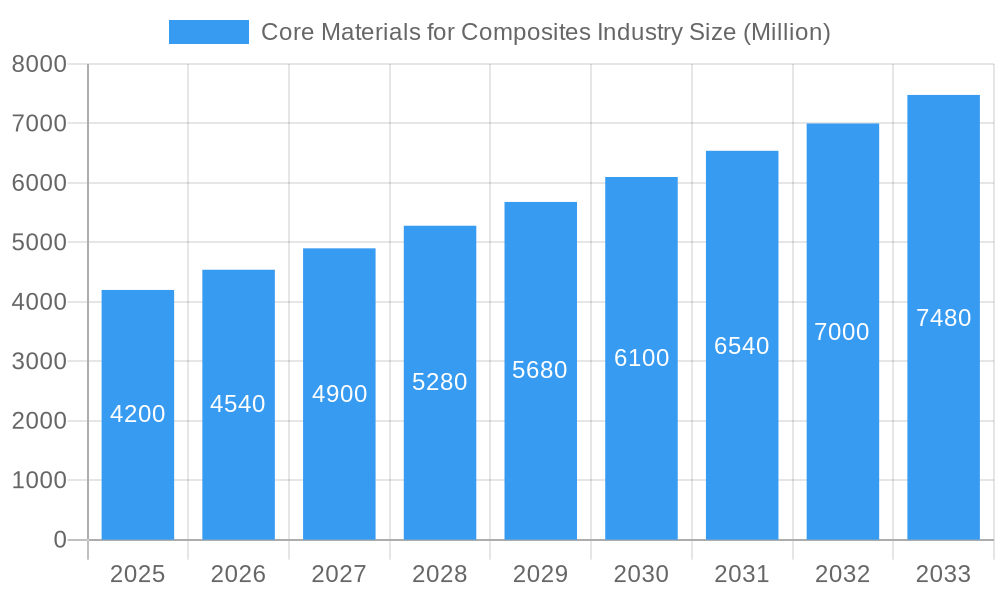
The global Core Materials for Composites market is projected for significant expansion, anticipated to reach USD 7.16 billion by 2025, with a robust Compound Annual Growth Rate (CAGR) of 9.29% during the 2025-2033 forecast period. This growth is driven by the increasing demand for lightweight, high-strength, and durable materials across key industries. Aerospace and defense lead adoption for enhanced fuel efficiency and performance. The marine sector benefits from improved structural integrity and reduced weight in vessel construction. Furthermore, the construction industry's focus on sustainable infrastructure and the wind energy sector's expansion to meet renewable energy targets significantly contribute to market momentum.
Core Materials for Composites Industry Market Size (In Billion)
Key growth drivers include ongoing advancements in material science, offering innovative and cost-effective core material solutions, alongside regulations emphasizing weight reduction and improved performance. The rise of additive manufacturing also influences material requirements. Challenges such as fluctuating raw material prices and the need for specialized manufacturing expertise may present restraints. The market is segmented by core type, including Foam Core (PVC Foam, Polystyrene Foam, Polyurethane Foam, PMMA Foam, SAN Co-polymer Foam, Other Thermoplastics), Honeycomb (Aluminum Honeycomb, Nomex Honeycomb, Thermoplastic Honeycomb), and Wood (Balsa, Other Woods). The Asia Pacific region, particularly China and India, is expected to be a major growth engine due to rapid industrialization and a strong manufacturing base. Leading players like 3A Composites, Armacell International SA, and Hexcel Corporation are investing in R&D to meet evolving industry demands.
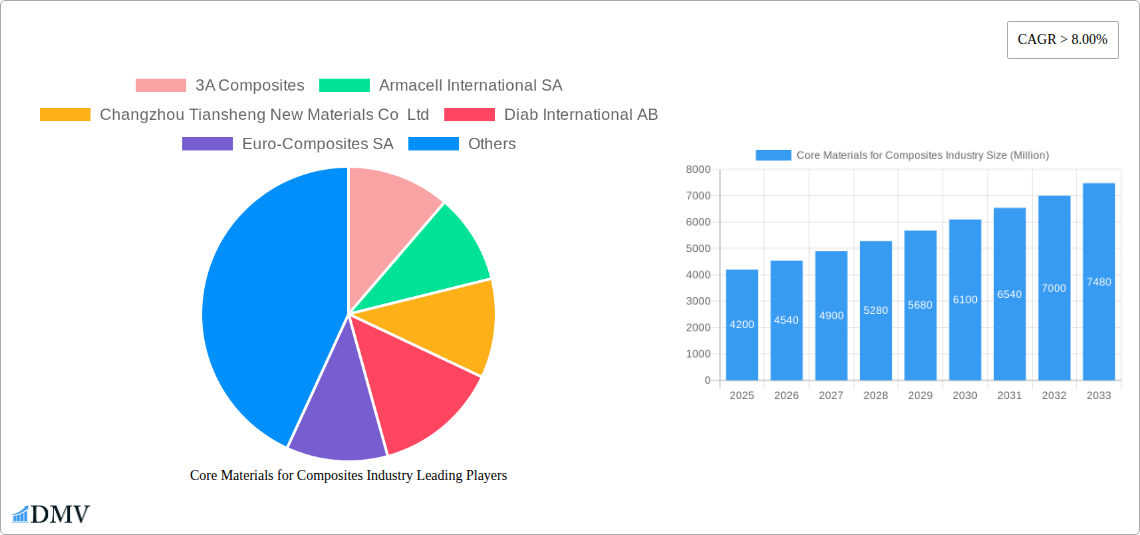
Core Materials for Composites Industry Company Market Share
This comprehensive report on the Core Materials for Composites Industry provides strategic insights into market dynamics, emerging trends, and critical factors for growth. Covering the study period 2019–2033 with a base year of 2025, it offers actionable intelligence for stakeholders. The analysis details market composition, industry evolution, regional performance, product innovations, growth drivers, obstacles, opportunities, key players, and pivotal developments, concluding with a strategic market forecast. Gain unparalleled insights into market share distribution, technological advancements, regulatory landscapes, and end-user industry demand to navigate the competitive composites sector effectively.
Core Materials for Composites Industry Market Composition & Trends
The Core Materials for Composites Industry is characterized by a dynamic and evolving market concentration, driven by continuous innovation and strategic M&A activities. The market witnesses significant investment in research and development, leading to the emergence of advanced material solutions. Regulatory landscapes play a crucial role, influencing material selection and manufacturing processes across key end-user industries. Substitutes are continuously being developed, pushing for enhanced performance and cost-effectiveness in existing core materials. End-user profiles are becoming increasingly sophisticated, demanding tailored solutions for applications ranging from aerospace to renewable energy. Mergers and acquisitions are a prominent feature, with deal values in the tens of millions of dollars shaping market consolidation and expanding technological capabilities.
- Market Share Distribution: The market is segmented by material type, with foam cores, particularly PVC and PET foams, holding a substantial share, followed by honeycomb structures (Nomex, Aluminum) and wood-based cores (Balsa).
- Innovation Catalysts: Nanotechnology integration, bio-based material development, and advanced manufacturing techniques like 3D printing are significant innovation drivers.
- Regulatory Landscapes: Stringent fire, smoke, and toxicity (FST) regulations in aerospace and marine sectors, along with sustainability mandates for construction and wind energy, influence material adoption.
- Substitute Products: Advanced polymer foams and high-performance sandwich structures are increasingly offering alternatives to traditional core materials.
- End-User Profiles: Demands for lightweight, high-strength, and durable materials are prevalent across all major end-user segments.
- M&A Activities: Strategic acquisitions are focused on expanding product portfolios, geographic reach, and technological expertise in core material manufacturing. Deal values are estimated to range from xx Million to xx Million.
Core Materials for Composites Industry Industry Evolution
The Core Materials for Composites Industry has undergone a significant transformation over the historical period of 2019–2024, with a projected accelerated evolution through the forecast period of 2025–2033. The market growth trajectories have been consistently upward, fueled by the increasing adoption of lightweight and high-performance composite materials across a multitude of industries. Technological advancements have been the bedrock of this evolution, with breakthroughs in material science and manufacturing processes enabling the development of core materials with enhanced properties such as superior strength-to-weight ratios, improved thermal and acoustic insulation, and superior durability. The demand for these advanced materials is intrinsically linked to the performance requirements of end-user applications, which are themselves pushing the boundaries of innovation.
Shifting consumer demands, coupled with global trends towards sustainability and energy efficiency, have further propelled the industry forward. For instance, the automotive sector's relentless pursuit of fuel economy has driven a substantial increase in the use of composite materials, necessitating the development of lightweight and cost-effective core solutions. Similarly, the burgeoning renewable energy sector, particularly wind energy, relies heavily on advanced composites for larger and more efficient turbine blades, creating a significant demand for robust and reliable core materials. The aerospace and defense industry continues to be a major consumer, demanding materials that meet stringent safety and performance standards. The construction sector is increasingly recognizing the benefits of composites for their durability, resistance to corrosion, and design flexibility, leading to new applications for core materials.
Growth rates in the market have seen a steady increase, with projections indicating a Compound Annual Growth Rate (CAGR) of approximately xx% during the forecast period. Adoption metrics for advanced core materials have risen significantly, with specific segments like SAN co-polymer foams and thermoplastic honeycombs exhibiting particularly strong uptake due to their recyclability and enhanced processing capabilities. The industry's ability to adapt to these evolving demands, innovate in material development, and optimize production processes will be critical for sustained growth. Furthermore, the development of more sustainable and eco-friendly core materials is becoming a key differentiating factor, influencing market preferences and regulatory compliance. The historical period saw initial investments in scaling up production of established core materials, while the forecast period will witness a greater emphasis on novel material formulations and advanced manufacturing integration.
Leading Regions, Countries, or Segments in Core Materials for Composites Industry
The global Core Materials for Composites Industry is currently dominated by North America, primarily driven by the robust Aerospace and Defense end-user industry and significant investments in the Wind Energy sector. The region's leadership is bolstered by a mature composites manufacturing ecosystem, a strong focus on technological innovation, and favorable government policies supporting advanced materials development. The sheer scale of aerospace manufacturing, coupled with the ongoing expansion of renewable energy infrastructure, creates an insatiable demand for high-performance core materials.
Within North America, the United States stands out as a pivotal market. Its extensive aerospace and defense industry, comprising major players like Hexcel Corporation and The Gill Corporation, necessitates cutting-edge core materials for aircraft and defense systems, where weight reduction and structural integrity are paramount. Furthermore, the burgeoning wind energy sector, with its increasing demand for larger and more efficient turbine blades, further solidifies the US's position. Companies like Gurit Holding AG have a strong presence, contributing significantly to the supply chain.
Beyond the United States, Europe presents a strong and dynamic market, particularly Germany, France, and the UK. These countries exhibit significant activity in the Automotive and Marine sectors, where lightweighting and enhanced performance are key drivers. The presence of leading European manufacturers such as Evonik Industries AG, Armacell International SA, and Saertex GmbH & Co KG contributes to a sophisticated and competitive market landscape. The ongoing push for sustainability in the automotive industry, coupled with the luxury and performance demands in the marine sector, fuels the demand for advanced core materials like SAN co-polymer foams and Nomex honeycombs.
The Asia-Pacific region, especially China, is emerging as a significant growth engine, driven by rapid industrialization and substantial investments in infrastructure and renewable energy. While the Aerospace and Defense segment is growing, the Construction and Consumer Goods industries are key demand generators. Companies like Changzhou Tiansheng New Materials Co Ltd are at the forefront of this expansion, catering to a diverse range of applications. The region's ability to offer cost-effective manufacturing solutions, coupled with increasing technological capabilities, positions it as a critical player in the global composites market.
Key drivers contributing to regional dominance include:
- Investment Trends: Significant capital expenditure in research and development and manufacturing facilities across key regions.
- Regulatory Support: Government incentives and mandates promoting the use of advanced materials for energy efficiency and structural performance.
- End-User Industry Growth: Rapid expansion of sectors like aerospace, wind energy, and automotive, creating substantial demand for core materials.
- Technological Expertise: Presence of established R&D institutions and a skilled workforce driving material innovation.
- Supply Chain Integration: Development of robust supply chains for raw materials and finished core materials, ensuring market accessibility.
Within the material segments, Foam Core materials, particularly PVC and Polystyrene foams, continue to hold a significant market share due to their versatility, cost-effectiveness, and ease of processing. However, Honeycomb structures, especially Nomex and Aluminum, are witnessing strong growth in high-performance applications requiring exceptional stiffness and strength-to-weight ratios, particularly in aerospace. Wood core materials, like Balsa, remain crucial in specific marine and wind energy applications where their natural properties and sustainability are advantageous.
Core Materials for Composites Industry Product Innovations
Product innovations in the Core Materials for Composites Industry are focused on enhancing performance, improving sustainability, and expanding application versatility. Manufacturers are developing advanced foam cores with superior fire, smoke, and toxicity (FST) properties for stringent aerospace requirements, alongside bio-based and recyclable foam formulations for eco-conscious markets. Innovations in honeycomb structures include higher temperature resistance and improved adhesion capabilities for extreme environments. Furthermore, hybrid core materials combining different material types are emerging, offering unique combinations of stiffness, toughness, and insulation. These advancements are driven by breakthroughs in polymer science, nanotechnology, and advanced manufacturing techniques, enabling materials with tailored mechanical properties, enhanced durability, and reduced environmental impact.
Propelling Factors for Core Materials for Composites Industry Growth
The Core Materials for Composites Industry is propelled by a confluence of technological, economic, and regulatory factors. The relentless demand for lightweight and high-strength materials across key sectors like Aerospace and Defense, Automotive, and Wind Energy is a primary growth catalyst. Technological advancements in material science, leading to enhanced performance characteristics and improved manufacturing processes, further fuel adoption. Economically, the pursuit of fuel efficiency in transportation and the expansion of renewable energy infrastructure significantly drive demand. Regulatory mandates promoting sustainability, energy conservation, and stringent safety standards also play a crucial role in pushing for the adoption of advanced composite core materials.
Obstacles in the Core Materials for Composites Industry Market
Despite robust growth, the Core Materials for Composites Industry faces several obstacles. High initial investment costs for advanced manufacturing technologies and specialized core materials can be a deterrent for some smaller players and emerging markets. Supply chain disruptions, as evidenced by recent global events, can impact the availability and pricing of essential raw materials, leading to production delays and increased costs. Intense competitive pressures from both established players and new entrants, coupled with the constant need for innovation to stay ahead, pose a continuous challenge. Furthermore, navigating complex and evolving regulatory landscapes across different regions requires significant investment in compliance and material certification.
Future Opportunities in Core Materials for Composites Industry
Emerging opportunities in the Core Materials for Composites Industry are abundant, driven by evolving market needs and technological advancements. The growing emphasis on sustainability and circular economy principles presents a significant opportunity for the development and adoption of bio-based, recyclable, and lower-carbon footprint core materials. The expanding electric vehicle (EV) market necessitates lightweighting solutions for increased range and efficiency, opening new avenues for advanced core materials. Furthermore, advancements in additive manufacturing (3D printing) are creating opportunities for custom-designed core structures with optimized performance and reduced material waste. The increasing global focus on renewable energy infrastructure, particularly in offshore wind and solar, will continue to be a strong demand driver for high-performance core materials.
Major Players in the Core Materials for Composites Industry Ecosystem
- 3A Composites
- Armacell International SA
- Changzhou Tiansheng New Materials Co Ltd
- Diab International AB
- Euro-Composites SA
- Evonik Industries AG
- Gurit Holding AG
- Hexcel Corporation
- Plascore Incorporated
- Saertex GmbH & Co KG
- The Gill Corporation
Key Developments in Core Materials for Composites Industry Industry
- 2023/10: Evonik Industries AG launches a new generation of high-performance PVC foams with enhanced FST properties for aerospace applications.
- 2023/08: Hexcel Corporation announces a strategic partnership with a leading aerospace manufacturer to supply advanced composite core materials for next-generation aircraft.
- 2023/05: Saertex GmbH & Co KG expands its production capacity for multiaxial non-crimp fabrics, crucial for wind turbine blade manufacturing.
- 2022/12: Armacell International SA acquires a specialized manufacturer of thermoplastic honeycombs to broaden its product portfolio.
- 2022/09: Diab International AB introduces a new range of lightweight structural foam cores derived from recycled materials.
- 2022/06: Gurit Holding AG develops a novel recyclable composite material system for marine applications.
- 2021/11: 3A Composites showcases its advanced honeycomb solutions for high-temperature automotive applications.
Strategic Core Materials for Composites Industry Market Forecast
The Core Materials for Composites Industry is poised for sustained and robust growth, driven by an increasing demand for lightweight, high-performance, and sustainable material solutions. The forecast period from 2025 to 2033 will witness significant market expansion, fueled by ongoing technological innovations and the growing adoption of composites across diverse end-user industries. Key growth catalysts include the imperative for fuel efficiency in transportation, the expansion of renewable energy infrastructure, and advancements in aerospace technology. The industry's ability to develop and commercialize eco-friendly and cost-effective core materials will be paramount in capitalizing on emerging opportunities and solidifying market leadership in this dynamic sector.
Core Materials for Composites Industry Segmentation
-
1. Type
-
1.1. Foam Core
- 1.1.1. PVC Foam
- 1.1.2. Polystyrene Foam
- 1.1.3. Polyurethane Foam
- 1.1.4. PMMA Foam
- 1.1.5. SAN Co-polymer Foam
- 1.1.6. Other Thermoplastics
-
1.2. Honeycomb
- 1.2.1. Aluminum Honeycomb
- 1.2.2. Nomex Honeycomb
- 1.2.3. Thermoplastic Honeycomb
-
1.3. Wood
- 1.3.1. Balsa
- 1.3.2. Other Woods
-
1.1. Foam Core
-
2. End-user Industry
- 2.1. Aerospace and Defense
- 2.2. Marine
- 2.3. Construction
- 2.4. Wind Energy
- 2.5. Automotive
- 2.6. Consumer Goods
- 2.7. Other End-user Industries
Core Materials for Composites Industry Segmentation By Geography
-
1. Asia Pacific
- 1.1. China
- 1.2. India
- 1.3. Japan
- 1.4. South Korea
- 1.5. ASEAN Countries
- 1.6. Rest of Asia Pacific
-
2. North America
- 2.1. United States
- 2.2. Canada
- 2.3. Mexico
-
3. Europe
- 3.1. Germany
- 3.2. United Kingdom
- 3.3. Italy
- 3.4. France
- 3.5. Spain
- 3.6. Rest of Europe
-
4. South America
- 4.1. Brazil
- 4.2. Argentina
- 4.3. Rest of South America
- 5. Middle East
-
6. Saudi Arabia
- 6.1. South Africa
- 6.2. Rest of Middle East
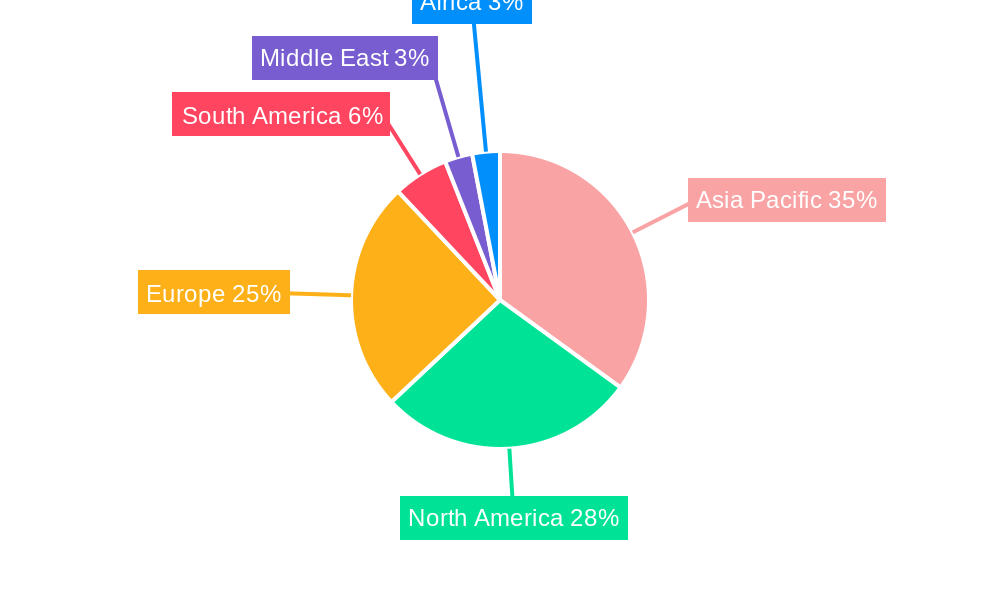
Core Materials for Composites Industry Regional Market Share
Geographic Coverage of Core Materials for Composites Industry
Core Materials for Composites Industry REPORT HIGHLIGHTS
| Aspects | Details |
|---|---|
| Study Period | 2020-2034 |
| Base Year | 2025 |
| Estimated Year | 2026 |
| Forecast Period | 2026-2034 |
| Historical Period | 2020-2025 |
| Growth Rate | CAGR of 9.29% from 2020-2034 |
| Segmentation |
|
Table of Contents
- 1. Introduction
- 1.1. Research Scope
- 1.2. Market Segmentation
- 1.3. Research Objective
- 1.4. Definitions and Assumptions
- 2. Executive Summary
- 2.1. Market Snapshot
- 3. Market Dynamics
- 3.1. Market Drivers
- 3.2. Market Restrains
- 3.3. Market Trends
- 3.4. Market Opportunities
- 4. Market Factor Analysis
- 4.1. Porters Five Forces
- 4.1.1. Bargaining Power of Suppliers
- 4.1.2. Bargaining Power of Buyers
- 4.1.3. Threat of New Entrants
- 4.1.4. Threat of Substitutes
- 4.1.5. Competitive Rivalry
- 4.2. PESTEL analysis
- 4.3. BCG Analysis
- 4.3.1. Stars (High Growth, High Market Share)
- 4.3.2. Cash Cows (Low Growth, High Market Share)
- 4.3.3. Question Mark (High Growth, Low Market Share)
- 4.3.4. Dogs (Low Growth, Low Market Share)
- 4.4. Ansoff Matrix Analysis
- 4.5. Supply Chain Analysis
- 4.6. Regulatory Landscape
- 4.7. Current Market Potential and Opportunity Assessment (TAM–SAM–SOM Framework)
- 4.8. DMV Analyst Note
- 4.1. Porters Five Forces
- 5. Market Analysis, Insights and Forecast 2021-2033
- 5.1. Market Analysis, Insights and Forecast - by Type
- 5.1.1. Foam Core
- 5.1.1.1. PVC Foam
- 5.1.1.2. Polystyrene Foam
- 5.1.1.3. Polyurethane Foam
- 5.1.1.4. PMMA Foam
- 5.1.1.5. SAN Co-polymer Foam
- 5.1.1.6. Other Thermoplastics
- 5.1.2. Honeycomb
- 5.1.2.1. Aluminum Honeycomb
- 5.1.2.2. Nomex Honeycomb
- 5.1.2.3. Thermoplastic Honeycomb
- 5.1.3. Wood
- 5.1.3.1. Balsa
- 5.1.3.2. Other Woods
- 5.1.1. Foam Core
- 5.2. Market Analysis, Insights and Forecast - by End-user Industry
- 5.2.1. Aerospace and Defense
- 5.2.2. Marine
- 5.2.3. Construction
- 5.2.4. Wind Energy
- 5.2.5. Automotive
- 5.2.6. Consumer Goods
- 5.2.7. Other End-user Industries
- 5.3. Market Analysis, Insights and Forecast - by Region
- 5.3.1. Asia Pacific
- 5.3.2. North America
- 5.3.3. Europe
- 5.3.4. South America
- 5.3.5. Middle East
- 5.3.6. Saudi Arabia
- 5.1. Market Analysis, Insights and Forecast - by Type
- 6. Global Core Materials for Composites Industry Analysis, Insights and Forecast, 2021-2033
- 6.1. Market Analysis, Insights and Forecast - by Type
- 6.1.1. Foam Core
- 6.1.1.1. PVC Foam
- 6.1.1.2. Polystyrene Foam
- 6.1.1.3. Polyurethane Foam
- 6.1.1.4. PMMA Foam
- 6.1.1.5. SAN Co-polymer Foam
- 6.1.1.6. Other Thermoplastics
- 6.1.2. Honeycomb
- 6.1.2.1. Aluminum Honeycomb
- 6.1.2.2. Nomex Honeycomb
- 6.1.2.3. Thermoplastic Honeycomb
- 6.1.3. Wood
- 6.1.3.1. Balsa
- 6.1.3.2. Other Woods
- 6.1.1. Foam Core
- 6.2. Market Analysis, Insights and Forecast - by End-user Industry
- 6.2.1. Aerospace and Defense
- 6.2.2. Marine
- 6.2.3. Construction
- 6.2.4. Wind Energy
- 6.2.5. Automotive
- 6.2.6. Consumer Goods
- 6.2.7. Other End-user Industries
- 6.1. Market Analysis, Insights and Forecast - by Type
- 7. Asia Pacific Core Materials for Composites Industry Analysis, Insights and Forecast, 2020-2032
- 7.1. Market Analysis, Insights and Forecast - by Type
- 7.1.1. Foam Core
- 7.1.1.1. PVC Foam
- 7.1.1.2. Polystyrene Foam
- 7.1.1.3. Polyurethane Foam
- 7.1.1.4. PMMA Foam
- 7.1.1.5. SAN Co-polymer Foam
- 7.1.1.6. Other Thermoplastics
- 7.1.2. Honeycomb
- 7.1.2.1. Aluminum Honeycomb
- 7.1.2.2. Nomex Honeycomb
- 7.1.2.3. Thermoplastic Honeycomb
- 7.1.3. Wood
- 7.1.3.1. Balsa
- 7.1.3.2. Other Woods
- 7.1.1. Foam Core
- 7.2. Market Analysis, Insights and Forecast - by End-user Industry
- 7.2.1. Aerospace and Defense
- 7.2.2. Marine
- 7.2.3. Construction
- 7.2.4. Wind Energy
- 7.2.5. Automotive
- 7.2.6. Consumer Goods
- 7.2.7. Other End-user Industries
- 7.1. Market Analysis, Insights and Forecast - by Type
- 8. North America Core Materials for Composites Industry Analysis, Insights and Forecast, 2020-2032
- 8.1. Market Analysis, Insights and Forecast - by Type
- 8.1.1. Foam Core
- 8.1.1.1. PVC Foam
- 8.1.1.2. Polystyrene Foam
- 8.1.1.3. Polyurethane Foam
- 8.1.1.4. PMMA Foam
- 8.1.1.5. SAN Co-polymer Foam
- 8.1.1.6. Other Thermoplastics
- 8.1.2. Honeycomb
- 8.1.2.1. Aluminum Honeycomb
- 8.1.2.2. Nomex Honeycomb
- 8.1.2.3. Thermoplastic Honeycomb
- 8.1.3. Wood
- 8.1.3.1. Balsa
- 8.1.3.2. Other Woods
- 8.1.1. Foam Core
- 8.2. Market Analysis, Insights and Forecast - by End-user Industry
- 8.2.1. Aerospace and Defense
- 8.2.2. Marine
- 8.2.3. Construction
- 8.2.4. Wind Energy
- 8.2.5. Automotive
- 8.2.6. Consumer Goods
- 8.2.7. Other End-user Industries
- 8.1. Market Analysis, Insights and Forecast - by Type
- 9. Europe Core Materials for Composites Industry Analysis, Insights and Forecast, 2020-2032
- 9.1. Market Analysis, Insights and Forecast - by Type
- 9.1.1. Foam Core
- 9.1.1.1. PVC Foam
- 9.1.1.2. Polystyrene Foam
- 9.1.1.3. Polyurethane Foam
- 9.1.1.4. PMMA Foam
- 9.1.1.5. SAN Co-polymer Foam
- 9.1.1.6. Other Thermoplastics
- 9.1.2. Honeycomb
- 9.1.2.1. Aluminum Honeycomb
- 9.1.2.2. Nomex Honeycomb
- 9.1.2.3. Thermoplastic Honeycomb
- 9.1.3. Wood
- 9.1.3.1. Balsa
- 9.1.3.2. Other Woods
- 9.1.1. Foam Core
- 9.2. Market Analysis, Insights and Forecast - by End-user Industry
- 9.2.1. Aerospace and Defense
- 9.2.2. Marine
- 9.2.3. Construction
- 9.2.4. Wind Energy
- 9.2.5. Automotive
- 9.2.6. Consumer Goods
- 9.2.7. Other End-user Industries
- 9.1. Market Analysis, Insights and Forecast - by Type
- 10. South America Core Materials for Composites Industry Analysis, Insights and Forecast, 2020-2032
- 10.1. Market Analysis, Insights and Forecast - by Type
- 10.1.1. Foam Core
- 10.1.1.1. PVC Foam
- 10.1.1.2. Polystyrene Foam
- 10.1.1.3. Polyurethane Foam
- 10.1.1.4. PMMA Foam
- 10.1.1.5. SAN Co-polymer Foam
- 10.1.1.6. Other Thermoplastics
- 10.1.2. Honeycomb
- 10.1.2.1. Aluminum Honeycomb
- 10.1.2.2. Nomex Honeycomb
- 10.1.2.3. Thermoplastic Honeycomb
- 10.1.3. Wood
- 10.1.3.1. Balsa
- 10.1.3.2. Other Woods
- 10.1.1. Foam Core
- 10.2. Market Analysis, Insights and Forecast - by End-user Industry
- 10.2.1. Aerospace and Defense
- 10.2.2. Marine
- 10.2.3. Construction
- 10.2.4. Wind Energy
- 10.2.5. Automotive
- 10.2.6. Consumer Goods
- 10.2.7. Other End-user Industries
- 10.1. Market Analysis, Insights and Forecast - by Type
- 11. Middle East Core Materials for Composites Industry Analysis, Insights and Forecast, 2020-2032
- 11.1. Market Analysis, Insights and Forecast - by Type
- 11.1.1. Foam Core
- 11.1.1.1. PVC Foam
- 11.1.1.2. Polystyrene Foam
- 11.1.1.3. Polyurethane Foam
- 11.1.1.4. PMMA Foam
- 11.1.1.5. SAN Co-polymer Foam
- 11.1.1.6. Other Thermoplastics
- 11.1.2. Honeycomb
- 11.1.2.1. Aluminum Honeycomb
- 11.1.2.2. Nomex Honeycomb
- 11.1.2.3. Thermoplastic Honeycomb
- 11.1.3. Wood
- 11.1.3.1. Balsa
- 11.1.3.2. Other Woods
- 11.1.1. Foam Core
- 11.2. Market Analysis, Insights and Forecast - by End-user Industry
- 11.2.1. Aerospace and Defense
- 11.2.2. Marine
- 11.2.3. Construction
- 11.2.4. Wind Energy
- 11.2.5. Automotive
- 11.2.6. Consumer Goods
- 11.2.7. Other End-user Industries
- 11.1. Market Analysis, Insights and Forecast - by Type
- 12. Saudi Arabia Core Materials for Composites Industry Analysis, Insights and Forecast, 2020-2032
- 12.1. Market Analysis, Insights and Forecast - by Type
- 12.1.1. Foam Core
- 12.1.1.1. PVC Foam
- 12.1.1.2. Polystyrene Foam
- 12.1.1.3. Polyurethane Foam
- 12.1.1.4. PMMA Foam
- 12.1.1.5. SAN Co-polymer Foam
- 12.1.1.6. Other Thermoplastics
- 12.1.2. Honeycomb
- 12.1.2.1. Aluminum Honeycomb
- 12.1.2.2. Nomex Honeycomb
- 12.1.2.3. Thermoplastic Honeycomb
- 12.1.3. Wood
- 12.1.3.1. Balsa
- 12.1.3.2. Other Woods
- 12.1.1. Foam Core
- 12.2. Market Analysis, Insights and Forecast - by End-user Industry
- 12.2.1. Aerospace and Defense
- 12.2.2. Marine
- 12.2.3. Construction
- 12.2.4. Wind Energy
- 12.2.5. Automotive
- 12.2.6. Consumer Goods
- 12.2.7. Other End-user Industries
- 12.1. Market Analysis, Insights and Forecast - by Type
- 13. Competitive Analysis
- 13.1. Company Profiles
- 13.1.1 3A Composites
- 13.1.1.1. Company Overview
- 13.1.1.2. Products
- 13.1.1.3. Company Financials
- 13.1.1.4. SWOT Analysis
- 13.1.2 Armacell International SA
- 13.1.2.1. Company Overview
- 13.1.2.2. Products
- 13.1.2.3. Company Financials
- 13.1.2.4. SWOT Analysis
- 13.1.3 Changzhou Tiansheng New Materials Co Ltd
- 13.1.3.1. Company Overview
- 13.1.3.2. Products
- 13.1.3.3. Company Financials
- 13.1.3.4. SWOT Analysis
- 13.1.4 Diab International AB
- 13.1.4.1. Company Overview
- 13.1.4.2. Products
- 13.1.4.3. Company Financials
- 13.1.4.4. SWOT Analysis
- 13.1.5 Euro-Composites SA
- 13.1.5.1. Company Overview
- 13.1.5.2. Products
- 13.1.5.3. Company Financials
- 13.1.5.4. SWOT Analysis
- 13.1.6 Evonik Industries AG
- 13.1.6.1. Company Overview
- 13.1.6.2. Products
- 13.1.6.3. Company Financials
- 13.1.6.4. SWOT Analysis
- 13.1.7 Gurit Holding AG
- 13.1.7.1. Company Overview
- 13.1.7.2. Products
- 13.1.7.3. Company Financials
- 13.1.7.4. SWOT Analysis
- 13.1.8 Hexcel Corporation
- 13.1.8.1. Company Overview
- 13.1.8.2. Products
- 13.1.8.3. Company Financials
- 13.1.8.4. SWOT Analysis
- 13.1.9 Plascore Incorporated
- 13.1.9.1. Company Overview
- 13.1.9.2. Products
- 13.1.9.3. Company Financials
- 13.1.9.4. SWOT Analysis
- 13.1.10 Saertex GmbH & Co KG
- 13.1.10.1. Company Overview
- 13.1.10.2. Products
- 13.1.10.3. Company Financials
- 13.1.10.4. SWOT Analysis
- 13.1.11 The Gill Corporation*List Not Exhaustive
- 13.1.11.1. Company Overview
- 13.1.11.2. Products
- 13.1.11.3. Company Financials
- 13.1.11.4. SWOT Analysis
- 13.1.1 3A Composites
- 13.2. Market Entropy
- 13.2.1 Company's Key Areas Served
- 13.2.2 Recent Developments
- 13.3. Company Market Share Analysis 2025
- 13.3.1 Top 5 Companies Market Share Analysis
- 13.3.2 Top 3 Companies Market Share Analysis
- 13.4. List of Potential Customers
- 14. Research Methodology
List of Figures
- Figure 1: Global Core Materials for Composites Industry Revenue Breakdown (billion, %) by Region 2025 & 2033
- Figure 2: Asia Pacific Core Materials for Composites Industry Revenue (billion), by Type 2025 & 2033
- Figure 3: Asia Pacific Core Materials for Composites Industry Revenue Share (%), by Type 2025 & 2033
- Figure 4: Asia Pacific Core Materials for Composites Industry Revenue (billion), by End-user Industry 2025 & 2033
- Figure 5: Asia Pacific Core Materials for Composites Industry Revenue Share (%), by End-user Industry 2025 & 2033
- Figure 6: Asia Pacific Core Materials for Composites Industry Revenue (billion), by Country 2025 & 2033
- Figure 7: Asia Pacific Core Materials for Composites Industry Revenue Share (%), by Country 2025 & 2033
- Figure 8: North America Core Materials for Composites Industry Revenue (billion), by Type 2025 & 2033
- Figure 9: North America Core Materials for Composites Industry Revenue Share (%), by Type 2025 & 2033
- Figure 10: North America Core Materials for Composites Industry Revenue (billion), by End-user Industry 2025 & 2033
- Figure 11: North America Core Materials for Composites Industry Revenue Share (%), by End-user Industry 2025 & 2033
- Figure 12: North America Core Materials for Composites Industry Revenue (billion), by Country 2025 & 2033
- Figure 13: North America Core Materials for Composites Industry Revenue Share (%), by Country 2025 & 2033
- Figure 14: Europe Core Materials for Composites Industry Revenue (billion), by Type 2025 & 2033
- Figure 15: Europe Core Materials for Composites Industry Revenue Share (%), by Type 2025 & 2033
- Figure 16: Europe Core Materials for Composites Industry Revenue (billion), by End-user Industry 2025 & 2033
- Figure 17: Europe Core Materials for Composites Industry Revenue Share (%), by End-user Industry 2025 & 2033
- Figure 18: Europe Core Materials for Composites Industry Revenue (billion), by Country 2025 & 2033
- Figure 19: Europe Core Materials for Composites Industry Revenue Share (%), by Country 2025 & 2033
- Figure 20: South America Core Materials for Composites Industry Revenue (billion), by Type 2025 & 2033
- Figure 21: South America Core Materials for Composites Industry Revenue Share (%), by Type 2025 & 2033
- Figure 22: South America Core Materials for Composites Industry Revenue (billion), by End-user Industry 2025 & 2033
- Figure 23: South America Core Materials for Composites Industry Revenue Share (%), by End-user Industry 2025 & 2033
- Figure 24: South America Core Materials for Composites Industry Revenue (billion), by Country 2025 & 2033
- Figure 25: South America Core Materials for Composites Industry Revenue Share (%), by Country 2025 & 2033
- Figure 26: Middle East Core Materials for Composites Industry Revenue (billion), by Type 2025 & 2033
- Figure 27: Middle East Core Materials for Composites Industry Revenue Share (%), by Type 2025 & 2033
- Figure 28: Middle East Core Materials for Composites Industry Revenue (billion), by End-user Industry 2025 & 2033
- Figure 29: Middle East Core Materials for Composites Industry Revenue Share (%), by End-user Industry 2025 & 2033
- Figure 30: Middle East Core Materials for Composites Industry Revenue (billion), by Country 2025 & 2033
- Figure 31: Middle East Core Materials for Composites Industry Revenue Share (%), by Country 2025 & 2033
- Figure 32: Saudi Arabia Core Materials for Composites Industry Revenue (billion), by Type 2025 & 2033
- Figure 33: Saudi Arabia Core Materials for Composites Industry Revenue Share (%), by Type 2025 & 2033
- Figure 34: Saudi Arabia Core Materials for Composites Industry Revenue (billion), by End-user Industry 2025 & 2033
- Figure 35: Saudi Arabia Core Materials for Composites Industry Revenue Share (%), by End-user Industry 2025 & 2033
- Figure 36: Saudi Arabia Core Materials for Composites Industry Revenue (billion), by Country 2025 & 2033
- Figure 37: Saudi Arabia Core Materials for Composites Industry Revenue Share (%), by Country 2025 & 2033
List of Tables
- Table 1: Global Core Materials for Composites Industry Revenue billion Forecast, by Type 2020 & 2033
- Table 2: Global Core Materials for Composites Industry Revenue billion Forecast, by End-user Industry 2020 & 2033
- Table 3: Global Core Materials for Composites Industry Revenue billion Forecast, by Region 2020 & 2033
- Table 4: Global Core Materials for Composites Industry Revenue billion Forecast, by Type 2020 & 2033
- Table 5: Global Core Materials for Composites Industry Revenue billion Forecast, by End-user Industry 2020 & 2033
- Table 6: Global Core Materials for Composites Industry Revenue billion Forecast, by Country 2020 & 2033
- Table 7: China Core Materials for Composites Industry Revenue (billion) Forecast, by Application 2020 & 2033
- Table 8: India Core Materials for Composites Industry Revenue (billion) Forecast, by Application 2020 & 2033
- Table 9: Japan Core Materials for Composites Industry Revenue (billion) Forecast, by Application 2020 & 2033
- Table 10: South Korea Core Materials for Composites Industry Revenue (billion) Forecast, by Application 2020 & 2033
- Table 11: ASEAN Countries Core Materials for Composites Industry Revenue (billion) Forecast, by Application 2020 & 2033
- Table 12: Rest of Asia Pacific Core Materials for Composites Industry Revenue (billion) Forecast, by Application 2020 & 2033
- Table 13: Global Core Materials for Composites Industry Revenue billion Forecast, by Type 2020 & 2033
- Table 14: Global Core Materials for Composites Industry Revenue billion Forecast, by End-user Industry 2020 & 2033
- Table 15: Global Core Materials for Composites Industry Revenue billion Forecast, by Country 2020 & 2033
- Table 16: United States Core Materials for Composites Industry Revenue (billion) Forecast, by Application 2020 & 2033
- Table 17: Canada Core Materials for Composites Industry Revenue (billion) Forecast, by Application 2020 & 2033
- Table 18: Mexico Core Materials for Composites Industry Revenue (billion) Forecast, by Application 2020 & 2033
- Table 19: Global Core Materials for Composites Industry Revenue billion Forecast, by Type 2020 & 2033
- Table 20: Global Core Materials for Composites Industry Revenue billion Forecast, by End-user Industry 2020 & 2033
- Table 21: Global Core Materials for Composites Industry Revenue billion Forecast, by Country 2020 & 2033
- Table 22: Germany Core Materials for Composites Industry Revenue (billion) Forecast, by Application 2020 & 2033
- Table 23: United Kingdom Core Materials for Composites Industry Revenue (billion) Forecast, by Application 2020 & 2033
- Table 24: Italy Core Materials for Composites Industry Revenue (billion) Forecast, by Application 2020 & 2033
- Table 25: France Core Materials for Composites Industry Revenue (billion) Forecast, by Application 2020 & 2033
- Table 26: Spain Core Materials for Composites Industry Revenue (billion) Forecast, by Application 2020 & 2033
- Table 27: Rest of Europe Core Materials for Composites Industry Revenue (billion) Forecast, by Application 2020 & 2033
- Table 28: Global Core Materials for Composites Industry Revenue billion Forecast, by Type 2020 & 2033
- Table 29: Global Core Materials for Composites Industry Revenue billion Forecast, by End-user Industry 2020 & 2033
- Table 30: Global Core Materials for Composites Industry Revenue billion Forecast, by Country 2020 & 2033
- Table 31: Brazil Core Materials for Composites Industry Revenue (billion) Forecast, by Application 2020 & 2033
- Table 32: Argentina Core Materials for Composites Industry Revenue (billion) Forecast, by Application 2020 & 2033
- Table 33: Rest of South America Core Materials for Composites Industry Revenue (billion) Forecast, by Application 2020 & 2033
- Table 34: Global Core Materials for Composites Industry Revenue billion Forecast, by Type 2020 & 2033
- Table 35: Global Core Materials for Composites Industry Revenue billion Forecast, by End-user Industry 2020 & 2033
- Table 36: Global Core Materials for Composites Industry Revenue billion Forecast, by Country 2020 & 2033
- Table 37: Global Core Materials for Composites Industry Revenue billion Forecast, by Type 2020 & 2033
- Table 38: Global Core Materials for Composites Industry Revenue billion Forecast, by End-user Industry 2020 & 2033
- Table 39: Global Core Materials for Composites Industry Revenue billion Forecast, by Country 2020 & 2033
- Table 40: South Africa Core Materials for Composites Industry Revenue (billion) Forecast, by Application 2020 & 2033
- Table 41: Rest of Middle East Core Materials for Composites Industry Revenue (billion) Forecast, by Application 2020 & 2033
Frequently Asked Questions
1. What is the projected Compound Annual Growth Rate (CAGR) of the Core Materials for Composites Industry?
The projected CAGR is approximately 9.29%.
2. Which companies are prominent players in the Core Materials for Composites Industry?
Key companies in the market include 3A Composites, Armacell International SA, Changzhou Tiansheng New Materials Co Ltd, Diab International AB, Euro-Composites SA, Evonik Industries AG, Gurit Holding AG, Hexcel Corporation, Plascore Incorporated, Saertex GmbH & Co KG, The Gill Corporation*List Not Exhaustive.
3. What are the main segments of the Core Materials for Composites Industry?
The market segments include Type, End-user Industry.
4. Can you provide details about the market size?
The market size is estimated to be USD 7.16 billion as of 2022.
5. What are some drivers contributing to market growth?
; Increasing Demand from the Wind Energy Domain; Increasing Use of Composites in the Aerospace Industry; Emerging Applications in the Automotive Market.
6. What are the notable trends driving market growth?
Growing Usage in Aerospace and Defense Sector.
7. Are there any restraints impacting market growth?
; Increasing Demand from the Wind Energy Domain; Increasing Use of Composites in the Aerospace Industry; Emerging Applications in the Automotive Market.
8. Can you provide examples of recent developments in the market?
N/A
9. What pricing options are available for accessing the report?
Pricing options include single-user, multi-user, and enterprise licenses priced at USD 4750, USD 5250, and USD 8750 respectively.
10. Is the market size provided in terms of value or volume?
The market size is provided in terms of value, measured in billion.
11. Are there any specific market keywords associated with the report?
Yes, the market keyword associated with the report is "Core Materials for Composites Industry," which aids in identifying and referencing the specific market segment covered.
12. How do I determine which pricing option suits my needs best?
The pricing options vary based on user requirements and access needs. Individual users may opt for single-user licenses, while businesses requiring broader access may choose multi-user or enterprise licenses for cost-effective access to the report.
13. Are there any additional resources or data provided in the Core Materials for Composites Industry report?
While the report offers comprehensive insights, it's advisable to review the specific contents or supplementary materials provided to ascertain if additional resources or data are available.
14. How can I stay updated on further developments or reports in the Core Materials for Composites Industry?
To stay informed about further developments, trends, and reports in the Core Materials for Composites Industry, consider subscribing to industry newsletters, following relevant companies and organizations, or regularly checking reputable industry news sources and publications.
Methodology
Step 1 - Identification of Relevant Samples Size from Population Database


Step 2 - Approaches for Defining Global Market Size (Value, Volume* & Price*)

Note*: In applicable scenarios
Step 3 - Data Sources
Primary Research
- Web Analytics
- Survey Reports
- Research Institute
- Latest Research Reports
- Opinion Leaders
Secondary Research
- Annual Reports
- White Paper
- Latest Press Release
- Industry Association
- Paid Database
- Investor Presentations

Step 4 - Data Triangulation
Involves using different sources of information in order to increase the validity of a study
These sources are likely to be stakeholders in a program - participants, other researchers, program staff, other community members, and so on.
Then we put all data in single framework & apply various statistical tools to find out the dynamic on the market.
During the analysis stage, feedback from the stakeholder groups would be compared to determine areas of agreement as well as areas of divergence