

Key Insights
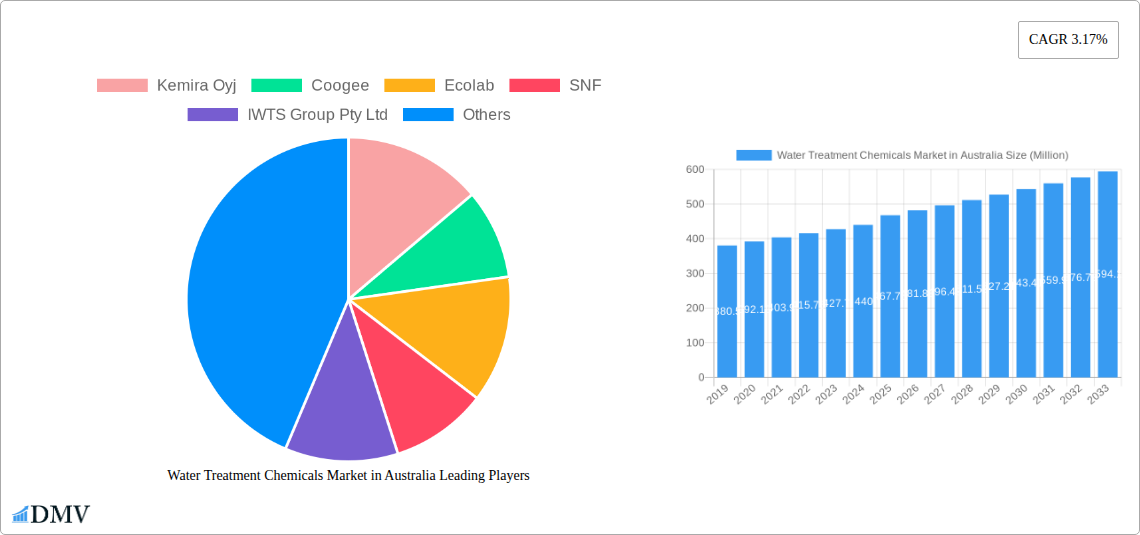
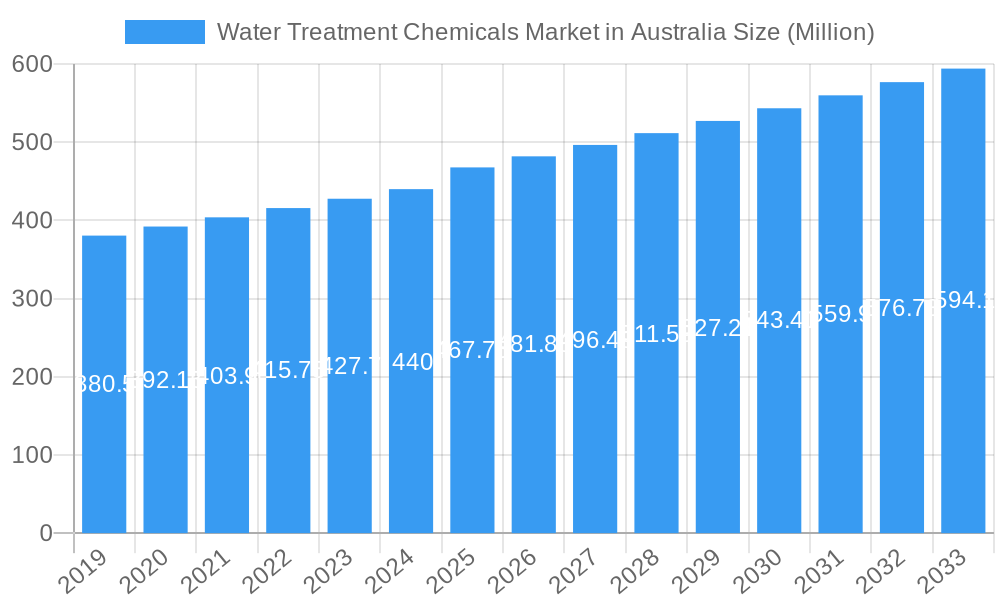
The Australian Water Treatment Chemicals Market is poised for steady expansion, projected to reach an estimated USD 467.75 Million by 2025. This growth is underpinned by a Compound Annual Growth Rate (CAGR) of 3.17% during the forecast period of 2025-2033. A significant driver for this market is the increasing demand for advanced water purification solutions across various industrial sectors, including mining, power generation, and food and beverage. The inherent need for efficient wastewater management and the stringent regulatory landscape promoting responsible water usage are also compelling factors contributing to market buoyancy. Furthermore, ongoing technological advancements in developing more effective and environmentally friendly biocides, disinfectants, and scale inhibitors are expected to foster market penetration. The emphasis on water reuse and recycling initiatives, especially in water-scarce regions like parts of Australia, further amplifies the demand for sophisticated water treatment chemical solutions.
Water Treatment Chemicals Market in Australia Market Size (In Million)
The market's trajectory is characterized by a diverse range of product segments, with Biocides and Disinfectants, and Coagulants and Flocculants holding prominent positions due to their critical roles in industrial and municipal water treatment processes. Corrosion and Scale Inhibitors are also gaining traction, driven by the imperative to maintain operational efficiency and extend the lifespan of critical infrastructure. Geographically, Australia's substantial resource extraction activities in mining and mineral processing, coupled with its robust power generation sector, are key contributors to regional demand. The country's commitment to improving municipal water quality and managing industrial effluents will continue to fuel the adoption of a comprehensive suite of water treatment chemicals. While the market benefits from strong demand drivers, potential restraints such as fluctuating raw material prices and the initial capital investment for advanced treatment systems may present challenges. Nevertheless, the overarching commitment to water sustainability and the continuous innovation by key players like Kemira Oyj, Ecolab, and Solvay are expected to navigate these challenges and ensure sustained market growth.
Water Treatment Chemicals Market in Australia Company Market Share
Dive deep into the dynamic Australian Water Treatment Chemicals Market with this in-depth report. Spanning the historical period of 2019-2024 and projecting growth through 2033, with a base and estimated year of 2025, this analysis provides critical insights for stakeholders navigating this vital sector. We meticulously examine market trends, competitive landscapes, technological innovations, and regulatory frameworks, offering a strategic roadmap for success. This report is essential for chemical manufacturers, water utilities, industrial operators, and investors seeking to capitalize on the expanding demand for sustainable and efficient water management solutions in Australia.
Water Treatment Chemicals Market in Australia Market Composition & Trends
The Australian Water Treatment Chemicals Market is characterized by a moderate level of concentration, with key players like Kemira Oyj, Ecolab, Solvay, Dow, Solenis, and Ixom holding significant shares. Innovation is primarily driven by the increasing stringency of environmental regulations, the growing demand for water reuse, and the development of advanced chemical formulations for specific industrial applications. The regulatory landscape, overseen by bodies such as the Australian Drinking Water Guidelines and state environmental protection agencies, plays a crucial role in shaping product development and market access. Substitute products, such as advanced membrane technologies and UV disinfection, present a competitive pressure, necessitating continuous innovation in chemical solutions to maintain cost-effectiveness and performance. End-user profiles are diverse, ranging from large-scale industrial facilities in mining and power generation to municipal water treatment plants and food and beverage processors, each with unique chemical requirements. Mergers and acquisitions (M&A) activities, while not at extremely high levels, are strategic, aimed at consolidating market presence, acquiring new technologies, or expanding product portfolios. For instance, a hypothetical M&A deal in the past year involving a major player acquiring a niche biocides manufacturer could be valued in the tens of millions of Australian dollars, impacting market share distribution. The market is projected to witness a Compound Annual Growth Rate (CAGR) of approximately XX% between 2025 and 2033, driven by robust infrastructure development and increased industrial activity.
Water Treatment Chemicals Market in Australia Industry Evolution
The Australian Water Treatment Chemicals Market has undergone a significant evolution driven by a confluence of factors including burgeoning industrialization, increasing urbanization, and a heightened national focus on water security and environmental sustainability. Historically, the market was largely driven by the foundational needs of basic water purification for potable use and industrial process water. However, the past decade has witnessed a substantial shift towards specialized chemical solutions addressing complex challenges such as stringent effluent discharge regulations, the growing need for water recycling in water-scarce regions, and the optimization of energy consumption in water treatment processes. The market growth trajectory has been consistently upward, with an estimated market size of approximately AUD XX Million in 2024, projected to reach AUD XX Million by 2033, reflecting a CAGR of approximately XX% over the forecast period.
Technological advancements have been a pivotal force in this evolution. The development of more efficient and eco-friendly coagulants and flocculants, such as advanced polymeric formulations, has significantly improved turbidity removal and sludge dewatering, leading to reduced operational costs and environmental impact. The emergence of sophisticated biocides and disinfectants, offering broader spectrum efficacy and lower environmental persistence, has been crucial for meeting evolving microbial control standards. Furthermore, innovations in corrosion and scale inhibitors have become indispensable for protecting aging water infrastructure and optimizing the efficiency of industrial equipment, particularly in sectors like power generation and oil and gas.
Shifting consumer demands, influenced by increasing environmental awareness and a greater appreciation for water as a precious resource, have also played a crucial role. There is a growing preference for 'green' and sustainable chemical alternatives, prompting manufacturers to invest in research and development of bio-based or biodegradable treatment chemicals. The demand for customized solutions tailored to specific water chemistries and operational requirements has also intensified, moving away from one-size-fits-all approaches. This has led to a greater emphasis on technical support and application expertise from chemical suppliers. The Australian government's increasing investment in water infrastructure projects and its commitment to achieving ambitious water recycling targets are further solidifying the market's growth prospects. The adoption of advanced digital monitoring and control systems in water treatment plants is also influencing the demand for intelligent chemical dosing and real-time performance optimization, creating opportunities for integrated chemical and technology solutions. The market's evolution is a testament to its adaptability and its critical role in supporting Australia's economic development and environmental stewardship.
Leading Regions, Countries, or Segments in Water Treatment Chemicals Market in Australia
The Australian Water Treatment Chemicals Market exhibits distinct leadership across its various segments and end-user industries, with specific regions often mirroring the distribution of these core sectors.
Dominant Product Segments:
- Coagulants and Flocculants: This segment consistently leads the market due to its foundational role in virtually all water treatment processes, from municipal potable water purification to industrial wastewater treatment. Key drivers include:
- High Volume Usage: Essential for removing suspended solids and colloids, driving consistent demand.
- Regulatory Compliance: Strict effluent discharge standards necessitate efficient removal of pollutants, bolstering demand for effective coagulants and flocculants.
- Industrial Growth: The expansion of mining and mineral processing, and chemical manufacturing industries, directly correlates with increased demand for these chemicals to manage their wastewater streams.
- Biocides and Disinfectants: This segment commands significant market share, driven by the critical need for microbial control in both potable and industrial water systems. Key drivers include:
- Public Health Concerns: Ensuring the safety of drinking water is paramount, leading to consistent demand for effective disinfectants.
- Industrial Hygiene: Preventing biofouling and microbial contamination in cooling towers, pipelines, and process equipment across various industries is crucial for operational efficiency and product quality.
- Emerging Pathogens: The ongoing threat of waterborne diseases and the emergence of resistant microbial strains spur innovation and demand for advanced biocidal solutions.
- Corrosion and Scale Inhibitors: This segment is vital for the longevity and efficiency of water infrastructure and industrial equipment. Key drivers include:
- Infrastructure Protection: Australia's aging water infrastructure requires continuous protection against corrosion, especially in varying water chemistries.
- Energy Efficiency: Preventing scale buildup in boilers and heat exchangers enhances energy efficiency in power generation and manufacturing.
- Asset Longevity: Extending the operational life of industrial machinery and pipelines represents a significant cost-saving factor.
Dominant End-User Industries:
- Municipal: As the largest consumer of water treatment chemicals for public supply, the municipal sector represents a significant portion of the market. Key drivers include:
- Population Growth: Increasing urban populations necessitate expanded and enhanced water treatment capacities.
- Aging Infrastructure Investment: Government investments in upgrading and maintaining existing water networks drive the demand for a wide array of treatment chemicals.
- Water Recycling Initiatives: Australia's commitment to water recycling programs for non-potable uses further boosts the demand for specialized treatment chemicals.
- Mining and Mineral Processing: This sector is a substantial driver of water treatment chemical demand, particularly for managing large volumes of process water and wastewater. Key drivers include:
- Resource Extraction: The continuous demand for Australia's mineral resources fuels extensive water usage in extraction and processing operations.
- Environmental Regulations: Stringent regulations regarding the discharge of mining-related effluents necessitate sophisticated water treatment solutions.
- Water Scarcity Management: In many mining regions, water conservation and recycling are critical, increasing the demand for advanced treatment chemicals.
- Power Generation: The need for high-purity water for boiler feed and effective cooling tower operation makes this a significant end-user industry. Key drivers include:
- Operational Efficiency: Maintaining clean boiler systems and efficient cooling towers is paramount for power generation efficiency.
- Environmental Compliance: Managing wastewater discharge from power plants requires effective treatment to meet environmental standards.
While specific regional breakdowns of market share are proprietary, it is generally understood that states with significant industrial activity, such as New South Wales and Queensland, alongside those with major urban centers like Victoria, tend to represent the largest consumption hubs for water treatment chemicals in Australia.
Water Treatment Chemicals Market in Australia Product Innovations
The Australian Water Treatment Chemicals Market is witnessing a surge in product innovations focused on enhanced performance, environmental sustainability, and cost-effectiveness. Manufacturers are developing advanced coagulants and flocculants with improved efficacy in removing challenging contaminants and producing drier sludge, reducing disposal costs. The development of novel biocides and disinfectants with lower residual toxicity and resistance-breaking properties is a key trend, addressing evolving microbial threats. Innovations in corrosion and scale inhibitors are leading to more targeted and efficient formulations that protect assets for longer periods. Furthermore, there is a growing emphasis on smart chemicals that can be dosed based on real-time water quality monitoring, optimizing performance and minimizing chemical usage.
Propelling Factors for Water Treatment Chemicals Market in Australia Growth
Several key factors are propelling the growth of the Australian Water Treatment Chemicals Market. Firstly, increasing population and industrialization are driving higher demand for clean water and efficient wastewater management. Secondly, stringent environmental regulations and a growing emphasis on water sustainability are compelling industries and municipalities to adopt advanced treatment solutions. Thirdly, technological advancements leading to more effective and eco-friendly chemicals are making them more attractive. Finally, significant government investments in water infrastructure and water recycling initiatives provide a stable and growing market for these essential chemicals.
Obstacles in the Water Treatment Chemicals Market in Australia Market
Despite robust growth, the Australian Water Treatment Chemicals Market faces several obstacles. High raw material costs and volatile global supply chains can impact pricing and availability. Stringent regulatory approvals for new chemical formulations can create lengthy development and market entry timelines. Furthermore, the significant capital investment required for advanced water treatment infrastructure can sometimes slow down adoption rates, particularly for smaller municipalities or businesses. Intense competition among established players and the emergence of alternative treatment technologies like membrane filtration also present ongoing challenges.
Future Opportunities in Water Treatment Chemicals Market in Australia
The Australian Water Treatment Chemicals Market is ripe with future opportunities. The increasing focus on water reuse and recycling for industrial, agricultural, and urban non-potable applications presents a significant growth avenue. The development and adoption of 'green' and bio-based water treatment chemicals are gaining traction, aligning with sustainability goals. The integration of digital technologies, such as IoT-enabled sensors and AI-driven control systems, for optimized chemical dosing and performance monitoring opens up opportunities for smart chemical solutions and integrated service offerings. Furthermore, emerging industries and the need for specialized water treatment in sectors like advanced manufacturing and renewable energy will create new demand.
Major Players in the Water Treatment Chemicals Market in Australia Ecosystem
- Kemira Oyj
- Coogee
- Ecolab
- SNF
- IWTS Group Pty Ltd
- Solvay
- Buckman
- Aquasol
- Dow
- Solenis
- Ixom
- Albemarle Corporation
- Veolia (Veolia Water Technologies)
Key Developments in Water Treatment Chemicals Market in Australia Industry
- June 2022: Kemira Oyj announced a new collaboration with France-based company Veolia to launch ViviMag technology, designed to recover phosphorus and other valuable resources like iron from sewage sludge, strengthening Kemira's position in the water treatment sector.
- April 2022: Veolia Group announced a partnership with Sydney Water to explore innovation opportunities for developing a robust circular economy, aiming to deliver sustainable and resilient water services to the city.
Strategic Water Treatment Chemicals Market in Australia Market Forecast
The Australian Water Treatment Chemicals Market is poised for continued strategic growth, driven by an escalating demand for sustainable water management solutions. Forecasts indicate robust expansion, fueled by governmental initiatives promoting water recycling, increasing industrial water treatment needs across sectors like mining and chemical manufacturing, and the ongoing necessity for high-purity water in power generation. Innovations in eco-friendly and advanced chemical formulations, coupled with the adoption of digital technologies for optimized performance, will further catalyze market penetration. The market's trajectory is firmly set towards supporting Australia's long-term water security and environmental objectives, presenting significant opportunities for stakeholders invested in this critical sector.
Water Treatment Chemicals Market in Australia Segmentation
-
1. Product Type
- 1.1. Biocides and Disinfectants
- 1.2. Coagulants and Flocculants
- 1.3. Corrosion and Scale Inhibitors
- 1.4. Defoamers and Defoaming Agents
- 1.5. pH Conditioners/Adjusters
- 1.6. Other Product Types
-
2. End-user Industry
- 2.1. Power Generation
- 2.2. Oil and Gas
- 2.3. Chemical Manufacturing
- 2.4. Mining and Mineral Processing
- 2.5. Municipal
- 2.6. Food and Beverage
- 2.7. Pulp and Paper
- 2.8. Other End-user Industries
Water Treatment Chemicals Market in Australia Segmentation By Geography
-
1. North America
- 1.1. United States
- 1.2. Canada
- 1.3. Mexico
-
2. South America
- 2.1. Brazil
- 2.2. Argentina
- 2.3. Rest of South America
-
3. Europe
- 3.1. United Kingdom
- 3.2. Germany
- 3.3. France
- 3.4. Italy
- 3.5. Spain
- 3.6. Russia
- 3.7. Benelux
- 3.8. Nordics
- 3.9. Rest of Europe
-
4. Middle East & Africa
- 4.1. Turkey
- 4.2. Israel
- 4.3. GCC
- 4.4. North Africa
- 4.5. South Africa
- 4.6. Rest of Middle East & Africa
-
5. Asia Pacific
- 5.1. China
- 5.2. India
- 5.3. Japan
- 5.4. South Korea
- 5.5. ASEAN
- 5.6. Oceania
- 5.7. Rest of Asia Pacific
Water Treatment Chemicals Market in Australia Regional Market Share
Geographic Coverage of Water Treatment Chemicals Market in Australia
Water Treatment Chemicals Market in Australia REPORT HIGHLIGHTS
| Aspects | Details |
|---|---|
| Study Period | 2020-2034 |
| Base Year | 2025 |
| Estimated Year | 2026 |
| Forecast Period | 2026-2034 |
| Historical Period | 2020-2025 |
| Growth Rate | CAGR of 3.17% from 2020-2034 |
| Segmentation |
|
Table of Contents
- 1. Introduction
- 1.1. Research Scope
- 1.2. Market Segmentation
- 1.3. Research Objective
- 1.4. Definitions and Assumptions
- 2. Executive Summary
- 2.1. Market Snapshot
- 3. Market Dynamics
- 3.1. Market Drivers
- 3.2. Market Restrains
- 3.3. Market Trends
- 3.4. Market Opportunities
- 4. Market Factor Analysis
- 4.1. Porters Five Forces
- 4.1.1. Bargaining Power of Suppliers
- 4.1.2. Bargaining Power of Buyers
- 4.1.3. Threat of New Entrants
- 4.1.4. Threat of Substitutes
- 4.1.5. Competitive Rivalry
- 4.2. PESTEL analysis
- 4.3. BCG Analysis
- 4.3.1. Stars (High Growth, High Market Share)
- 4.3.2. Cash Cows (Low Growth, High Market Share)
- 4.3.3. Question Mark (High Growth, Low Market Share)
- 4.3.4. Dogs (Low Growth, Low Market Share)
- 4.4. Ansoff Matrix Analysis
- 4.5. Supply Chain Analysis
- 4.6. Regulatory Landscape
- 4.7. Current Market Potential and Opportunity Assessment (TAM–SAM–SOM Framework)
- 4.8. DMV Analyst Note
- 4.1. Porters Five Forces
- 5. Market Analysis, Insights and Forecast 2021-2033
- 5.1. Market Analysis, Insights and Forecast - by Product Type
- 5.1.1. Biocides and Disinfectants
- 5.1.2. Coagulants and Flocculants
- 5.1.3. Corrosion and Scale Inhibitors
- 5.1.4. Defoamers and Defoaming Agents
- 5.1.5. pH Conditioners/Adjusters
- 5.1.6. Other Product Types
- 5.2. Market Analysis, Insights and Forecast - by End-user Industry
- 5.2.1. Power Generation
- 5.2.2. Oil and Gas
- 5.2.3. Chemical Manufacturing
- 5.2.4. Mining and Mineral Processing
- 5.2.5. Municipal
- 5.2.6. Food and Beverage
- 5.2.7. Pulp and Paper
- 5.2.8. Other End-user Industries
- 5.3. Market Analysis, Insights and Forecast - by Region
- 5.3.1. North America
- 5.3.2. South America
- 5.3.3. Europe
- 5.3.4. Middle East & Africa
- 5.3.5. Asia Pacific
- 5.1. Market Analysis, Insights and Forecast - by Product Type
- 6. Global Water Treatment Chemicals Market in Australia Analysis, Insights and Forecast, 2021-2033
- 6.1. Market Analysis, Insights and Forecast - by Product Type
- 6.1.1. Biocides and Disinfectants
- 6.1.2. Coagulants and Flocculants
- 6.1.3. Corrosion and Scale Inhibitors
- 6.1.4. Defoamers and Defoaming Agents
- 6.1.5. pH Conditioners/Adjusters
- 6.1.6. Other Product Types
- 6.2. Market Analysis, Insights and Forecast - by End-user Industry
- 6.2.1. Power Generation
- 6.2.2. Oil and Gas
- 6.2.3. Chemical Manufacturing
- 6.2.4. Mining and Mineral Processing
- 6.2.5. Municipal
- 6.2.6. Food and Beverage
- 6.2.7. Pulp and Paper
- 6.2.8. Other End-user Industries
- 6.1. Market Analysis, Insights and Forecast - by Product Type
- 7. North America Water Treatment Chemicals Market in Australia Analysis, Insights and Forecast, 2020-2032
- 7.1. Market Analysis, Insights and Forecast - by Product Type
- 7.1.1. Biocides and Disinfectants
- 7.1.2. Coagulants and Flocculants
- 7.1.3. Corrosion and Scale Inhibitors
- 7.1.4. Defoamers and Defoaming Agents
- 7.1.5. pH Conditioners/Adjusters
- 7.1.6. Other Product Types
- 7.2. Market Analysis, Insights and Forecast - by End-user Industry
- 7.2.1. Power Generation
- 7.2.2. Oil and Gas
- 7.2.3. Chemical Manufacturing
- 7.2.4. Mining and Mineral Processing
- 7.2.5. Municipal
- 7.2.6. Food and Beverage
- 7.2.7. Pulp and Paper
- 7.2.8. Other End-user Industries
- 7.1. Market Analysis, Insights and Forecast - by Product Type
- 8. South America Water Treatment Chemicals Market in Australia Analysis, Insights and Forecast, 2020-2032
- 8.1. Market Analysis, Insights and Forecast - by Product Type
- 8.1.1. Biocides and Disinfectants
- 8.1.2. Coagulants and Flocculants
- 8.1.3. Corrosion and Scale Inhibitors
- 8.1.4. Defoamers and Defoaming Agents
- 8.1.5. pH Conditioners/Adjusters
- 8.1.6. Other Product Types
- 8.2. Market Analysis, Insights and Forecast - by End-user Industry
- 8.2.1. Power Generation
- 8.2.2. Oil and Gas
- 8.2.3. Chemical Manufacturing
- 8.2.4. Mining and Mineral Processing
- 8.2.5. Municipal
- 8.2.6. Food and Beverage
- 8.2.7. Pulp and Paper
- 8.2.8. Other End-user Industries
- 8.1. Market Analysis, Insights and Forecast - by Product Type
- 9. Europe Water Treatment Chemicals Market in Australia Analysis, Insights and Forecast, 2020-2032
- 9.1. Market Analysis, Insights and Forecast - by Product Type
- 9.1.1. Biocides and Disinfectants
- 9.1.2. Coagulants and Flocculants
- 9.1.3. Corrosion and Scale Inhibitors
- 9.1.4. Defoamers and Defoaming Agents
- 9.1.5. pH Conditioners/Adjusters
- 9.1.6. Other Product Types
- 9.2. Market Analysis, Insights and Forecast - by End-user Industry
- 9.2.1. Power Generation
- 9.2.2. Oil and Gas
- 9.2.3. Chemical Manufacturing
- 9.2.4. Mining and Mineral Processing
- 9.2.5. Municipal
- 9.2.6. Food and Beverage
- 9.2.7. Pulp and Paper
- 9.2.8. Other End-user Industries
- 9.1. Market Analysis, Insights and Forecast - by Product Type
- 10. Middle East & Africa Water Treatment Chemicals Market in Australia Analysis, Insights and Forecast, 2020-2032
- 10.1. Market Analysis, Insights and Forecast - by Product Type
- 10.1.1. Biocides and Disinfectants
- 10.1.2. Coagulants and Flocculants
- 10.1.3. Corrosion and Scale Inhibitors
- 10.1.4. Defoamers and Defoaming Agents
- 10.1.5. pH Conditioners/Adjusters
- 10.1.6. Other Product Types
- 10.2. Market Analysis, Insights and Forecast - by End-user Industry
- 10.2.1. Power Generation
- 10.2.2. Oil and Gas
- 10.2.3. Chemical Manufacturing
- 10.2.4. Mining and Mineral Processing
- 10.2.5. Municipal
- 10.2.6. Food and Beverage
- 10.2.7. Pulp and Paper
- 10.2.8. Other End-user Industries
- 10.1. Market Analysis, Insights and Forecast - by Product Type
- 11. Asia Pacific Water Treatment Chemicals Market in Australia Analysis, Insights and Forecast, 2020-2032
- 11.1. Market Analysis, Insights and Forecast - by Product Type
- 11.1.1. Biocides and Disinfectants
- 11.1.2. Coagulants and Flocculants
- 11.1.3. Corrosion and Scale Inhibitors
- 11.1.4. Defoamers and Defoaming Agents
- 11.1.5. pH Conditioners/Adjusters
- 11.1.6. Other Product Types
- 11.2. Market Analysis, Insights and Forecast - by End-user Industry
- 11.2.1. Power Generation
- 11.2.2. Oil and Gas
- 11.2.3. Chemical Manufacturing
- 11.2.4. Mining and Mineral Processing
- 11.2.5. Municipal
- 11.2.6. Food and Beverage
- 11.2.7. Pulp and Paper
- 11.2.8. Other End-user Industries
- 11.1. Market Analysis, Insights and Forecast - by Product Type
- 12. Competitive Analysis
- 12.1. Company Profiles
- 12.1.1 Kemira Oyj
- 12.1.1.1. Company Overview
- 12.1.1.2. Products
- 12.1.1.3. Company Financials
- 12.1.1.4. SWOT Analysis
- 12.1.2 Coogee
- 12.1.2.1. Company Overview
- 12.1.2.2. Products
- 12.1.2.3. Company Financials
- 12.1.2.4. SWOT Analysis
- 12.1.3 Ecolab
- 12.1.3.1. Company Overview
- 12.1.3.2. Products
- 12.1.3.3. Company Financials
- 12.1.3.4. SWOT Analysis
- 12.1.4 SNF
- 12.1.4.1. Company Overview
- 12.1.4.2. Products
- 12.1.4.3. Company Financials
- 12.1.4.4. SWOT Analysis
- 12.1.5 IWTS Group Pty Ltd
- 12.1.5.1. Company Overview
- 12.1.5.2. Products
- 12.1.5.3. Company Financials
- 12.1.5.4. SWOT Analysis
- 12.1.6 Solvay
- 12.1.6.1. Company Overview
- 12.1.6.2. Products
- 12.1.6.3. Company Financials
- 12.1.6.4. SWOT Analysis
- 12.1.7 Buckman
- 12.1.7.1. Company Overview
- 12.1.7.2. Products
- 12.1.7.3. Company Financials
- 12.1.7.4. SWOT Analysis
- 12.1.8 Aquasol
- 12.1.8.1. Company Overview
- 12.1.8.2. Products
- 12.1.8.3. Company Financials
- 12.1.8.4. SWOT Analysis
- 12.1.9 Dow
- 12.1.9.1. Company Overview
- 12.1.9.2. Products
- 12.1.9.3. Company Financials
- 12.1.9.4. SWOT Analysis
- 12.1.10 Solenis
- 12.1.10.1. Company Overview
- 12.1.10.2. Products
- 12.1.10.3. Company Financials
- 12.1.10.4. SWOT Analysis
- 12.1.11 Ixom
- 12.1.11.1. Company Overview
- 12.1.11.2. Products
- 12.1.11.3. Company Financials
- 12.1.11.4. SWOT Analysis
- 12.1.12 Albemarle Corporation
- 12.1.12.1. Company Overview
- 12.1.12.2. Products
- 12.1.12.3. Company Financials
- 12.1.12.4. SWOT Analysis
- 12.1.13 Veolia (Veolia Water Technologies)
- 12.1.13.1. Company Overview
- 12.1.13.2. Products
- 12.1.13.3. Company Financials
- 12.1.13.4. SWOT Analysis
- 12.1.1 Kemira Oyj
- 12.2. Market Entropy
- 12.2.1 Company's Key Areas Served
- 12.2.2 Recent Developments
- 12.3. Company Market Share Analysis 2025
- 12.3.1 Top 5 Companies Market Share Analysis
- 12.3.2 Top 3 Companies Market Share Analysis
- 12.4. List of Potential Customers
- 13. Research Methodology
List of Figures
- Figure 1: Global Water Treatment Chemicals Market in Australia Revenue Breakdown (Million, %) by Region 2025 & 2033
- Figure 2: Global Water Treatment Chemicals Market in Australia Volume Breakdown (K Tons, %) by Region 2025 & 2033
- Figure 3: North America Water Treatment Chemicals Market in Australia Revenue (Million), by Product Type 2025 & 2033
- Figure 4: North America Water Treatment Chemicals Market in Australia Volume (K Tons), by Product Type 2025 & 2033
- Figure 5: North America Water Treatment Chemicals Market in Australia Revenue Share (%), by Product Type 2025 & 2033
- Figure 6: North America Water Treatment Chemicals Market in Australia Volume Share (%), by Product Type 2025 & 2033
- Figure 7: North America Water Treatment Chemicals Market in Australia Revenue (Million), by End-user Industry 2025 & 2033
- Figure 8: North America Water Treatment Chemicals Market in Australia Volume (K Tons), by End-user Industry 2025 & 2033
- Figure 9: North America Water Treatment Chemicals Market in Australia Revenue Share (%), by End-user Industry 2025 & 2033
- Figure 10: North America Water Treatment Chemicals Market in Australia Volume Share (%), by End-user Industry 2025 & 2033
- Figure 11: North America Water Treatment Chemicals Market in Australia Revenue (Million), by Country 2025 & 2033
- Figure 12: North America Water Treatment Chemicals Market in Australia Volume (K Tons), by Country 2025 & 2033
- Figure 13: North America Water Treatment Chemicals Market in Australia Revenue Share (%), by Country 2025 & 2033
- Figure 14: North America Water Treatment Chemicals Market in Australia Volume Share (%), by Country 2025 & 2033
- Figure 15: South America Water Treatment Chemicals Market in Australia Revenue (Million), by Product Type 2025 & 2033
- Figure 16: South America Water Treatment Chemicals Market in Australia Volume (K Tons), by Product Type 2025 & 2033
- Figure 17: South America Water Treatment Chemicals Market in Australia Revenue Share (%), by Product Type 2025 & 2033
- Figure 18: South America Water Treatment Chemicals Market in Australia Volume Share (%), by Product Type 2025 & 2033
- Figure 19: South America Water Treatment Chemicals Market in Australia Revenue (Million), by End-user Industry 2025 & 2033
- Figure 20: South America Water Treatment Chemicals Market in Australia Volume (K Tons), by End-user Industry 2025 & 2033
- Figure 21: South America Water Treatment Chemicals Market in Australia Revenue Share (%), by End-user Industry 2025 & 2033
- Figure 22: South America Water Treatment Chemicals Market in Australia Volume Share (%), by End-user Industry 2025 & 2033
- Figure 23: South America Water Treatment Chemicals Market in Australia Revenue (Million), by Country 2025 & 2033
- Figure 24: South America Water Treatment Chemicals Market in Australia Volume (K Tons), by Country 2025 & 2033
- Figure 25: South America Water Treatment Chemicals Market in Australia Revenue Share (%), by Country 2025 & 2033
- Figure 26: South America Water Treatment Chemicals Market in Australia Volume Share (%), by Country 2025 & 2033
- Figure 27: Europe Water Treatment Chemicals Market in Australia Revenue (Million), by Product Type 2025 & 2033
- Figure 28: Europe Water Treatment Chemicals Market in Australia Volume (K Tons), by Product Type 2025 & 2033
- Figure 29: Europe Water Treatment Chemicals Market in Australia Revenue Share (%), by Product Type 2025 & 2033
- Figure 30: Europe Water Treatment Chemicals Market in Australia Volume Share (%), by Product Type 2025 & 2033
- Figure 31: Europe Water Treatment Chemicals Market in Australia Revenue (Million), by End-user Industry 2025 & 2033
- Figure 32: Europe Water Treatment Chemicals Market in Australia Volume (K Tons), by End-user Industry 2025 & 2033
- Figure 33: Europe Water Treatment Chemicals Market in Australia Revenue Share (%), by End-user Industry 2025 & 2033
- Figure 34: Europe Water Treatment Chemicals Market in Australia Volume Share (%), by End-user Industry 2025 & 2033
- Figure 35: Europe Water Treatment Chemicals Market in Australia Revenue (Million), by Country 2025 & 2033
- Figure 36: Europe Water Treatment Chemicals Market in Australia Volume (K Tons), by Country 2025 & 2033
- Figure 37: Europe Water Treatment Chemicals Market in Australia Revenue Share (%), by Country 2025 & 2033
- Figure 38: Europe Water Treatment Chemicals Market in Australia Volume Share (%), by Country 2025 & 2033
- Figure 39: Middle East & Africa Water Treatment Chemicals Market in Australia Revenue (Million), by Product Type 2025 & 2033
- Figure 40: Middle East & Africa Water Treatment Chemicals Market in Australia Volume (K Tons), by Product Type 2025 & 2033
- Figure 41: Middle East & Africa Water Treatment Chemicals Market in Australia Revenue Share (%), by Product Type 2025 & 2033
- Figure 42: Middle East & Africa Water Treatment Chemicals Market in Australia Volume Share (%), by Product Type 2025 & 2033
- Figure 43: Middle East & Africa Water Treatment Chemicals Market in Australia Revenue (Million), by End-user Industry 2025 & 2033
- Figure 44: Middle East & Africa Water Treatment Chemicals Market in Australia Volume (K Tons), by End-user Industry 2025 & 2033
- Figure 45: Middle East & Africa Water Treatment Chemicals Market in Australia Revenue Share (%), by End-user Industry 2025 & 2033
- Figure 46: Middle East & Africa Water Treatment Chemicals Market in Australia Volume Share (%), by End-user Industry 2025 & 2033
- Figure 47: Middle East & Africa Water Treatment Chemicals Market in Australia Revenue (Million), by Country 2025 & 2033
- Figure 48: Middle East & Africa Water Treatment Chemicals Market in Australia Volume (K Tons), by Country 2025 & 2033
- Figure 49: Middle East & Africa Water Treatment Chemicals Market in Australia Revenue Share (%), by Country 2025 & 2033
- Figure 50: Middle East & Africa Water Treatment Chemicals Market in Australia Volume Share (%), by Country 2025 & 2033
- Figure 51: Asia Pacific Water Treatment Chemicals Market in Australia Revenue (Million), by Product Type 2025 & 2033
- Figure 52: Asia Pacific Water Treatment Chemicals Market in Australia Volume (K Tons), by Product Type 2025 & 2033
- Figure 53: Asia Pacific Water Treatment Chemicals Market in Australia Revenue Share (%), by Product Type 2025 & 2033
- Figure 54: Asia Pacific Water Treatment Chemicals Market in Australia Volume Share (%), by Product Type 2025 & 2033
- Figure 55: Asia Pacific Water Treatment Chemicals Market in Australia Revenue (Million), by End-user Industry 2025 & 2033
- Figure 56: Asia Pacific Water Treatment Chemicals Market in Australia Volume (K Tons), by End-user Industry 2025 & 2033
- Figure 57: Asia Pacific Water Treatment Chemicals Market in Australia Revenue Share (%), by End-user Industry 2025 & 2033
- Figure 58: Asia Pacific Water Treatment Chemicals Market in Australia Volume Share (%), by End-user Industry 2025 & 2033
- Figure 59: Asia Pacific Water Treatment Chemicals Market in Australia Revenue (Million), by Country 2025 & 2033
- Figure 60: Asia Pacific Water Treatment Chemicals Market in Australia Volume (K Tons), by Country 2025 & 2033
- Figure 61: Asia Pacific Water Treatment Chemicals Market in Australia Revenue Share (%), by Country 2025 & 2033
- Figure 62: Asia Pacific Water Treatment Chemicals Market in Australia Volume Share (%), by Country 2025 & 2033
List of Tables
- Table 1: Global Water Treatment Chemicals Market in Australia Revenue Million Forecast, by Product Type 2020 & 2033
- Table 2: Global Water Treatment Chemicals Market in Australia Volume K Tons Forecast, by Product Type 2020 & 2033
- Table 3: Global Water Treatment Chemicals Market in Australia Revenue Million Forecast, by End-user Industry 2020 & 2033
- Table 4: Global Water Treatment Chemicals Market in Australia Volume K Tons Forecast, by End-user Industry 2020 & 2033
- Table 5: Global Water Treatment Chemicals Market in Australia Revenue Million Forecast, by Region 2020 & 2033
- Table 6: Global Water Treatment Chemicals Market in Australia Volume K Tons Forecast, by Region 2020 & 2033
- Table 7: Global Water Treatment Chemicals Market in Australia Revenue Million Forecast, by Product Type 2020 & 2033
- Table 8: Global Water Treatment Chemicals Market in Australia Volume K Tons Forecast, by Product Type 2020 & 2033
- Table 9: Global Water Treatment Chemicals Market in Australia Revenue Million Forecast, by End-user Industry 2020 & 2033
- Table 10: Global Water Treatment Chemicals Market in Australia Volume K Tons Forecast, by End-user Industry 2020 & 2033
- Table 11: Global Water Treatment Chemicals Market in Australia Revenue Million Forecast, by Country 2020 & 2033
- Table 12: Global Water Treatment Chemicals Market in Australia Volume K Tons Forecast, by Country 2020 & 2033
- Table 13: United States Water Treatment Chemicals Market in Australia Revenue (Million) Forecast, by Application 2020 & 2033
- Table 14: United States Water Treatment Chemicals Market in Australia Volume (K Tons) Forecast, by Application 2020 & 2033
- Table 15: Canada Water Treatment Chemicals Market in Australia Revenue (Million) Forecast, by Application 2020 & 2033
- Table 16: Canada Water Treatment Chemicals Market in Australia Volume (K Tons) Forecast, by Application 2020 & 2033
- Table 17: Mexico Water Treatment Chemicals Market in Australia Revenue (Million) Forecast, by Application 2020 & 2033
- Table 18: Mexico Water Treatment Chemicals Market in Australia Volume (K Tons) Forecast, by Application 2020 & 2033
- Table 19: Global Water Treatment Chemicals Market in Australia Revenue Million Forecast, by Product Type 2020 & 2033
- Table 20: Global Water Treatment Chemicals Market in Australia Volume K Tons Forecast, by Product Type 2020 & 2033
- Table 21: Global Water Treatment Chemicals Market in Australia Revenue Million Forecast, by End-user Industry 2020 & 2033
- Table 22: Global Water Treatment Chemicals Market in Australia Volume K Tons Forecast, by End-user Industry 2020 & 2033
- Table 23: Global Water Treatment Chemicals Market in Australia Revenue Million Forecast, by Country 2020 & 2033
- Table 24: Global Water Treatment Chemicals Market in Australia Volume K Tons Forecast, by Country 2020 & 2033
- Table 25: Brazil Water Treatment Chemicals Market in Australia Revenue (Million) Forecast, by Application 2020 & 2033
- Table 26: Brazil Water Treatment Chemicals Market in Australia Volume (K Tons) Forecast, by Application 2020 & 2033
- Table 27: Argentina Water Treatment Chemicals Market in Australia Revenue (Million) Forecast, by Application 2020 & 2033
- Table 28: Argentina Water Treatment Chemicals Market in Australia Volume (K Tons) Forecast, by Application 2020 & 2033
- Table 29: Rest of South America Water Treatment Chemicals Market in Australia Revenue (Million) Forecast, by Application 2020 & 2033
- Table 30: Rest of South America Water Treatment Chemicals Market in Australia Volume (K Tons) Forecast, by Application 2020 & 2033
- Table 31: Global Water Treatment Chemicals Market in Australia Revenue Million Forecast, by Product Type 2020 & 2033
- Table 32: Global Water Treatment Chemicals Market in Australia Volume K Tons Forecast, by Product Type 2020 & 2033
- Table 33: Global Water Treatment Chemicals Market in Australia Revenue Million Forecast, by End-user Industry 2020 & 2033
- Table 34: Global Water Treatment Chemicals Market in Australia Volume K Tons Forecast, by End-user Industry 2020 & 2033
- Table 35: Global Water Treatment Chemicals Market in Australia Revenue Million Forecast, by Country 2020 & 2033
- Table 36: Global Water Treatment Chemicals Market in Australia Volume K Tons Forecast, by Country 2020 & 2033
- Table 37: United Kingdom Water Treatment Chemicals Market in Australia Revenue (Million) Forecast, by Application 2020 & 2033
- Table 38: United Kingdom Water Treatment Chemicals Market in Australia Volume (K Tons) Forecast, by Application 2020 & 2033
- Table 39: Germany Water Treatment Chemicals Market in Australia Revenue (Million) Forecast, by Application 2020 & 2033
- Table 40: Germany Water Treatment Chemicals Market in Australia Volume (K Tons) Forecast, by Application 2020 & 2033
- Table 41: France Water Treatment Chemicals Market in Australia Revenue (Million) Forecast, by Application 2020 & 2033
- Table 42: France Water Treatment Chemicals Market in Australia Volume (K Tons) Forecast, by Application 2020 & 2033
- Table 43: Italy Water Treatment Chemicals Market in Australia Revenue (Million) Forecast, by Application 2020 & 2033
- Table 44: Italy Water Treatment Chemicals Market in Australia Volume (K Tons) Forecast, by Application 2020 & 2033
- Table 45: Spain Water Treatment Chemicals Market in Australia Revenue (Million) Forecast, by Application 2020 & 2033
- Table 46: Spain Water Treatment Chemicals Market in Australia Volume (K Tons) Forecast, by Application 2020 & 2033
- Table 47: Russia Water Treatment Chemicals Market in Australia Revenue (Million) Forecast, by Application 2020 & 2033
- Table 48: Russia Water Treatment Chemicals Market in Australia Volume (K Tons) Forecast, by Application 2020 & 2033
- Table 49: Benelux Water Treatment Chemicals Market in Australia Revenue (Million) Forecast, by Application 2020 & 2033
- Table 50: Benelux Water Treatment Chemicals Market in Australia Volume (K Tons) Forecast, by Application 2020 & 2033
- Table 51: Nordics Water Treatment Chemicals Market in Australia Revenue (Million) Forecast, by Application 2020 & 2033
- Table 52: Nordics Water Treatment Chemicals Market in Australia Volume (K Tons) Forecast, by Application 2020 & 2033
- Table 53: Rest of Europe Water Treatment Chemicals Market in Australia Revenue (Million) Forecast, by Application 2020 & 2033
- Table 54: Rest of Europe Water Treatment Chemicals Market in Australia Volume (K Tons) Forecast, by Application 2020 & 2033
- Table 55: Global Water Treatment Chemicals Market in Australia Revenue Million Forecast, by Product Type 2020 & 2033
- Table 56: Global Water Treatment Chemicals Market in Australia Volume K Tons Forecast, by Product Type 2020 & 2033
- Table 57: Global Water Treatment Chemicals Market in Australia Revenue Million Forecast, by End-user Industry 2020 & 2033
- Table 58: Global Water Treatment Chemicals Market in Australia Volume K Tons Forecast, by End-user Industry 2020 & 2033
- Table 59: Global Water Treatment Chemicals Market in Australia Revenue Million Forecast, by Country 2020 & 2033
- Table 60: Global Water Treatment Chemicals Market in Australia Volume K Tons Forecast, by Country 2020 & 2033
- Table 61: Turkey Water Treatment Chemicals Market in Australia Revenue (Million) Forecast, by Application 2020 & 2033
- Table 62: Turkey Water Treatment Chemicals Market in Australia Volume (K Tons) Forecast, by Application 2020 & 2033
- Table 63: Israel Water Treatment Chemicals Market in Australia Revenue (Million) Forecast, by Application 2020 & 2033
- Table 64: Israel Water Treatment Chemicals Market in Australia Volume (K Tons) Forecast, by Application 2020 & 2033
- Table 65: GCC Water Treatment Chemicals Market in Australia Revenue (Million) Forecast, by Application 2020 & 2033
- Table 66: GCC Water Treatment Chemicals Market in Australia Volume (K Tons) Forecast, by Application 2020 & 2033
- Table 67: North Africa Water Treatment Chemicals Market in Australia Revenue (Million) Forecast, by Application 2020 & 2033
- Table 68: North Africa Water Treatment Chemicals Market in Australia Volume (K Tons) Forecast, by Application 2020 & 2033
- Table 69: South Africa Water Treatment Chemicals Market in Australia Revenue (Million) Forecast, by Application 2020 & 2033
- Table 70: South Africa Water Treatment Chemicals Market in Australia Volume (K Tons) Forecast, by Application 2020 & 2033
- Table 71: Rest of Middle East & Africa Water Treatment Chemicals Market in Australia Revenue (Million) Forecast, by Application 2020 & 2033
- Table 72: Rest of Middle East & Africa Water Treatment Chemicals Market in Australia Volume (K Tons) Forecast, by Application 2020 & 2033
- Table 73: Global Water Treatment Chemicals Market in Australia Revenue Million Forecast, by Product Type 2020 & 2033
- Table 74: Global Water Treatment Chemicals Market in Australia Volume K Tons Forecast, by Product Type 2020 & 2033
- Table 75: Global Water Treatment Chemicals Market in Australia Revenue Million Forecast, by End-user Industry 2020 & 2033
- Table 76: Global Water Treatment Chemicals Market in Australia Volume K Tons Forecast, by End-user Industry 2020 & 2033
- Table 77: Global Water Treatment Chemicals Market in Australia Revenue Million Forecast, by Country 2020 & 2033
- Table 78: Global Water Treatment Chemicals Market in Australia Volume K Tons Forecast, by Country 2020 & 2033
- Table 79: China Water Treatment Chemicals Market in Australia Revenue (Million) Forecast, by Application 2020 & 2033
- Table 80: China Water Treatment Chemicals Market in Australia Volume (K Tons) Forecast, by Application 2020 & 2033
- Table 81: India Water Treatment Chemicals Market in Australia Revenue (Million) Forecast, by Application 2020 & 2033
- Table 82: India Water Treatment Chemicals Market in Australia Volume (K Tons) Forecast, by Application 2020 & 2033
- Table 83: Japan Water Treatment Chemicals Market in Australia Revenue (Million) Forecast, by Application 2020 & 2033
- Table 84: Japan Water Treatment Chemicals Market in Australia Volume (K Tons) Forecast, by Application 2020 & 2033
- Table 85: South Korea Water Treatment Chemicals Market in Australia Revenue (Million) Forecast, by Application 2020 & 2033
- Table 86: South Korea Water Treatment Chemicals Market in Australia Volume (K Tons) Forecast, by Application 2020 & 2033
- Table 87: ASEAN Water Treatment Chemicals Market in Australia Revenue (Million) Forecast, by Application 2020 & 2033
- Table 88: ASEAN Water Treatment Chemicals Market in Australia Volume (K Tons) Forecast, by Application 2020 & 2033
- Table 89: Oceania Water Treatment Chemicals Market in Australia Revenue (Million) Forecast, by Application 2020 & 2033
- Table 90: Oceania Water Treatment Chemicals Market in Australia Volume (K Tons) Forecast, by Application 2020 & 2033
- Table 91: Rest of Asia Pacific Water Treatment Chemicals Market in Australia Revenue (Million) Forecast, by Application 2020 & 2033
- Table 92: Rest of Asia Pacific Water Treatment Chemicals Market in Australia Volume (K Tons) Forecast, by Application 2020 & 2033
Frequently Asked Questions
1. What is the projected Compound Annual Growth Rate (CAGR) of the Water Treatment Chemicals Market in Australia?
The projected CAGR is approximately 3.17%.
2. Which companies are prominent players in the Water Treatment Chemicals Market in Australia?
Key companies in the market include Kemira Oyj, Coogee, Ecolab, SNF, IWTS Group Pty Ltd, Solvay, Buckman, Aquasol, Dow, Solenis, Ixom, Albemarle Corporation, Veolia (Veolia Water Technologies).
3. What are the main segments of the Water Treatment Chemicals Market in Australia?
The market segments include Product Type, End-user Industry.
4. Can you provide details about the market size?
The market size is estimated to be USD 467.75 Million as of 2022.
5. What are some drivers contributing to market growth?
Rising Groundwater and Surface Water Pollution; Growing Demand From Power and Industrial Applications; Increasing Government Intervention in Reliable Wastewater Management.
6. What are the notable trends driving market growth?
Municipal End-user Industry to Dominate the Market.
7. Are there any restraints impacting market growth?
Hazardous Nature of Hydrazine; Emerging Alternatives to Water Treatment Chemicals.
8. Can you provide examples of recent developments in the market?
In June 2022, Kemira Oyj announced a new collaboration with a France-based company, Veolia, to launch a new technology named ViviMag. This technology can recover phosphorus and other valuable resources, such as iron, from sewage sludge. Phosphorus causes the overfertilization of the surface waters if not removed properly, causing a major environmental problem. This new technology will help Kemira OYJ strengthen its position in the water treatment sector.
9. What pricing options are available for accessing the report?
Pricing options include single-user, multi-user, and enterprise licenses priced at USD 3,950, USD 4,950, and USD 6,950 respectively.
10. Is the market size provided in terms of value or volume?
The market size is provided in terms of value, measured in Million and volume, measured in K Tons.
11. Are there any specific market keywords associated with the report?
Yes, the market keyword associated with the report is "Water Treatment Chemicals Market in Australia," which aids in identifying and referencing the specific market segment covered.
12. How do I determine which pricing option suits my needs best?
The pricing options vary based on user requirements and access needs. Individual users may opt for single-user licenses, while businesses requiring broader access may choose multi-user or enterprise licenses for cost-effective access to the report.
13. Are there any additional resources or data provided in the Water Treatment Chemicals Market in Australia report?
While the report offers comprehensive insights, it's advisable to review the specific contents or supplementary materials provided to ascertain if additional resources or data are available.
14. How can I stay updated on further developments or reports in the Water Treatment Chemicals Market in Australia?
To stay informed about further developments, trends, and reports in the Water Treatment Chemicals Market in Australia, consider subscribing to industry newsletters, following relevant companies and organizations, or regularly checking reputable industry news sources and publications.
Methodology
Step 1 - Identification of Relevant Samples Size from Population Database


Step 2 - Approaches for Defining Global Market Size (Value, Volume* & Price*)

Note*: In applicable scenarios
Step 3 - Data Sources
Primary Research
- Web Analytics
- Survey Reports
- Research Institute
- Latest Research Reports
- Opinion Leaders
Secondary Research
- Annual Reports
- White Paper
- Latest Press Release
- Industry Association
- Paid Database
- Investor Presentations

Step 4 - Data Triangulation
Involves using different sources of information in order to increase the validity of a study
These sources are likely to be stakeholders in a program - participants, other researchers, program staff, other community members, and so on.
Then we put all data in single framework & apply various statistical tools to find out the dynamic on the market.
During the analysis stage, feedback from the stakeholder groups would be compared to determine areas of agreement as well as areas of divergence