

Key Insights
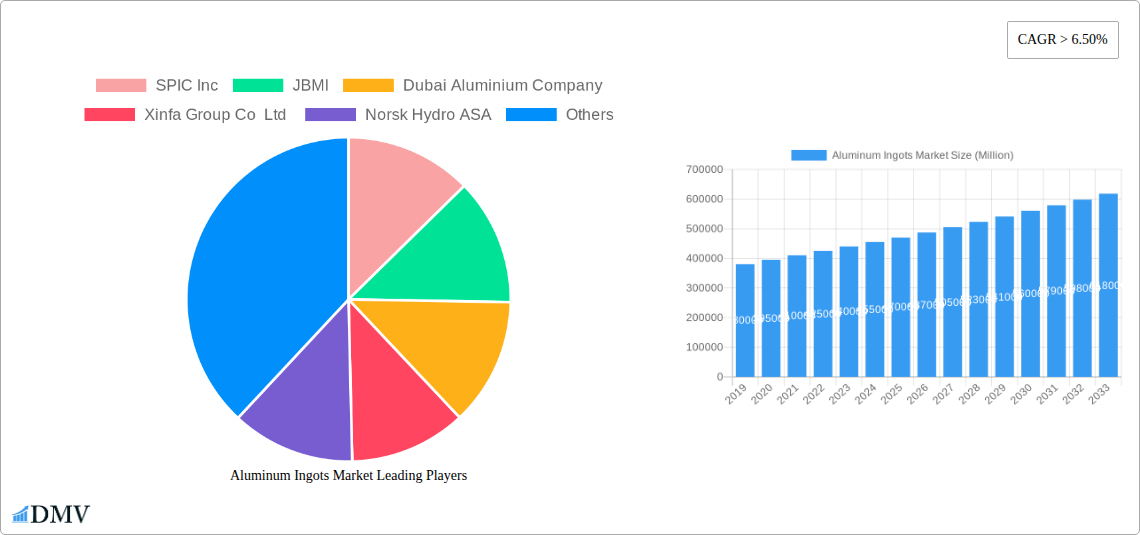
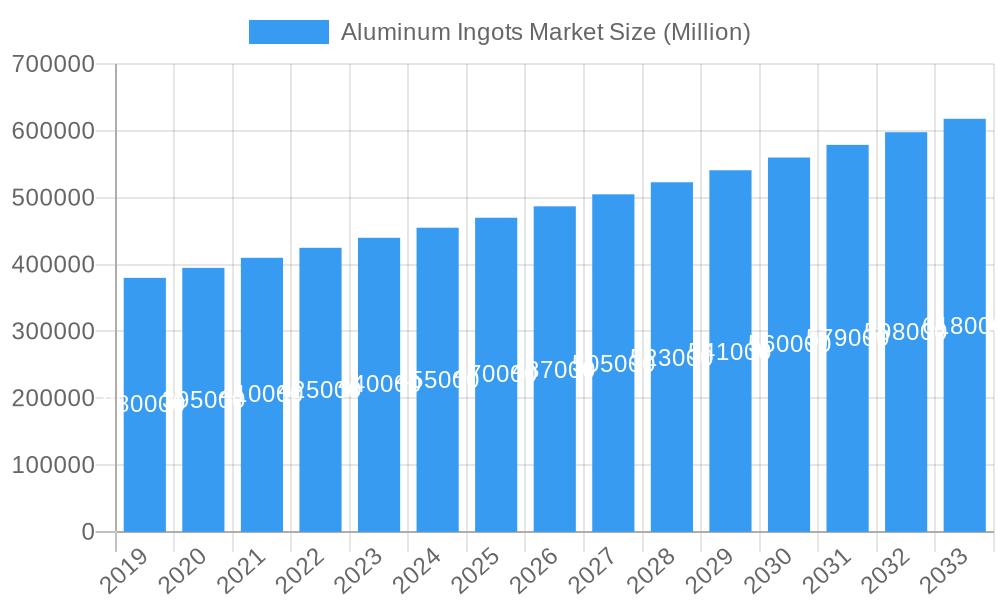
The global Aluminum Ingots market is poised for robust expansion, projected to surpass USD 500,000 million by 2033, fueled by an impressive Compound Annual Growth Rate (CAGR) exceeding 6.50%. This dynamic growth is primarily driven by the escalating demand from key end-user industries such as automotive, aerospace, and building and construction. The automotive sector, in particular, is witnessing a significant surge in aluminum ingot consumption due to its lightweight properties, which enhance fuel efficiency and support the growing production of electric vehicles. Similarly, the aerospace industry's continuous need for high-strength, low-weight materials for aircraft components further bolsters market demand. The semiconductor and electrical and electronics sectors also contribute substantially to the market's upward trajectory, driven by the miniaturization and increased power demands of modern electronic devices.
Aluminum Ingots Market Market Size (In Billion)
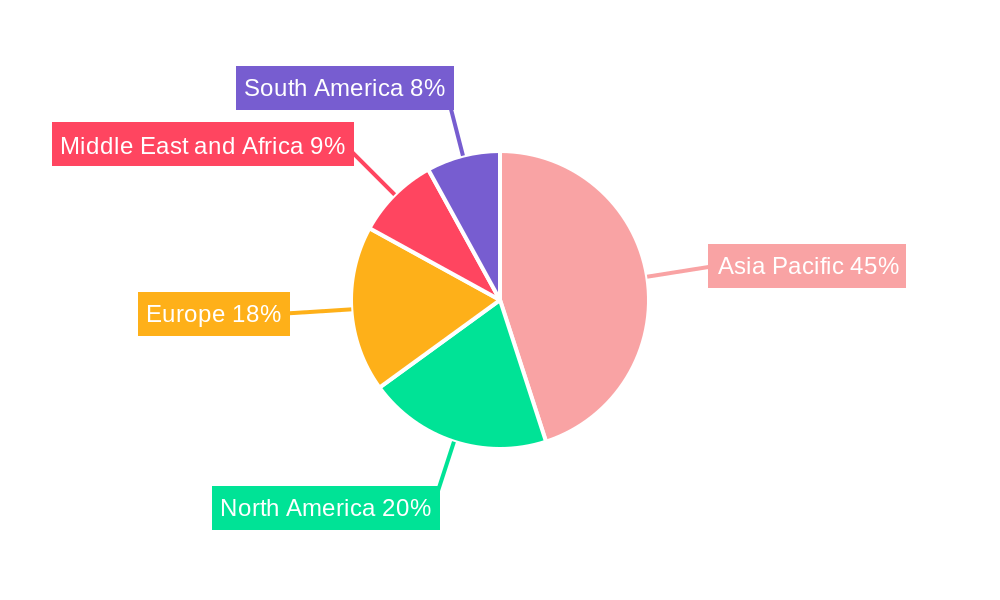
Several key trends are shaping the aluminum ingot landscape. The increasing focus on sustainability and recyclability is a significant driver, with recycled aluminum ingots gaining traction as a more environmentally friendly alternative. Technological advancements in smelting and refining processes are also contributing to improved efficiency and reduced environmental impact, further stimulating market growth. However, the market faces certain restraints, including fluctuating raw material prices (bauxite) and energy costs, which can impact production expenses and profit margins. Geopolitical factors and trade policies can also introduce volatility. The Asia Pacific region, led by China and India, is expected to dominate the market in terms of both production and consumption, owing to its large industrial base and growing infrastructure development.
Aluminum Ingots Market Company Market Share
Unlock the Future of Global Aluminum Ingots: Comprehensive Market Analysis & Forecast (2019–2033)
Dive deep into the dynamic Aluminum Ingots Market with our meticulously crafted report, offering unparalleled insights for stakeholders navigating the global aluminum supply chain. This comprehensive analysis spans the Historical Period (2019–2024), the Base Year (2025), and projects trends through the Forecast Period (2025–2033). Discover key market drivers, emerging opportunities, and strategic imperatives shaping the future of aluminum production and consumption. Optimize your investment decisions with data-driven forecasts and a thorough understanding of this vital industrial commodity.
Aluminum Ingots Market Market Composition & Trends
The Aluminum Ingots Market is characterized by a moderate concentration, with a few dominant players holding significant market share, estimated at approximately 65%. Innovation is primarily driven by advancements in smelting technologies, energy efficiency, and the development of specialized alloy ingots. Regulatory landscapes globally are increasingly focused on sustainability, carbon emissions reduction, and ethical sourcing, influencing production processes and raw material procurement. Substitute products, such as steel and advanced composites, pose a competitive challenge, particularly in specific high-strength applications, though aluminum's lightweight properties and recyclability offer distinct advantages. End-user profiles are diverse and evolving, with the Automotive, Aerospace, Building and Construction, and Electrical and Electronics sectors being primary consumers. M&A activities have been strategic, aimed at consolidating market presence and expanding production capacities. Deal values in recent years have reached an estimated USD 500 Million, reflecting the industry's ongoing consolidation and investment in growth.
- Market Share Distribution: Top 5 players collectively hold ~55% market share.
- Innovation Catalysts: Energy-efficient smelting, advanced alloying, recycling technologies.
- Regulatory Focus: Carbon footprint reduction, sustainability standards, trade policies.
- Substitute Products: Steel, composites, magnesium alloys.
- End-User Dominance: Automotive, Building & Construction, Electrical & Electronics.
- M&A Deal Values (Estimated): USD 500 Million (average annual)
Aluminum Ingots Market Industry Evolution
The Aluminum Ingots Market has witnessed a transformative evolution driven by a confluence of technological advancements, shifting global economic landscapes, and evolving consumer demands. Over the Study Period (2019–2033), the industry has navigated significant disruptions, including supply chain volatility and the imperative for sustainable production. Market growth trajectories have been consistently upward, projected at a Compound Annual Growth Rate (CAGR) of approximately 4.5% from 2025 to 2033. Technological advancements have been central to this growth, with increased adoption of inert anode technology and more efficient electrolysis processes, aiming to reduce energy consumption and environmental impact. The development of specialized aluminum alloys tailored for specific applications, such as high-strength alloys for the automotive sector and corrosion-resistant grades for construction, has further propelled market expansion. Consumer demand is increasingly influenced by the circular economy, pushing for higher recycled content in aluminum products. This has spurred investments in advanced recycling infrastructure and technologies, creating a closed-loop system that minimizes waste and conserves resources. The integration of digital technologies, including AI and IoT in smelter operations, has enhanced efficiency, predictive maintenance, and overall production optimization. The Semiconductor industry, while a smaller segment, is also contributing to market growth due to the increasing demand for aluminum components in advanced electronic devices. Regulatory shifts, particularly those focused on reducing greenhouse gas emissions, have also played a pivotal role, encouraging producers to invest in greener technologies and explore alternative energy sources for smelting operations, which constitute a significant portion of the energy-intensive production process. This ongoing evolution signifies a market that is not only responding to current demands but also proactively shaping a more sustainable and technologically advanced future.
Leading Regions, Countries, or Segments in Aluminum Ingots Market
The Aluminum Ingots Market is extensively influenced by regional dynamics and the specific demands of various End-user Industries, with Building and Construction emerging as a dominant segment, projected to account for approximately 30% of the global market share by 2025. Asia-Pacific, particularly China, spearheads global production and consumption, driven by robust infrastructure development and a rapidly expanding manufacturing base. Investment trends in this region are heavily skewed towards expanding smelting capacities and upgrading existing facilities to meet international standards. Regulatory support in countries like China and India has historically favored domestic production, though increasingly, sustainability regulations are shaping investment decisions.
Dominant Segment: Building and Construction
- Key Drivers: Urbanization, infrastructure projects, demand for durable and aesthetically pleasing materials, energy-efficient building designs.
- Analysis: The inherent properties of aluminum—lightweight, corrosion resistance, and recyclability—make it an ideal material for architectural applications, including facades, window frames, roofing, and interior finishing. Government initiatives promoting green building and sustainable construction practices further bolster demand for aluminum ingots in this sector. The sheer scale of construction activities in emerging economies fuels consistent demand.
Dominant Region: Asia-Pacific
- Key Drivers: Large-scale manufacturing, high infrastructure spending, growing automotive and electronics industries, favorable government policies.
- Analysis: Asia-Pacific's dominance is attributed to its vast industrial base, particularly in China, which is the world's largest producer and consumer of aluminum. The region's significant investments in new aluminum smelters, coupled with a growing domestic demand from the automotive, aerospace, and electrical and electronics sectors, solidify its leading position. While environmental regulations are tightening, the sheer volume of production and consumption ensures its continued leadership.
Significant End-User Industry: Automotive
- Key Drivers: Lightweighting initiatives for fuel efficiency, electric vehicle (EV) growth, stringent emission standards.
- Analysis: The automotive sector is a major driver of demand for high-purity and specialized aluminum alloys. The global push towards reducing vehicle weight to enhance fuel economy and support the burgeoning EV market is significantly increasing the use of aluminum in body structures, engine components, and battery casings. Stringent emission standards globally are compelling manufacturers to adopt lighter materials, making aluminum ingots a critical component in modern vehicle design.
Emerging End-User Industry: Semiconductor
- Key Drivers: Miniaturization of electronics, increased demand for advanced computing and communication devices, specialized aluminum alloys for heat sinks and casings.
- Analysis: The semiconductor industry, while a smaller segment, is experiencing growth due to the increasing complexity and performance demands of electronic devices. Aluminum's excellent thermal conductivity and lightweight properties make it suitable for components like heat sinks and housings in sensitive electronic equipment, contributing to specialized demand within the aluminum ingots market.
Aluminum Ingots Market Product Innovations
Product innovations in the Aluminum Ingots Market are centered on enhancing material performance and sustainability. Advances in alloying technologies are yielding high-strength, lightweight aluminum alloys crucial for the Automotive and Aerospace sectors, enabling greater fuel efficiency and payload capacity. The development of low-carbon footprint aluminum ingots, achieved through renewable energy integration in smelting and enhanced recycling processes, addresses growing environmental concerns. Performance metrics like tensile strength, yield strength, and fatigue resistance are being continuously improved, with specialized ingots now offering tailored properties for niche applications in Building and Construction and Electrical and Electronics. Unique selling propositions include the ability to produce ingots with significantly reduced GHG emissions, offering a competitive edge in a sustainability-conscious market.
Propelling Factors for Aluminum Ingots Market Growth
The Aluminum Ingots Market is propelled by several key factors. The increasing demand for lightweight materials in the automotive industry to meet fuel efficiency and emissions standards is a primary driver, further amplified by the growth of electric vehicles. Advancements in manufacturing technologies, including energy-efficient smelting processes and improved recycling techniques, are enhancing production viability and sustainability. Robust growth in the Building and Construction sector, particularly in emerging economies, fuels demand for aluminum in facades, windows, and structural components. Furthermore, government initiatives promoting sustainable development and infrastructure expansion globally contribute significantly to market expansion. The inherent recyclability of aluminum and its durability also position it as a preferred material for a circular economy, attracting consistent demand.
- Lightweighting in Automotive: Crucial for fuel efficiency and EV range.
- Sustainable Production: Investments in renewable energy for smelting and advanced recycling.
- Infrastructure Development: Global demand for construction materials.
- Recyclability: Aluminum's circular economy advantage.
- Technological Advancements: Efficiency gains in smelting and alloy development.
Obstacles in the Aluminum Ingots Market Market
Despite its robust growth, the Aluminum Ingots Market faces several obstacles. The industry is energy-intensive, leading to high operational costs and significant carbon footprints, posing challenges for meeting stringent environmental regulations. Volatility in energy prices directly impacts production costs and profitability. Intense global competition, particularly from low-cost producers, creates pricing pressures. Trade policies and tariffs can disrupt established supply chains and impact market access. Furthermore, the availability and cost of primary aluminum raw materials (bauxite, alumina) can fluctuate, affecting overall market stability. Supply chain disruptions, as witnessed in recent global events, can also lead to production delays and increased logistics costs.
- High Energy Intensity: Significant electricity consumption in smelting.
- Price Volatility: Fluctuations in energy and raw material costs.
- Environmental Regulations: Increasing pressure to reduce carbon emissions.
- Global Competition: Price wars and market share battles.
- Supply Chain Vulnerabilities: Disruptions impacting availability and logistics.
Future Opportunities in Aluminum Ingots Market
The Aluminum Ingots Market is ripe with future opportunities. The burgeoning demand for aluminum in electric vehicles, particularly for battery casings and lightweight structural components, presents a significant growth avenue. Increased adoption of recycled aluminum, driven by sustainability mandates and consumer preferences, offers substantial opportunities for companies investing in advanced recycling technologies and circular economy models. Expansion into emerging markets with developing infrastructure and a growing manufacturing base will also drive demand. Furthermore, technological innovations in specialized alloys for sectors like aerospace and renewable energy (e.g., solar panel frames) will open new avenues for market penetration and revenue generation. The growing focus on green building practices will continue to boost demand in the construction sector.
- Electric Vehicle (EV) Market: Growing demand for aluminum components.
- Recycled Aluminum: Focus on circular economy and sustainability.
- Emerging Markets: Infrastructure and industrial growth driving consumption.
- Specialty Alloys: Applications in aerospace, renewable energy, and advanced manufacturing.
- Green Building: Continued demand from sustainable construction initiatives.
Major Players in the Aluminum Ingots Market Ecosystem
- SPIC Inc
- JBMI
- Dubai Aluminium Company
- Xinfa Group Co Ltd
- Norsk Hydro ASA
- Aluminum Corporation of China Limited (Chalco)
- BHP Billiton
- United Company
- Rio Tinto Group
- CHINA ZHONGWANG HOLDINGS LIMITED
- RUSAL Plc
- Alcoa Inc
- Hindalco Industries Ltd
- Aluminium Bahrain
Key Developments in Aluminum Ingots Market Industry
- July 2022: Alcoa Corporation announced the commencement of project construction to enhance casting capabilities at its Deschambault smelter in Canada, with the inclusion of standard ingots. The new casting equipment, to be installed within an existing building, is slated for full completion in the first quarter of 2023. This development aims to increase production flexibility and meet the growing demand for standard aluminum ingots.
- August 2022: Rio Tinto announced a USD 29 million investment in a new aluminum recycling facility at its Arvida Plant in Saguenay-Lac-Saint-Jean, Quebec. This strategic investment is designed to expand its portfolio of low-carbon aluminum solutions, catering to key customer markets including automotive, packaging, and construction. The initiative underscores a commitment to sustainability and the circular economy within the aluminum industry.
Strategic Aluminum Ingots Market Market Forecast
The Aluminum Ingots Market is poised for sustained growth driven by the global imperative for lightweight materials, particularly in the automotive sector, and the increasing demand for sustainable solutions. Technological advancements in energy-efficient smelting and a strong focus on recycling are expected to shape the market's future. The expansion of infrastructure projects in emerging economies and the continued innovation in specialized aluminum alloys for advanced applications will further fuel market potential. Stakeholders can anticipate a dynamic landscape characterized by a shift towards greener production methods and increased utilization of recycled aluminum, presenting significant opportunities for strategic investment and market leadership in the coming years.
Aluminum Ingots Market Segmentation
-
1. End-user Industry
- 1.1. Automotive
- 1.2. Aerospace
- 1.3. Building and Construction
- 1.4. Semiconductor
- 1.5. Electrical and Electronics
- 1.6. Other End-user Industries
Aluminum Ingots Market Segmentation By Geography
-
1. Asia Pacific
- 1.1. China
- 1.2. India
- 1.3. Japan
- 1.4. South Korea
- 1.5. Rest of Asia Pacific
-
2. North America
- 2.1. United States
- 2.2. Canada
- 2.3. Mexico
-
3. Europe
- 3.1. Germany
- 3.2. United Kingdom
- 3.3. Italy
- 3.4. France
- 3.5. Rest of Europe
-
4. South America
- 4.1. Brazil
- 4.2. Argentina
- 4.3. Rest of South America
-
5. Middle East and Africa
- 5.1. Saudi Arabia
- 5.2. South Africa
- 5.3. Rest of Middle East and Africa
Aluminum Ingots Market Regional Market Share
Geographic Coverage of Aluminum Ingots Market
Aluminum Ingots Market REPORT HIGHLIGHTS
| Aspects | Details |
|---|---|
| Study Period | 2020-2034 |
| Base Year | 2025 |
| Estimated Year | 2026 |
| Forecast Period | 2026-2034 |
| Historical Period | 2020-2025 |
| Growth Rate | CAGR of > 6.50% from 2020-2034 |
| Segmentation |
|
Table of Contents
- 1. Introduction
- 1.1. Research Scope
- 1.2. Market Segmentation
- 1.3. Research Objective
- 1.4. Definitions and Assumptions
- 2. Executive Summary
- 2.1. Market Snapshot
- 3. Market Dynamics
- 3.1. Market Drivers
- 3.2. Market Restrains
- 3.3. Market Trends
- 3.4. Market Opportunities
- 4. Market Factor Analysis
- 4.1. Porters Five Forces
- 4.1.1. Bargaining Power of Suppliers
- 4.1.2. Bargaining Power of Buyers
- 4.1.3. Threat of New Entrants
- 4.1.4. Threat of Substitutes
- 4.1.5. Competitive Rivalry
- 4.2. PESTEL analysis
- 4.3. BCG Analysis
- 4.3.1. Stars (High Growth, High Market Share)
- 4.3.2. Cash Cows (Low Growth, High Market Share)
- 4.3.3. Question Mark (High Growth, Low Market Share)
- 4.3.4. Dogs (Low Growth, Low Market Share)
- 4.4. Ansoff Matrix Analysis
- 4.5. Supply Chain Analysis
- 4.6. Regulatory Landscape
- 4.7. Current Market Potential and Opportunity Assessment (TAM–SAM–SOM Framework)
- 4.8. DMV Analyst Note
- 4.1. Porters Five Forces
- 5. Market Analysis, Insights and Forecast 2021-2033
- 5.1. Market Analysis, Insights and Forecast - by End-user Industry
- 5.1.1. Automotive
- 5.1.2. Aerospace
- 5.1.3. Building and Construction
- 5.1.4. Semiconductor
- 5.1.5. Electrical and Electronics
- 5.1.6. Other End-user Industries
- 5.2. Market Analysis, Insights and Forecast - by Region
- 5.2.1. Asia Pacific
- 5.2.2. North America
- 5.2.3. Europe
- 5.2.4. South America
- 5.2.5. Middle East and Africa
- 5.1. Market Analysis, Insights and Forecast - by End-user Industry
- 6. Global Aluminum Ingots Market Analysis, Insights and Forecast, 2021-2033
- 6.1. Market Analysis, Insights and Forecast - by End-user Industry
- 6.1.1. Automotive
- 6.1.2. Aerospace
- 6.1.3. Building and Construction
- 6.1.4. Semiconductor
- 6.1.5. Electrical and Electronics
- 6.1.6. Other End-user Industries
- 6.1. Market Analysis, Insights and Forecast - by End-user Industry
- 7. Asia Pacific Aluminum Ingots Market Analysis, Insights and Forecast, 2020-2032
- 7.1. Market Analysis, Insights and Forecast - by End-user Industry
- 7.1.1. Automotive
- 7.1.2. Aerospace
- 7.1.3. Building and Construction
- 7.1.4. Semiconductor
- 7.1.5. Electrical and Electronics
- 7.1.6. Other End-user Industries
- 7.1. Market Analysis, Insights and Forecast - by End-user Industry
- 8. North America Aluminum Ingots Market Analysis, Insights and Forecast, 2020-2032
- 8.1. Market Analysis, Insights and Forecast - by End-user Industry
- 8.1.1. Automotive
- 8.1.2. Aerospace
- 8.1.3. Building and Construction
- 8.1.4. Semiconductor
- 8.1.5. Electrical and Electronics
- 8.1.6. Other End-user Industries
- 8.1. Market Analysis, Insights and Forecast - by End-user Industry
- 9. Europe Aluminum Ingots Market Analysis, Insights and Forecast, 2020-2032
- 9.1. Market Analysis, Insights and Forecast - by End-user Industry
- 9.1.1. Automotive
- 9.1.2. Aerospace
- 9.1.3. Building and Construction
- 9.1.4. Semiconductor
- 9.1.5. Electrical and Electronics
- 9.1.6. Other End-user Industries
- 9.1. Market Analysis, Insights and Forecast - by End-user Industry
- 10. South America Aluminum Ingots Market Analysis, Insights and Forecast, 2020-2032
- 10.1. Market Analysis, Insights and Forecast - by End-user Industry
- 10.1.1. Automotive
- 10.1.2. Aerospace
- 10.1.3. Building and Construction
- 10.1.4. Semiconductor
- 10.1.5. Electrical and Electronics
- 10.1.6. Other End-user Industries
- 10.1. Market Analysis, Insights and Forecast - by End-user Industry
- 11. Middle East and Africa Aluminum Ingots Market Analysis, Insights and Forecast, 2020-2032
- 11.1. Market Analysis, Insights and Forecast - by End-user Industry
- 11.1.1. Automotive
- 11.1.2. Aerospace
- 11.1.3. Building and Construction
- 11.1.4. Semiconductor
- 11.1.5. Electrical and Electronics
- 11.1.6. Other End-user Industries
- 11.1. Market Analysis, Insights and Forecast - by End-user Industry
- 12. Competitive Analysis
- 12.1. Company Profiles
- 12.1.1 SPIC Inc
- 12.1.1.1. Company Overview
- 12.1.1.2. Products
- 12.1.1.3. Company Financials
- 12.1.1.4. SWOT Analysis
- 12.1.2 JBMI
- 12.1.2.1. Company Overview
- 12.1.2.2. Products
- 12.1.2.3. Company Financials
- 12.1.2.4. SWOT Analysis
- 12.1.3 Dubai Aluminium Company
- 12.1.3.1. Company Overview
- 12.1.3.2. Products
- 12.1.3.3. Company Financials
- 12.1.3.4. SWOT Analysis
- 12.1.4 Xinfa Group Co Ltd
- 12.1.4.1. Company Overview
- 12.1.4.2. Products
- 12.1.4.3. Company Financials
- 12.1.4.4. SWOT Analysis
- 12.1.5 Norsk Hydro ASA
- 12.1.5.1. Company Overview
- 12.1.5.2. Products
- 12.1.5.3. Company Financials
- 12.1.5.4. SWOT Analysis
- 12.1.6 Aluminum Corporation of China Limited (Chalco)
- 12.1.6.1. Company Overview
- 12.1.6.2. Products
- 12.1.6.3. Company Financials
- 12.1.6.4. SWOT Analysis
- 12.1.7 BHP Billiton
- 12.1.7.1. Company Overview
- 12.1.7.2. Products
- 12.1.7.3. Company Financials
- 12.1.7.4. SWOT Analysis
- 12.1.8 United Company
- 12.1.8.1. Company Overview
- 12.1.8.2. Products
- 12.1.8.3. Company Financials
- 12.1.8.4. SWOT Analysis
- 12.1.9 Rio Tinto Group
- 12.1.9.1. Company Overview
- 12.1.9.2. Products
- 12.1.9.3. Company Financials
- 12.1.9.4. SWOT Analysis
- 12.1.10 CHINA ZHONGWANG HOLDINGS LIMITED
- 12.1.10.1. Company Overview
- 12.1.10.2. Products
- 12.1.10.3. Company Financials
- 12.1.10.4. SWOT Analysis
- 12.1.11 RUSAL Plc
- 12.1.11.1. Company Overview
- 12.1.11.2. Products
- 12.1.11.3. Company Financials
- 12.1.11.4. SWOT Analysis
- 12.1.12 Alcoa Inc
- 12.1.12.1. Company Overview
- 12.1.12.2. Products
- 12.1.12.3. Company Financials
- 12.1.12.4. SWOT Analysis
- 12.1.13 Hindalco Industries Ltd
- 12.1.13.1. Company Overview
- 12.1.13.2. Products
- 12.1.13.3. Company Financials
- 12.1.13.4. SWOT Analysis
- 12.1.14 Aluminium Bahrain
- 12.1.14.1. Company Overview
- 12.1.14.2. Products
- 12.1.14.3. Company Financials
- 12.1.14.4. SWOT Analysis
- 12.1.1 SPIC Inc
- 12.2. Market Entropy
- 12.2.1 Company's Key Areas Served
- 12.2.2 Recent Developments
- 12.3. Company Market Share Analysis 2025
- 12.3.1 Top 5 Companies Market Share Analysis
- 12.3.2 Top 3 Companies Market Share Analysis
- 12.4. List of Potential Customers
- 13. Research Methodology
List of Figures
- Figure 1: Global Aluminum Ingots Market Revenue Breakdown (Million, %) by Region 2025 & 2033
- Figure 2: Global Aluminum Ingots Market Volume Breakdown (K Tons, %) by Region 2025 & 2033
- Figure 3: Asia Pacific Aluminum Ingots Market Revenue (Million), by End-user Industry 2025 & 2033
- Figure 4: Asia Pacific Aluminum Ingots Market Volume (K Tons), by End-user Industry 2025 & 2033
- Figure 5: Asia Pacific Aluminum Ingots Market Revenue Share (%), by End-user Industry 2025 & 2033
- Figure 6: Asia Pacific Aluminum Ingots Market Volume Share (%), by End-user Industry 2025 & 2033
- Figure 7: Asia Pacific Aluminum Ingots Market Revenue (Million), by Country 2025 & 2033
- Figure 8: Asia Pacific Aluminum Ingots Market Volume (K Tons), by Country 2025 & 2033
- Figure 9: Asia Pacific Aluminum Ingots Market Revenue Share (%), by Country 2025 & 2033
- Figure 10: Asia Pacific Aluminum Ingots Market Volume Share (%), by Country 2025 & 2033
- Figure 11: North America Aluminum Ingots Market Revenue (Million), by End-user Industry 2025 & 2033
- Figure 12: North America Aluminum Ingots Market Volume (K Tons), by End-user Industry 2025 & 2033
- Figure 13: North America Aluminum Ingots Market Revenue Share (%), by End-user Industry 2025 & 2033
- Figure 14: North America Aluminum Ingots Market Volume Share (%), by End-user Industry 2025 & 2033
- Figure 15: North America Aluminum Ingots Market Revenue (Million), by Country 2025 & 2033
- Figure 16: North America Aluminum Ingots Market Volume (K Tons), by Country 2025 & 2033
- Figure 17: North America Aluminum Ingots Market Revenue Share (%), by Country 2025 & 2033
- Figure 18: North America Aluminum Ingots Market Volume Share (%), by Country 2025 & 2033
- Figure 19: Europe Aluminum Ingots Market Revenue (Million), by End-user Industry 2025 & 2033
- Figure 20: Europe Aluminum Ingots Market Volume (K Tons), by End-user Industry 2025 & 2033
- Figure 21: Europe Aluminum Ingots Market Revenue Share (%), by End-user Industry 2025 & 2033
- Figure 22: Europe Aluminum Ingots Market Volume Share (%), by End-user Industry 2025 & 2033
- Figure 23: Europe Aluminum Ingots Market Revenue (Million), by Country 2025 & 2033
- Figure 24: Europe Aluminum Ingots Market Volume (K Tons), by Country 2025 & 2033
- Figure 25: Europe Aluminum Ingots Market Revenue Share (%), by Country 2025 & 2033
- Figure 26: Europe Aluminum Ingots Market Volume Share (%), by Country 2025 & 2033
- Figure 27: South America Aluminum Ingots Market Revenue (Million), by End-user Industry 2025 & 2033
- Figure 28: South America Aluminum Ingots Market Volume (K Tons), by End-user Industry 2025 & 2033
- Figure 29: South America Aluminum Ingots Market Revenue Share (%), by End-user Industry 2025 & 2033
- Figure 30: South America Aluminum Ingots Market Volume Share (%), by End-user Industry 2025 & 2033
- Figure 31: South America Aluminum Ingots Market Revenue (Million), by Country 2025 & 2033
- Figure 32: South America Aluminum Ingots Market Volume (K Tons), by Country 2025 & 2033
- Figure 33: South America Aluminum Ingots Market Revenue Share (%), by Country 2025 & 2033
- Figure 34: South America Aluminum Ingots Market Volume Share (%), by Country 2025 & 2033
- Figure 35: Middle East and Africa Aluminum Ingots Market Revenue (Million), by End-user Industry 2025 & 2033
- Figure 36: Middle East and Africa Aluminum Ingots Market Volume (K Tons), by End-user Industry 2025 & 2033
- Figure 37: Middle East and Africa Aluminum Ingots Market Revenue Share (%), by End-user Industry 2025 & 2033
- Figure 38: Middle East and Africa Aluminum Ingots Market Volume Share (%), by End-user Industry 2025 & 2033
- Figure 39: Middle East and Africa Aluminum Ingots Market Revenue (Million), by Country 2025 & 2033
- Figure 40: Middle East and Africa Aluminum Ingots Market Volume (K Tons), by Country 2025 & 2033
- Figure 41: Middle East and Africa Aluminum Ingots Market Revenue Share (%), by Country 2025 & 2033
- Figure 42: Middle East and Africa Aluminum Ingots Market Volume Share (%), by Country 2025 & 2033
List of Tables
- Table 1: Global Aluminum Ingots Market Revenue Million Forecast, by End-user Industry 2020 & 2033
- Table 2: Global Aluminum Ingots Market Volume K Tons Forecast, by End-user Industry 2020 & 2033
- Table 3: Global Aluminum Ingots Market Revenue Million Forecast, by Region 2020 & 2033
- Table 4: Global Aluminum Ingots Market Volume K Tons Forecast, by Region 2020 & 2033
- Table 5: Global Aluminum Ingots Market Revenue Million Forecast, by End-user Industry 2020 & 2033
- Table 6: Global Aluminum Ingots Market Volume K Tons Forecast, by End-user Industry 2020 & 2033
- Table 7: Global Aluminum Ingots Market Revenue Million Forecast, by Country 2020 & 2033
- Table 8: Global Aluminum Ingots Market Volume K Tons Forecast, by Country 2020 & 2033
- Table 9: China Aluminum Ingots Market Revenue (Million) Forecast, by Application 2020 & 2033
- Table 10: China Aluminum Ingots Market Volume (K Tons) Forecast, by Application 2020 & 2033
- Table 11: India Aluminum Ingots Market Revenue (Million) Forecast, by Application 2020 & 2033
- Table 12: India Aluminum Ingots Market Volume (K Tons) Forecast, by Application 2020 & 2033
- Table 13: Japan Aluminum Ingots Market Revenue (Million) Forecast, by Application 2020 & 2033
- Table 14: Japan Aluminum Ingots Market Volume (K Tons) Forecast, by Application 2020 & 2033
- Table 15: South Korea Aluminum Ingots Market Revenue (Million) Forecast, by Application 2020 & 2033
- Table 16: South Korea Aluminum Ingots Market Volume (K Tons) Forecast, by Application 2020 & 2033
- Table 17: Rest of Asia Pacific Aluminum Ingots Market Revenue (Million) Forecast, by Application 2020 & 2033
- Table 18: Rest of Asia Pacific Aluminum Ingots Market Volume (K Tons) Forecast, by Application 2020 & 2033
- Table 19: Global Aluminum Ingots Market Revenue Million Forecast, by End-user Industry 2020 & 2033
- Table 20: Global Aluminum Ingots Market Volume K Tons Forecast, by End-user Industry 2020 & 2033
- Table 21: Global Aluminum Ingots Market Revenue Million Forecast, by Country 2020 & 2033
- Table 22: Global Aluminum Ingots Market Volume K Tons Forecast, by Country 2020 & 2033
- Table 23: United States Aluminum Ingots Market Revenue (Million) Forecast, by Application 2020 & 2033
- Table 24: United States Aluminum Ingots Market Volume (K Tons) Forecast, by Application 2020 & 2033
- Table 25: Canada Aluminum Ingots Market Revenue (Million) Forecast, by Application 2020 & 2033
- Table 26: Canada Aluminum Ingots Market Volume (K Tons) Forecast, by Application 2020 & 2033
- Table 27: Mexico Aluminum Ingots Market Revenue (Million) Forecast, by Application 2020 & 2033
- Table 28: Mexico Aluminum Ingots Market Volume (K Tons) Forecast, by Application 2020 & 2033
- Table 29: Global Aluminum Ingots Market Revenue Million Forecast, by End-user Industry 2020 & 2033
- Table 30: Global Aluminum Ingots Market Volume K Tons Forecast, by End-user Industry 2020 & 2033
- Table 31: Global Aluminum Ingots Market Revenue Million Forecast, by Country 2020 & 2033
- Table 32: Global Aluminum Ingots Market Volume K Tons Forecast, by Country 2020 & 2033
- Table 33: Germany Aluminum Ingots Market Revenue (Million) Forecast, by Application 2020 & 2033
- Table 34: Germany Aluminum Ingots Market Volume (K Tons) Forecast, by Application 2020 & 2033
- Table 35: United Kingdom Aluminum Ingots Market Revenue (Million) Forecast, by Application 2020 & 2033
- Table 36: United Kingdom Aluminum Ingots Market Volume (K Tons) Forecast, by Application 2020 & 2033
- Table 37: Italy Aluminum Ingots Market Revenue (Million) Forecast, by Application 2020 & 2033
- Table 38: Italy Aluminum Ingots Market Volume (K Tons) Forecast, by Application 2020 & 2033
- Table 39: France Aluminum Ingots Market Revenue (Million) Forecast, by Application 2020 & 2033
- Table 40: France Aluminum Ingots Market Volume (K Tons) Forecast, by Application 2020 & 2033
- Table 41: Rest of Europe Aluminum Ingots Market Revenue (Million) Forecast, by Application 2020 & 2033
- Table 42: Rest of Europe Aluminum Ingots Market Volume (K Tons) Forecast, by Application 2020 & 2033
- Table 43: Global Aluminum Ingots Market Revenue Million Forecast, by End-user Industry 2020 & 2033
- Table 44: Global Aluminum Ingots Market Volume K Tons Forecast, by End-user Industry 2020 & 2033
- Table 45: Global Aluminum Ingots Market Revenue Million Forecast, by Country 2020 & 2033
- Table 46: Global Aluminum Ingots Market Volume K Tons Forecast, by Country 2020 & 2033
- Table 47: Brazil Aluminum Ingots Market Revenue (Million) Forecast, by Application 2020 & 2033
- Table 48: Brazil Aluminum Ingots Market Volume (K Tons) Forecast, by Application 2020 & 2033
- Table 49: Argentina Aluminum Ingots Market Revenue (Million) Forecast, by Application 2020 & 2033
- Table 50: Argentina Aluminum Ingots Market Volume (K Tons) Forecast, by Application 2020 & 2033
- Table 51: Rest of South America Aluminum Ingots Market Revenue (Million) Forecast, by Application 2020 & 2033
- Table 52: Rest of South America Aluminum Ingots Market Volume (K Tons) Forecast, by Application 2020 & 2033
- Table 53: Global Aluminum Ingots Market Revenue Million Forecast, by End-user Industry 2020 & 2033
- Table 54: Global Aluminum Ingots Market Volume K Tons Forecast, by End-user Industry 2020 & 2033
- Table 55: Global Aluminum Ingots Market Revenue Million Forecast, by Country 2020 & 2033
- Table 56: Global Aluminum Ingots Market Volume K Tons Forecast, by Country 2020 & 2033
- Table 57: Saudi Arabia Aluminum Ingots Market Revenue (Million) Forecast, by Application 2020 & 2033
- Table 58: Saudi Arabia Aluminum Ingots Market Volume (K Tons) Forecast, by Application 2020 & 2033
- Table 59: South Africa Aluminum Ingots Market Revenue (Million) Forecast, by Application 2020 & 2033
- Table 60: South Africa Aluminum Ingots Market Volume (K Tons) Forecast, by Application 2020 & 2033
- Table 61: Rest of Middle East and Africa Aluminum Ingots Market Revenue (Million) Forecast, by Application 2020 & 2033
- Table 62: Rest of Middle East and Africa Aluminum Ingots Market Volume (K Tons) Forecast, by Application 2020 & 2033
Frequently Asked Questions
1. What is the projected Compound Annual Growth Rate (CAGR) of the Aluminum Ingots Market?
The projected CAGR is approximately > 6.50%.
2. Which companies are prominent players in the Aluminum Ingots Market?
Key companies in the market include SPIC Inc, JBMI, Dubai Aluminium Company, Xinfa Group Co Ltd , Norsk Hydro ASA, Aluminum Corporation of China Limited (Chalco), BHP Billiton, United Company, Rio Tinto Group, CHINA ZHONGWANG HOLDINGS LIMITED, RUSAL Plc, Alcoa Inc, Hindalco Industries Ltd, Aluminium Bahrain.
3. What are the main segments of the Aluminum Ingots Market?
The market segments include End-user Industry.
4. Can you provide details about the market size?
The market size is estimated to be USD XX Million as of 2022.
5. What are some drivers contributing to market growth?
Surging Construction Activities in Developing Countries; Rising Application of Aluminum Ingots in the Automotive Industry.
6. What are the notable trends driving market growth?
Significant Growth in Building and Construction Segment.
7. Are there any restraints impacting market growth?
Fluctuating Prices of Raw Materials; Other Market Restraints.
8. Can you provide examples of recent developments in the market?
July 2022: Alcoa Corporation announced that it would soon start the project construction to increase the casting capabilities at its Deschambault smelter in Canada to include standard ingots. The new casting equipment will be constructed in an existing building, with the project fully completed in the first quarter of 2023.
9. What pricing options are available for accessing the report?
Pricing options include single-user, multi-user, and enterprise licenses priced at USD 4750, USD 5250, and USD 8750 respectively.
10. Is the market size provided in terms of value or volume?
The market size is provided in terms of value, measured in Million and volume, measured in K Tons.
11. Are there any specific market keywords associated with the report?
Yes, the market keyword associated with the report is "Aluminum Ingots Market," which aids in identifying and referencing the specific market segment covered.
12. How do I determine which pricing option suits my needs best?
The pricing options vary based on user requirements and access needs. Individual users may opt for single-user licenses, while businesses requiring broader access may choose multi-user or enterprise licenses for cost-effective access to the report.
13. Are there any additional resources or data provided in the Aluminum Ingots Market report?
While the report offers comprehensive insights, it's advisable to review the specific contents or supplementary materials provided to ascertain if additional resources or data are available.
14. How can I stay updated on further developments or reports in the Aluminum Ingots Market?
To stay informed about further developments, trends, and reports in the Aluminum Ingots Market, consider subscribing to industry newsletters, following relevant companies and organizations, or regularly checking reputable industry news sources and publications.
Methodology
Step 1 - Identification of Relevant Samples Size from Population Database


Step 2 - Approaches for Defining Global Market Size (Value, Volume* & Price*)

Note*: In applicable scenarios
Step 3 - Data Sources
Primary Research
- Web Analytics
- Survey Reports
- Research Institute
- Latest Research Reports
- Opinion Leaders
Secondary Research
- Annual Reports
- White Paper
- Latest Press Release
- Industry Association
- Paid Database
- Investor Presentations

Step 4 - Data Triangulation
Involves using different sources of information in order to increase the validity of a study
These sources are likely to be stakeholders in a program - participants, other researchers, program staff, other community members, and so on.
Then we put all data in single framework & apply various statistical tools to find out the dynamic on the market.
During the analysis stage, feedback from the stakeholder groups would be compared to determine areas of agreement as well as areas of divergence