

Key Insights
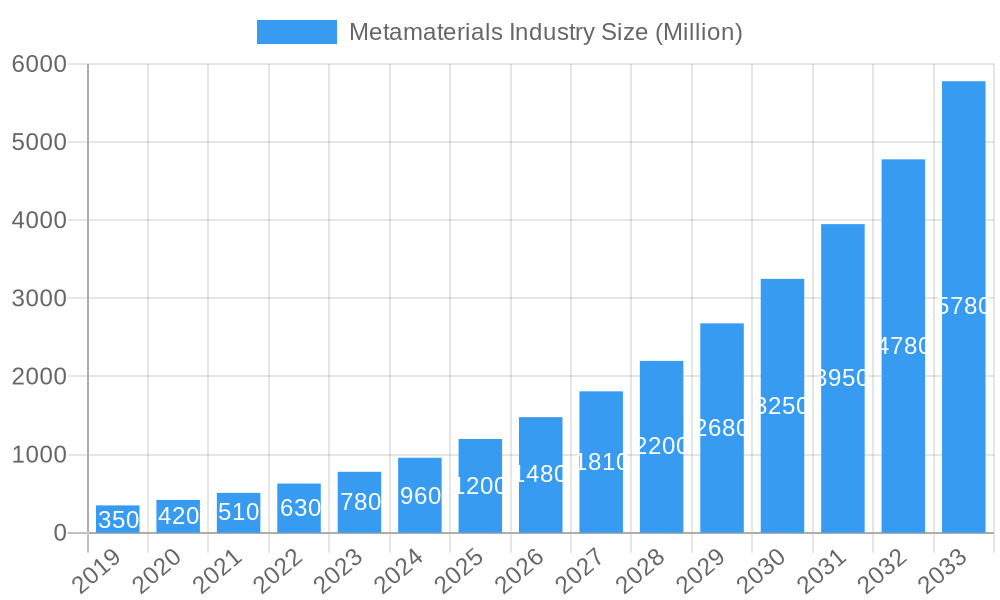
The global metamaterials market is poised for explosive growth, projected to reach a substantial market size of approximately $1,500 million by 2025, with an impressive Compound Annual Growth Rate (CAGR) exceeding 24.00%. This remarkable expansion is primarily driven by the transformative capabilities of metamaterials across a spectrum of advanced applications. Key drivers include the burgeoning demand for lightweight, high-performance antenna and radar systems in aerospace and defense, enabling enhanced surveillance and communication capabilities. The burgeoning adoption of advanced sensor technologies in healthcare, for improved diagnostics and imaging, is also a significant catalyst. Furthermore, the inherent ability of metamaterials to manipulate electromagnetic waves is fueling innovation in cloaking devices, superlens technology for sub-wavelength imaging, and efficient light and sound filtering applications, all of which are contributing to this robust market trajectory.
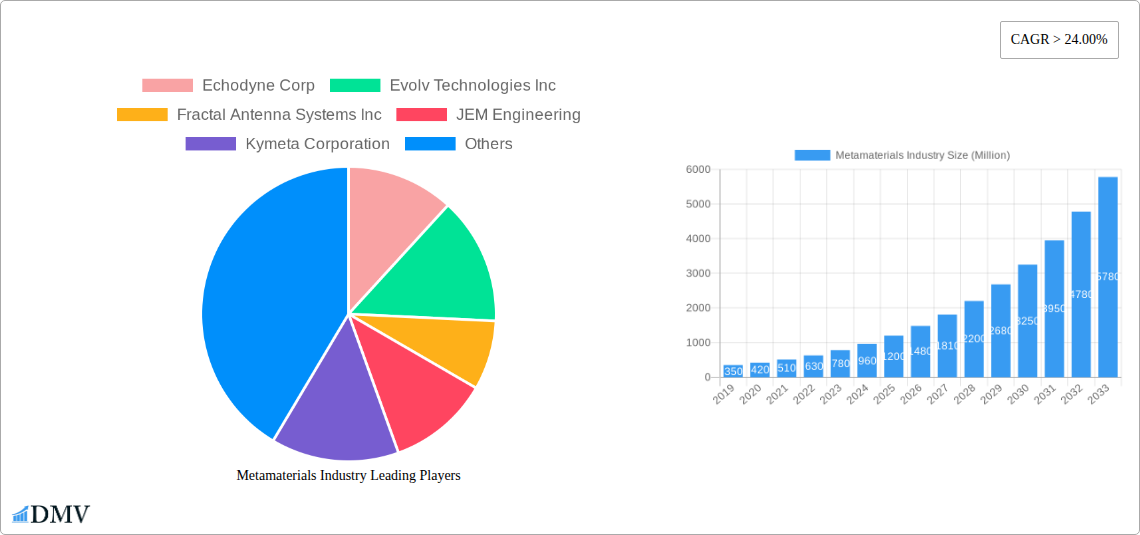
Metamaterials Industry Market Size (In Million)
Looking ahead, the metamaterials market is expected to continue its upward momentum, exceeding $5,000 million by 2033. Emerging trends such as the development of tunable and photonic metamaterials are opening new frontiers in telecommunications and electronics, promising faster data transmission and more compact devices. The increasing integration of metamaterials in solar energy applications for enhanced absorption efficiency and in advanced absorber technologies for noise reduction and thermal management further solidifies this growth outlook. While the high research and development costs and the complexity of large-scale manufacturing represent ongoing challenges, the sheer potential of metamaterials to revolutionize industries from healthcare to telecommunications, and from aerospace to consumer electronics, ensures sustained investment and innovation, positioning the market for exceptional long-term expansion.
Metamaterials Industry Company Market Share
This comprehensive Metamaterials Industry market report delivers an in-depth analysis of the rapidly evolving global landscape, forecasting a significant expansion from the base year 2025 through 2033. Delving into historical trends from 2019–2024 and projecting future trajectories, this research equips stakeholders with critical insights into market composition, emerging technologies, competitive strategies, and investment opportunities. We meticulously examine electromagnetic metamaterials, terahertz metamaterials, tunable metamaterials, photonic metamaterials, frequency selective surfaces (FSS), and other advanced metamaterial types like chiral and nonlinear variants, alongside their applications in antennas and radar, sensors, cloaking devices, superlenses, and light and sound filtering. Furthermore, we explore the impact across key end-user industries including healthcare, telecommunication, aerospace and defense, electronics, and other optics-focused sectors.
Metamaterials Industry Market Composition & Trends
The global metamaterials market is characterized by a dynamic interplay of established players and burgeoning innovators, driving a concentrated yet rapidly evolving competitive landscape. Innovation remains a primary catalyst, fueled by relentless research and development in novel material designs and fabrication techniques. Regulatory frameworks are gradually taking shape, offering both opportunities and challenges for market entry and product commercialization. Substitute products, while existing, are increasingly being outpaced by the unique functionalities offered by metamaterials. End-user profiles are broadening, with early adopters in defense and telecommunications now being joined by growing interest from healthcare and consumer electronics. Mergers and acquisitions (M&A) activity is on the rise as larger entities seek to integrate advanced metamaterial capabilities. For instance, M&A deal values are projected to reach over XX million by 2028, reflecting strategic consolidation.
- Market Share Distribution: While precise figures fluctuate, key players collectively hold an estimated XX% of the current market, with significant growth potential for specialized niche providers.
- M&A Deal Values: Expected to exceed XX million by 2028, driven by the strategic acquisition of innovative intellectual property and advanced manufacturing capabilities.
- Innovation Catalysts: Breakthroughs in nanoscale fabrication, computational design, and material science are consistently expanding the application envelope.
Metamaterials Industry Industry Evolution
The metamaterials industry has witnessed a remarkable evolution, transitioning from a niche academic pursuit to a burgeoning commercial sector with substantial growth potential. Over the historical period of 2019–2024, the market has been shaped by increasing investment in fundamental research and a growing awareness of the transformative capabilities of these artificial materials. Technological advancements have been the bedrock of this evolution, with breakthroughs in lithography, additive manufacturing, and computational modeling enabling the design and fabrication of complex metamaterial structures with unprecedented precision. This has led to a significant improvement in performance metrics across various applications, such as enhanced signal reception for antennas and improved sensitivity for sensors. Consumer demands, though nascent in some areas, are increasingly favoring solutions that offer miniaturization, enhanced efficiency, and novel functionalities, all of which metamaterials are poised to deliver. The market growth trajectory is steep, with Compound Annual Growth Rates (CAGRs) projected to range from XX% to XX% over the forecast period of 2025–2033. Adoption metrics are steadily climbing, particularly in defense, telecommunications, and advanced sensing, where the unique properties of metamaterials are addressing long-standing technological challenges. The estimated market size in 2025 stands at XX million, with projections to reach over XX million by 2033. This exponential growth is underpinned by continuous innovation and the successful translation of laboratory discoveries into viable commercial products that redefine the boundaries of what is technologically possible. The industry is moving beyond proof-of-concept to scalable production, paving the way for widespread adoption across diverse sectors.
Leading Regions, Countries, or Segments in Metamaterials Industry
The metamaterials industry is experiencing dominant growth and innovation across several key regions and segments. North America and Europe currently lead, driven by robust government funding for defense and aerospace research, coupled with a strong presence of leading technology companies and academic institutions. The Aerospace and Defense end-user industry is a primary driver, heavily investing in advanced radar systems, electronic warfare, and stealth technologies, where metamaterials offer unparalleled advantages.
Dominant Segment (Type): Electromagnetic Metamaterials
- Key Drivers:
- High demand for advanced antennas and radar systems in defense and telecommunications.
- Breakthroughs in signal manipulation and beamforming capabilities.
- Significant R&D investment by major players.
- In-depth Analysis: Electromagnetic metamaterials are at the forefront due to their ability to control electromagnetic waves in ways not possible with conventional materials. This translates directly into enhanced performance for radar systems, leading to improved detection capabilities and reduced false alarms. In telecommunications, they promise smaller, more efficient antennas and novel signal routing solutions. The XX million invested in R&D for electromagnetic metamaterials in 2024 underscores their critical role.
- Key Drivers:
Dominant Segment (Application): Antenna and Radar
- Key Drivers:
- National security imperatives and advancements in autonomous systems.
- The push for next-generation communication technologies (e.g., 5G/6G).
- Development of sophisticated sensing and imaging systems.
- In-depth Analysis: The antenna and radar segment is experiencing explosive growth. Metamaterial-based phased array antennas, for instance, offer electronic beam steering with no moving parts, enabling faster scanning and wider coverage. Echodyne Corp.'s focus on metamaterials-based radars for defense and security applications exemplifies this trend. The market for metamaterial antennas and radars is projected to grow by XX% annually, reaching XX million by 2033.
- Key Drivers:
Dominant Segment (End-user Industry): Aerospace and Defense
- Key Drivers:
- Continuous need for advanced surveillance, communication, and electronic warfare capabilities.
- Government-backed research programs and defense modernization initiatives.
- The pursuit of enhanced operational effectiveness and reduced signatures.
- In-depth Analysis: The defense sector's appetite for cutting-edge technology makes it a prime adopter of metamaterials. From advanced radar cross-section reduction for stealth aircraft to enhanced communication systems for unmanned aerial vehicles (UAVs), metamaterials provide a critical performance edge. The market size for metamaterials in aerospace and defense alone is expected to reach XX million by 2033.
- Key Drivers:
Emerging markets in Asia-Pacific are rapidly catching up, driven by increasing government support for advanced manufacturing and a growing demand for high-tech solutions across various industries.
Metamaterials Industry Product Innovations
Metamaterials are revolutionizing product design with their ability to manipulate waves beyond the capabilities of conventional materials. Innovations include ultra-thin and highly efficient antennas that enable smaller, more powerful devices for telecommunications and defense. Novel metamaterial sensors are achieving unprecedented sensitivity for medical diagnostics and environmental monitoring. The development of advanced cloaking devices, once science fiction, is becoming a reality for radar and acoustic wave suppression. Performance metrics such as enhanced signal-to-noise ratios (SNR) in radar systems, improved resolution in imaging, and superior energy harvesting capabilities in solar applications are key differentiators. These advancements are driven by sophisticated computational design and precision fabrication techniques, creating unique selling propositions for a new generation of high-performance products.
Propelling Factors for Metamaterials Industry Growth
The growth of the metamaterials industry is propelled by a confluence of factors, including significant advancements in material science and fabrication technologies, enabling the creation of materials with extraordinary electromagnetic and optical properties. The increasing demand for miniaturized, high-performance solutions in sectors like telecommunications, aerospace, and defense is a major catalyst. Government funding and strategic initiatives in advanced materials research, particularly in defense and national security, further accelerate development. Economic incentives, such as the potential for significant cost savings through improved efficiency and reduced material usage in some applications, also play a crucial role. For instance, the development of more efficient antennas can reduce power consumption, leading to long-term economic benefits.
Obstacles in the Metamaterials Industry Market
Despite its promising trajectory, the metamaterials industry faces several significant obstacles. The high cost of fabrication and manufacturing, particularly for complex, large-scale metamaterial structures, remains a major restraint. Scaling up production from laboratory prototypes to mass manufacturing presents significant technical and financial challenges. Regulatory hurdles and a lack of standardized testing and certification procedures can slow down market penetration, especially in highly regulated sectors like healthcare and defense. Supply chain disruptions for specialized raw materials and components, coupled with the need for highly skilled labor, can also impede growth. Furthermore, the technical complexity of metamaterials can create a steep learning curve for potential adopters, requiring substantial education and support. The market is estimated to lose XX million in potential revenue annually due to these barriers.
Future Opportunities in Metamaterials Industry
The future of the metamaterials industry is rich with opportunity. Emerging markets in consumer electronics, such as advanced display technologies and integrated antennas for smartphones and wearables, represent a vast untapped potential. The healthcare sector is poised for significant growth with the application of metamaterials in advanced medical imaging, targeted drug delivery, and novel biosensors. Furthermore, the development of new metamaterial types, such as acoustic metamaterials for noise cancellation and vibration control, opens up entirely new application domains. The ongoing miniaturization trend and the quest for energy-efficient solutions will continue to drive demand for metamaterial-based components across all industries. The potential for metamaterials in sustainable energy applications, like highly efficient solar cells and energy harvesting devices, is also a significant growth area.
Major Players in the Metamaterials Industry Ecosystem
- Echodyne Corp.
- Evolv Technologies Inc.
- Fractal Antenna Systems Inc.
- JEM Engineering
- Kymeta Corporation
- Metamaterials Inc.
- Multiwave Technologies AG
- Nanohmics Inc.
- NKT Photonics A/S
- TeraView Limited
- Metawave Corporation
- Aegis Technologies
- Metamagnetics
- NanoSonic Inc.
- Nanoscribe GmbH & Co KG
Key Developments in Metamaterials Industry Industry
- November 2022: Meta Materials Inc. announced the launch of its new headquarters and Centre of Excellence in Dartmouth, Nova Scotia. This 68,000-square-foot state-of-the-art facility is unique in Canada, combining advanced semiconductor packaging, unique materials, chemistry research, and the design and manufacturing of holographic and other optical products, signifying a major expansion in manufacturing and R&D capabilities.
- June 2022: Echodyne Corp. announced plans to test metamaterials-based radars for defense, security, and autonomy applications. This development followed their announcement of commencing a USD 135 million fundraising round led by Baillie Gifford and Bill Gates, aiming to significantly ramp up production and deployment of their advanced radar solutions.
Strategic Metamaterials Industry Market Forecast
The strategic forecast for the metamaterials industry indicates robust growth driven by continuous innovation and increasing adoption across diverse sectors. Key growth catalysts include the persistent demand for enhanced performance in telecommunications, aerospace, and defense, coupled with the emergence of new applications in healthcare and consumer electronics. Advancements in fabrication techniques and material design will further unlock the potential of metamaterials, enabling more cost-effective and scalable production. The increasing investment in research and development, alongside strategic partnerships and acquisitions, will solidify the industry's expansion. The market is projected to experience a CAGR of XX% from 2025 to 2033, reaching an estimated value of over XX million, presenting substantial opportunities for stakeholders to capitalize on this transformative technology.
Metamaterials Industry Segmentation
-
1. Type
- 1.1. Electromagnetic
- 1.2. Terahertz
- 1.3. Tunable
- 1.4. Photonic
- 1.5. FSS
- 1.6. Other Types (Chiral, Nonlinear, etc.)
-
2. Application
- 2.1. Antenna and Radar
- 2.2. Sensors
- 2.3. Cloaking Devices
- 2.4. Superlens
- 2.5. Light and Sound Filtering
- 2.6. Other Applications (Solar, Absorbers, etc.)
-
3. End-user Industry
- 3.1. Healthcare
- 3.2. Telecommunication
- 3.3. Aerospace and Defense
- 3.4. Electronics
- 3.5. Other End-use Industries (including Optics)
Metamaterials Industry Segmentation By Geography
-
1. Asia Pacific
- 1.1. China
- 1.2. India
- 1.3. Japan
- 1.4. South Korea
- 1.5. Rest of Asia Pacific
-
2. North America
- 2.1. United States
- 2.2. Canada
- 2.3. Mexico
- 2.4. Rest of North America
-
3. Europe
- 3.1. Germany
- 3.2. United Kingdom
- 3.3. Italy
- 3.4. France
- 3.5. Spain
- 3.6. Rest of Europe
-
4. South America
- 4.1. Brazil
- 4.2. Argentina
- 4.3. Rest of South America
-
5. Middle East and Africa
- 5.1. Saudi Arabia
- 5.2. South Africa
- 5.3. Rest of Middle East and Africa
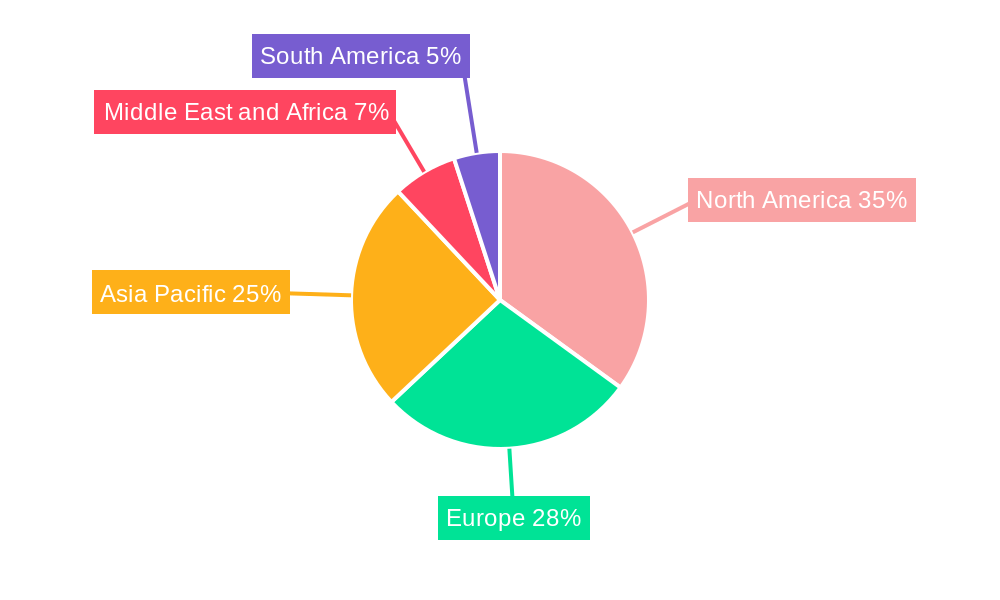
Metamaterials Industry Regional Market Share
Geographic Coverage of Metamaterials Industry
Metamaterials Industry REPORT HIGHLIGHTS
| Aspects | Details |
|---|---|
| Study Period | 2020-2034 |
| Base Year | 2025 |
| Estimated Year | 2026 |
| Forecast Period | 2026-2034 |
| Historical Period | 2020-2025 |
| Growth Rate | CAGR of 27.65% from 2020-2034 |
| Segmentation |
|
Table of Contents
- 1. Introduction
- 1.1. Research Scope
- 1.2. Market Segmentation
- 1.3. Research Objective
- 1.4. Definitions and Assumptions
- 2. Executive Summary
- 2.1. Market Snapshot
- 3. Market Dynamics
- 3.1. Market Drivers
- 3.2. Market Restrains
- 3.3. Market Trends
- 3.4. Market Opportunities
- 4. Market Factor Analysis
- 4.1. Porters Five Forces
- 4.1.1. Bargaining Power of Suppliers
- 4.1.2. Bargaining Power of Buyers
- 4.1.3. Threat of New Entrants
- 4.1.4. Threat of Substitutes
- 4.1.5. Competitive Rivalry
- 4.2. PESTEL analysis
- 4.3. BCG Analysis
- 4.3.1. Stars (High Growth, High Market Share)
- 4.3.2. Cash Cows (Low Growth, High Market Share)
- 4.3.3. Question Mark (High Growth, Low Market Share)
- 4.3.4. Dogs (Low Growth, Low Market Share)
- 4.4. Ansoff Matrix Analysis
- 4.5. Supply Chain Analysis
- 4.6. Regulatory Landscape
- 4.7. Current Market Potential and Opportunity Assessment (TAM–SAM–SOM Framework)
- 4.8. DMV Analyst Note
- 4.1. Porters Five Forces
- 5. Market Analysis, Insights and Forecast 2021-2033
- 5.1. Market Analysis, Insights and Forecast - by Type
- 5.1.1. Electromagnetic
- 5.1.2. Terahertz
- 5.1.3. Tunable
- 5.1.4. Photonic
- 5.1.5. FSS
- 5.1.6. Other Types (Chiral, Nonlinear, etc.)
- 5.2. Market Analysis, Insights and Forecast - by Application
- 5.2.1. Antenna and Radar
- 5.2.2. Sensors
- 5.2.3. Cloaking Devices
- 5.2.4. Superlens
- 5.2.5. Light and Sound Filtering
- 5.2.6. Other Applications (Solar, Absorbers, etc.)
- 5.3. Market Analysis, Insights and Forecast - by End-user Industry
- 5.3.1. Healthcare
- 5.3.2. Telecommunication
- 5.3.3. Aerospace and Defense
- 5.3.4. Electronics
- 5.3.5. Other End-use Industries (including Optics)
- 5.4. Market Analysis, Insights and Forecast - by Region
- 5.4.1. Asia Pacific
- 5.4.2. North America
- 5.4.3. Europe
- 5.4.4. South America
- 5.4.5. Middle East and Africa
- 5.1. Market Analysis, Insights and Forecast - by Type
- 6. Global Metamaterials Industry Analysis, Insights and Forecast, 2021-2033
- 6.1. Market Analysis, Insights and Forecast - by Type
- 6.1.1. Electromagnetic
- 6.1.2. Terahertz
- 6.1.3. Tunable
- 6.1.4. Photonic
- 6.1.5. FSS
- 6.1.6. Other Types (Chiral, Nonlinear, etc.)
- 6.2. Market Analysis, Insights and Forecast - by Application
- 6.2.1. Antenna and Radar
- 6.2.2. Sensors
- 6.2.3. Cloaking Devices
- 6.2.4. Superlens
- 6.2.5. Light and Sound Filtering
- 6.2.6. Other Applications (Solar, Absorbers, etc.)
- 6.3. Market Analysis, Insights and Forecast - by End-user Industry
- 6.3.1. Healthcare
- 6.3.2. Telecommunication
- 6.3.3. Aerospace and Defense
- 6.3.4. Electronics
- 6.3.5. Other End-use Industries (including Optics)
- 6.1. Market Analysis, Insights and Forecast - by Type
- 7. Asia Pacific Metamaterials Industry Analysis, Insights and Forecast, 2020-2032
- 7.1. Market Analysis, Insights and Forecast - by Type
- 7.1.1. Electromagnetic
- 7.1.2. Terahertz
- 7.1.3. Tunable
- 7.1.4. Photonic
- 7.1.5. FSS
- 7.1.6. Other Types (Chiral, Nonlinear, etc.)
- 7.2. Market Analysis, Insights and Forecast - by Application
- 7.2.1. Antenna and Radar
- 7.2.2. Sensors
- 7.2.3. Cloaking Devices
- 7.2.4. Superlens
- 7.2.5. Light and Sound Filtering
- 7.2.6. Other Applications (Solar, Absorbers, etc.)
- 7.3. Market Analysis, Insights and Forecast - by End-user Industry
- 7.3.1. Healthcare
- 7.3.2. Telecommunication
- 7.3.3. Aerospace and Defense
- 7.3.4. Electronics
- 7.3.5. Other End-use Industries (including Optics)
- 7.1. Market Analysis, Insights and Forecast - by Type
- 8. North America Metamaterials Industry Analysis, Insights and Forecast, 2020-2032
- 8.1. Market Analysis, Insights and Forecast - by Type
- 8.1.1. Electromagnetic
- 8.1.2. Terahertz
- 8.1.3. Tunable
- 8.1.4. Photonic
- 8.1.5. FSS
- 8.1.6. Other Types (Chiral, Nonlinear, etc.)
- 8.2. Market Analysis, Insights and Forecast - by Application
- 8.2.1. Antenna and Radar
- 8.2.2. Sensors
- 8.2.3. Cloaking Devices
- 8.2.4. Superlens
- 8.2.5. Light and Sound Filtering
- 8.2.6. Other Applications (Solar, Absorbers, etc.)
- 8.3. Market Analysis, Insights and Forecast - by End-user Industry
- 8.3.1. Healthcare
- 8.3.2. Telecommunication
- 8.3.3. Aerospace and Defense
- 8.3.4. Electronics
- 8.3.5. Other End-use Industries (including Optics)
- 8.1. Market Analysis, Insights and Forecast - by Type
- 9. Europe Metamaterials Industry Analysis, Insights and Forecast, 2020-2032
- 9.1. Market Analysis, Insights and Forecast - by Type
- 9.1.1. Electromagnetic
- 9.1.2. Terahertz
- 9.1.3. Tunable
- 9.1.4. Photonic
- 9.1.5. FSS
- 9.1.6. Other Types (Chiral, Nonlinear, etc.)
- 9.2. Market Analysis, Insights and Forecast - by Application
- 9.2.1. Antenna and Radar
- 9.2.2. Sensors
- 9.2.3. Cloaking Devices
- 9.2.4. Superlens
- 9.2.5. Light and Sound Filtering
- 9.2.6. Other Applications (Solar, Absorbers, etc.)
- 9.3. Market Analysis, Insights and Forecast - by End-user Industry
- 9.3.1. Healthcare
- 9.3.2. Telecommunication
- 9.3.3. Aerospace and Defense
- 9.3.4. Electronics
- 9.3.5. Other End-use Industries (including Optics)
- 9.1. Market Analysis, Insights and Forecast - by Type
- 10. South America Metamaterials Industry Analysis, Insights and Forecast, 2020-2032
- 10.1. Market Analysis, Insights and Forecast - by Type
- 10.1.1. Electromagnetic
- 10.1.2. Terahertz
- 10.1.3. Tunable
- 10.1.4. Photonic
- 10.1.5. FSS
- 10.1.6. Other Types (Chiral, Nonlinear, etc.)
- 10.2. Market Analysis, Insights and Forecast - by Application
- 10.2.1. Antenna and Radar
- 10.2.2. Sensors
- 10.2.3. Cloaking Devices
- 10.2.4. Superlens
- 10.2.5. Light and Sound Filtering
- 10.2.6. Other Applications (Solar, Absorbers, etc.)
- 10.3. Market Analysis, Insights and Forecast - by End-user Industry
- 10.3.1. Healthcare
- 10.3.2. Telecommunication
- 10.3.3. Aerospace and Defense
- 10.3.4. Electronics
- 10.3.5. Other End-use Industries (including Optics)
- 10.1. Market Analysis, Insights and Forecast - by Type
- 11. Middle East and Africa Metamaterials Industry Analysis, Insights and Forecast, 2020-2032
- 11.1. Market Analysis, Insights and Forecast - by Type
- 11.1.1. Electromagnetic
- 11.1.2. Terahertz
- 11.1.3. Tunable
- 11.1.4. Photonic
- 11.1.5. FSS
- 11.1.6. Other Types (Chiral, Nonlinear, etc.)
- 11.2. Market Analysis, Insights and Forecast - by Application
- 11.2.1. Antenna and Radar
- 11.2.2. Sensors
- 11.2.3. Cloaking Devices
- 11.2.4. Superlens
- 11.2.5. Light and Sound Filtering
- 11.2.6. Other Applications (Solar, Absorbers, etc.)
- 11.3. Market Analysis, Insights and Forecast - by End-user Industry
- 11.3.1. Healthcare
- 11.3.2. Telecommunication
- 11.3.3. Aerospace and Defense
- 11.3.4. Electronics
- 11.3.5. Other End-use Industries (including Optics)
- 11.1. Market Analysis, Insights and Forecast - by Type
- 12. Competitive Analysis
- 12.1. Company Profiles
- 12.1.1 Echodyne Corp
- 12.1.1.1. Company Overview
- 12.1.1.2. Products
- 12.1.1.3. Company Financials
- 12.1.1.4. SWOT Analysis
- 12.1.2 Evolv Technologies Inc
- 12.1.2.1. Company Overview
- 12.1.2.2. Products
- 12.1.2.3. Company Financials
- 12.1.2.4. SWOT Analysis
- 12.1.3 Fractal Antenna Systems Inc
- 12.1.3.1. Company Overview
- 12.1.3.2. Products
- 12.1.3.3. Company Financials
- 12.1.3.4. SWOT Analysis
- 12.1.4 JEM Engineering
- 12.1.4.1. Company Overview
- 12.1.4.2. Products
- 12.1.4.3. Company Financials
- 12.1.4.4. SWOT Analysis
- 12.1.5 Kymeta Corporation
- 12.1.5.1. Company Overview
- 12.1.5.2. Products
- 12.1.5.3. Company Financials
- 12.1.5.4. SWOT Analysis
- 12.1.6 Metamaterials Inc
- 12.1.6.1. Company Overview
- 12.1.6.2. Products
- 12.1.6.3. Company Financials
- 12.1.6.4. SWOT Analysis
- 12.1.7 Multiwave Technologies AG
- 12.1.7.1. Company Overview
- 12.1.7.2. Products
- 12.1.7.3. Company Financials
- 12.1.7.4. SWOT Analysis
- 12.1.8 Nanohmics Inc
- 12.1.8.1. Company Overview
- 12.1.8.2. Products
- 12.1.8.3. Company Financials
- 12.1.8.4. SWOT Analysis
- 12.1.9 NKT Photonics A/S
- 12.1.9.1. Company Overview
- 12.1.9.2. Products
- 12.1.9.3. Company Financials
- 12.1.9.4. SWOT Analysis
- 12.1.10 TeraView Limited
- 12.1.10.1. Company Overview
- 12.1.10.2. Products
- 12.1.10.3. Company Financials
- 12.1.10.4. SWOT Analysis
- 12.1.11 Metawave Corporation
- 12.1.11.1. Company Overview
- 12.1.11.2. Products
- 12.1.11.3. Company Financials
- 12.1.11.4. SWOT Analysis
- 12.1.12 Aegis Technologies
- 12.1.12.1. Company Overview
- 12.1.12.2. Products
- 12.1.12.3. Company Financials
- 12.1.12.4. SWOT Analysis
- 12.1.13 Metamagnetics
- 12.1.13.1. Company Overview
- 12.1.13.2. Products
- 12.1.13.3. Company Financials
- 12.1.13.4. SWOT Analysis
- 12.1.14 NanoSonic Inc
- 12.1.14.1. Company Overview
- 12.1.14.2. Products
- 12.1.14.3. Company Financials
- 12.1.14.4. SWOT Analysis
- 12.1.15 Nanoscribe GmbH & Co KG*List Not Exhaustive
- 12.1.15.1. Company Overview
- 12.1.15.2. Products
- 12.1.15.3. Company Financials
- 12.1.15.4. SWOT Analysis
- 12.1.1 Echodyne Corp
- 12.2. Market Entropy
- 12.2.1 Company's Key Areas Served
- 12.2.2 Recent Developments
- 12.3. Company Market Share Analysis 2025
- 12.3.1 Top 5 Companies Market Share Analysis
- 12.3.2 Top 3 Companies Market Share Analysis
- 12.4. List of Potential Customers
- 13. Research Methodology
List of Figures
- Figure 1: Global Metamaterials Industry Revenue Breakdown (undefined, %) by Region 2025 & 2033
- Figure 2: Asia Pacific Metamaterials Industry Revenue (undefined), by Type 2025 & 2033
- Figure 3: Asia Pacific Metamaterials Industry Revenue Share (%), by Type 2025 & 2033
- Figure 4: Asia Pacific Metamaterials Industry Revenue (undefined), by Application 2025 & 2033
- Figure 5: Asia Pacific Metamaterials Industry Revenue Share (%), by Application 2025 & 2033
- Figure 6: Asia Pacific Metamaterials Industry Revenue (undefined), by End-user Industry 2025 & 2033
- Figure 7: Asia Pacific Metamaterials Industry Revenue Share (%), by End-user Industry 2025 & 2033
- Figure 8: Asia Pacific Metamaterials Industry Revenue (undefined), by Country 2025 & 2033
- Figure 9: Asia Pacific Metamaterials Industry Revenue Share (%), by Country 2025 & 2033
- Figure 10: North America Metamaterials Industry Revenue (undefined), by Type 2025 & 2033
- Figure 11: North America Metamaterials Industry Revenue Share (%), by Type 2025 & 2033
- Figure 12: North America Metamaterials Industry Revenue (undefined), by Application 2025 & 2033
- Figure 13: North America Metamaterials Industry Revenue Share (%), by Application 2025 & 2033
- Figure 14: North America Metamaterials Industry Revenue (undefined), by End-user Industry 2025 & 2033
- Figure 15: North America Metamaterials Industry Revenue Share (%), by End-user Industry 2025 & 2033
- Figure 16: North America Metamaterials Industry Revenue (undefined), by Country 2025 & 2033
- Figure 17: North America Metamaterials Industry Revenue Share (%), by Country 2025 & 2033
- Figure 18: Europe Metamaterials Industry Revenue (undefined), by Type 2025 & 2033
- Figure 19: Europe Metamaterials Industry Revenue Share (%), by Type 2025 & 2033
- Figure 20: Europe Metamaterials Industry Revenue (undefined), by Application 2025 & 2033
- Figure 21: Europe Metamaterials Industry Revenue Share (%), by Application 2025 & 2033
- Figure 22: Europe Metamaterials Industry Revenue (undefined), by End-user Industry 2025 & 2033
- Figure 23: Europe Metamaterials Industry Revenue Share (%), by End-user Industry 2025 & 2033
- Figure 24: Europe Metamaterials Industry Revenue (undefined), by Country 2025 & 2033
- Figure 25: Europe Metamaterials Industry Revenue Share (%), by Country 2025 & 2033
- Figure 26: South America Metamaterials Industry Revenue (undefined), by Type 2025 & 2033
- Figure 27: South America Metamaterials Industry Revenue Share (%), by Type 2025 & 2033
- Figure 28: South America Metamaterials Industry Revenue (undefined), by Application 2025 & 2033
- Figure 29: South America Metamaterials Industry Revenue Share (%), by Application 2025 & 2033
- Figure 30: South America Metamaterials Industry Revenue (undefined), by End-user Industry 2025 & 2033
- Figure 31: South America Metamaterials Industry Revenue Share (%), by End-user Industry 2025 & 2033
- Figure 32: South America Metamaterials Industry Revenue (undefined), by Country 2025 & 2033
- Figure 33: South America Metamaterials Industry Revenue Share (%), by Country 2025 & 2033
- Figure 34: Middle East and Africa Metamaterials Industry Revenue (undefined), by Type 2025 & 2033
- Figure 35: Middle East and Africa Metamaterials Industry Revenue Share (%), by Type 2025 & 2033
- Figure 36: Middle East and Africa Metamaterials Industry Revenue (undefined), by Application 2025 & 2033
- Figure 37: Middle East and Africa Metamaterials Industry Revenue Share (%), by Application 2025 & 2033
- Figure 38: Middle East and Africa Metamaterials Industry Revenue (undefined), by End-user Industry 2025 & 2033
- Figure 39: Middle East and Africa Metamaterials Industry Revenue Share (%), by End-user Industry 2025 & 2033
- Figure 40: Middle East and Africa Metamaterials Industry Revenue (undefined), by Country 2025 & 2033
- Figure 41: Middle East and Africa Metamaterials Industry Revenue Share (%), by Country 2025 & 2033
List of Tables
- Table 1: Global Metamaterials Industry Revenue undefined Forecast, by Type 2020 & 2033
- Table 2: Global Metamaterials Industry Revenue undefined Forecast, by Application 2020 & 2033
- Table 3: Global Metamaterials Industry Revenue undefined Forecast, by End-user Industry 2020 & 2033
- Table 4: Global Metamaterials Industry Revenue undefined Forecast, by Region 2020 & 2033
- Table 5: Global Metamaterials Industry Revenue undefined Forecast, by Type 2020 & 2033
- Table 6: Global Metamaterials Industry Revenue undefined Forecast, by Application 2020 & 2033
- Table 7: Global Metamaterials Industry Revenue undefined Forecast, by End-user Industry 2020 & 2033
- Table 8: Global Metamaterials Industry Revenue undefined Forecast, by Country 2020 & 2033
- Table 9: China Metamaterials Industry Revenue (undefined) Forecast, by Application 2020 & 2033
- Table 10: India Metamaterials Industry Revenue (undefined) Forecast, by Application 2020 & 2033
- Table 11: Japan Metamaterials Industry Revenue (undefined) Forecast, by Application 2020 & 2033
- Table 12: South Korea Metamaterials Industry Revenue (undefined) Forecast, by Application 2020 & 2033
- Table 13: Rest of Asia Pacific Metamaterials Industry Revenue (undefined) Forecast, by Application 2020 & 2033
- Table 14: Global Metamaterials Industry Revenue undefined Forecast, by Type 2020 & 2033
- Table 15: Global Metamaterials Industry Revenue undefined Forecast, by Application 2020 & 2033
- Table 16: Global Metamaterials Industry Revenue undefined Forecast, by End-user Industry 2020 & 2033
- Table 17: Global Metamaterials Industry Revenue undefined Forecast, by Country 2020 & 2033
- Table 18: United States Metamaterials Industry Revenue (undefined) Forecast, by Application 2020 & 2033
- Table 19: Canada Metamaterials Industry Revenue (undefined) Forecast, by Application 2020 & 2033
- Table 20: Mexico Metamaterials Industry Revenue (undefined) Forecast, by Application 2020 & 2033
- Table 21: Rest of North America Metamaterials Industry Revenue (undefined) Forecast, by Application 2020 & 2033
- Table 22: Global Metamaterials Industry Revenue undefined Forecast, by Type 2020 & 2033
- Table 23: Global Metamaterials Industry Revenue undefined Forecast, by Application 2020 & 2033
- Table 24: Global Metamaterials Industry Revenue undefined Forecast, by End-user Industry 2020 & 2033
- Table 25: Global Metamaterials Industry Revenue undefined Forecast, by Country 2020 & 2033
- Table 26: Germany Metamaterials Industry Revenue (undefined) Forecast, by Application 2020 & 2033
- Table 27: United Kingdom Metamaterials Industry Revenue (undefined) Forecast, by Application 2020 & 2033
- Table 28: Italy Metamaterials Industry Revenue (undefined) Forecast, by Application 2020 & 2033
- Table 29: France Metamaterials Industry Revenue (undefined) Forecast, by Application 2020 & 2033
- Table 30: Spain Metamaterials Industry Revenue (undefined) Forecast, by Application 2020 & 2033
- Table 31: Rest of Europe Metamaterials Industry Revenue (undefined) Forecast, by Application 2020 & 2033
- Table 32: Global Metamaterials Industry Revenue undefined Forecast, by Type 2020 & 2033
- Table 33: Global Metamaterials Industry Revenue undefined Forecast, by Application 2020 & 2033
- Table 34: Global Metamaterials Industry Revenue undefined Forecast, by End-user Industry 2020 & 2033
- Table 35: Global Metamaterials Industry Revenue undefined Forecast, by Country 2020 & 2033
- Table 36: Brazil Metamaterials Industry Revenue (undefined) Forecast, by Application 2020 & 2033
- Table 37: Argentina Metamaterials Industry Revenue (undefined) Forecast, by Application 2020 & 2033
- Table 38: Rest of South America Metamaterials Industry Revenue (undefined) Forecast, by Application 2020 & 2033
- Table 39: Global Metamaterials Industry Revenue undefined Forecast, by Type 2020 & 2033
- Table 40: Global Metamaterials Industry Revenue undefined Forecast, by Application 2020 & 2033
- Table 41: Global Metamaterials Industry Revenue undefined Forecast, by End-user Industry 2020 & 2033
- Table 42: Global Metamaterials Industry Revenue undefined Forecast, by Country 2020 & 2033
- Table 43: Saudi Arabia Metamaterials Industry Revenue (undefined) Forecast, by Application 2020 & 2033
- Table 44: South Africa Metamaterials Industry Revenue (undefined) Forecast, by Application 2020 & 2033
- Table 45: Rest of Middle East and Africa Metamaterials Industry Revenue (undefined) Forecast, by Application 2020 & 2033
Frequently Asked Questions
1. What is the projected Compound Annual Growth Rate (CAGR) of the Metamaterials Industry?
The projected CAGR is approximately 27.65%.
2. Which companies are prominent players in the Metamaterials Industry?
Key companies in the market include Echodyne Corp, Evolv Technologies Inc, Fractal Antenna Systems Inc, JEM Engineering, Kymeta Corporation, Metamaterials Inc, Multiwave Technologies AG, Nanohmics Inc, NKT Photonics A/S, TeraView Limited, Metawave Corporation, Aegis Technologies, Metamagnetics, NanoSonic Inc, Nanoscribe GmbH & Co KG*List Not Exhaustive.
3. What are the main segments of the Metamaterials Industry?
The market segments include Type, Application, End-user Industry.
4. Can you provide details about the market size?
The market size is estimated to be USD XXX N/A as of 2022.
5. What are some drivers contributing to market growth?
Increasing R&D Investments for Various Applications; Other Drivers.
6. What are the notable trends driving market growth?
Aerospace and Defense Industry to Dominate the Market.
7. Are there any restraints impacting market growth?
Increasing R&D Investments for Various Applications; Other Drivers.
8. Can you provide examples of recent developments in the market?
November 2022: Meta Materials Inc. announced the launch of its new headquarters and Centre of Excellence in Dartmouth, Nova Scotia. The 68,000-square-foot state-of-the-art facility is the only facility in Canada to combine advanced packaging for semiconductors, unique materials, chemistry research, and the design and manufacturing of holographic and other optical products.
9. What pricing options are available for accessing the report?
Pricing options include single-user, multi-user, and enterprise licenses priced at USD 4750, USD 5250, and USD 8750 respectively.
10. Is the market size provided in terms of value or volume?
The market size is provided in terms of value, measured in N/A.
11. Are there any specific market keywords associated with the report?
Yes, the market keyword associated with the report is "Metamaterials Industry," which aids in identifying and referencing the specific market segment covered.
12. How do I determine which pricing option suits my needs best?
The pricing options vary based on user requirements and access needs. Individual users may opt for single-user licenses, while businesses requiring broader access may choose multi-user or enterprise licenses for cost-effective access to the report.
13. Are there any additional resources or data provided in the Metamaterials Industry report?
While the report offers comprehensive insights, it's advisable to review the specific contents or supplementary materials provided to ascertain if additional resources or data are available.
14. How can I stay updated on further developments or reports in the Metamaterials Industry?
To stay informed about further developments, trends, and reports in the Metamaterials Industry, consider subscribing to industry newsletters, following relevant companies and organizations, or regularly checking reputable industry news sources and publications.
Methodology
Step 1 - Identification of Relevant Samples Size from Population Database


Step 2 - Approaches for Defining Global Market Size (Value, Volume* & Price*)

Note*: In applicable scenarios
Step 3 - Data Sources
Primary Research
- Web Analytics
- Survey Reports
- Research Institute
- Latest Research Reports
- Opinion Leaders
Secondary Research
- Annual Reports
- White Paper
- Latest Press Release
- Industry Association
- Paid Database
- Investor Presentations

Step 4 - Data Triangulation
Involves using different sources of information in order to increase the validity of a study
These sources are likely to be stakeholders in a program - participants, other researchers, program staff, other community members, and so on.
Then we put all data in single framework & apply various statistical tools to find out the dynamic on the market.
During the analysis stage, feedback from the stakeholder groups would be compared to determine areas of agreement as well as areas of divergence