

Key Insights
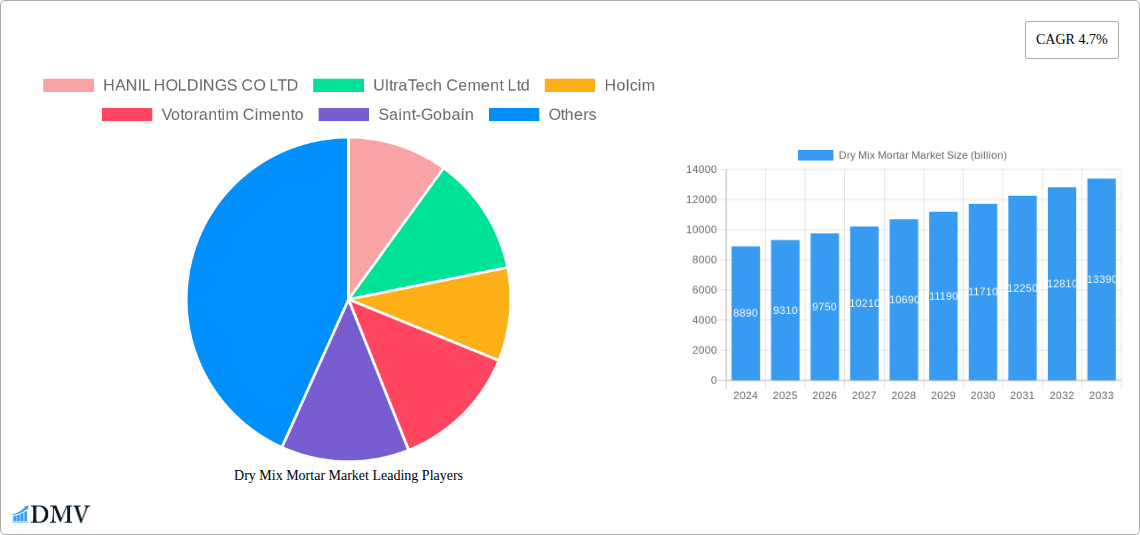
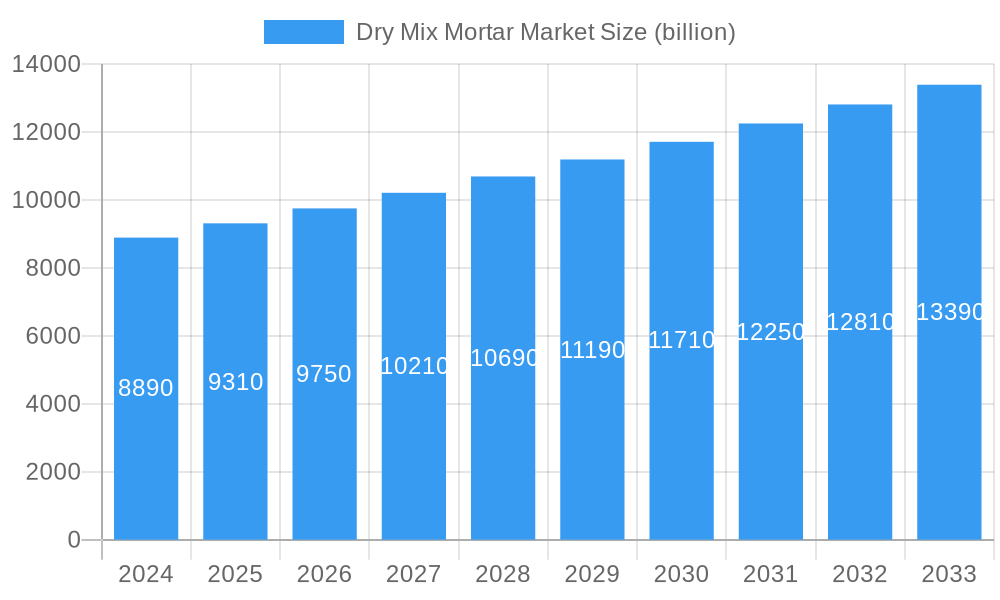
The global Dry Mix Mortar market is poised for robust growth, estimated to reach USD 8.89 billion in 2024. Driven by increasing construction activities worldwide, particularly in emerging economies, and a growing preference for faster and more efficient building solutions, the market is projected to expand at a Compound Annual Growth Rate (CAGR) of 4.7% through 2033. Key growth drivers include the rising demand for sustainable construction materials, advancements in mortar formulations offering enhanced performance, and the significant infrastructure development projects underway across various regions. The inherent advantages of dry mix mortars, such as superior quality control, reduced on-site waste, and ease of use, further propel their adoption over traditional site-mixed mortars. The market's trajectory is further supported by increasing investments in residential and commercial construction, alongside the renovation and refurbishment of existing structures, all of which rely heavily on reliable and high-performance mortar solutions.
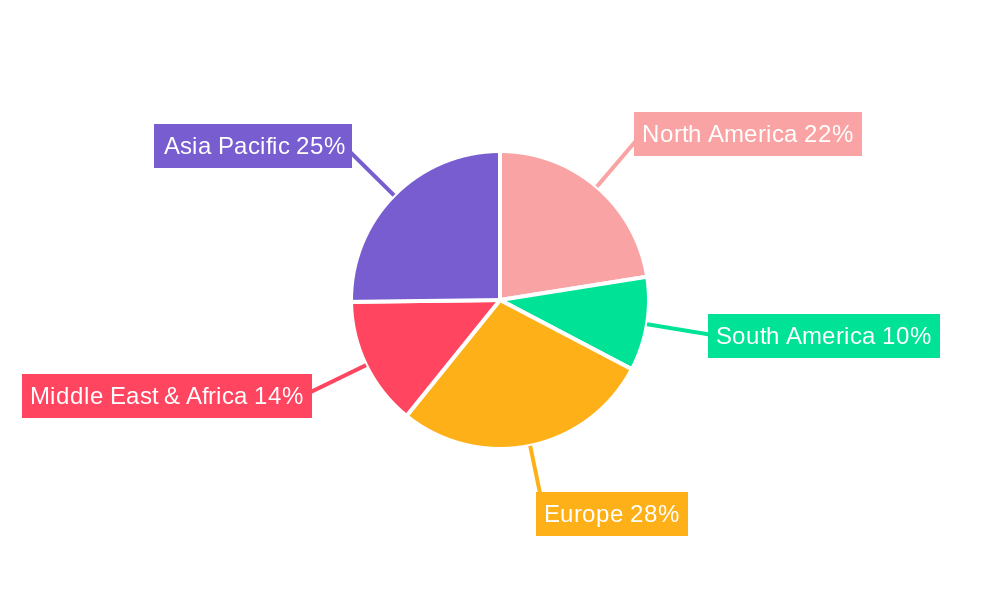
Dry Mix Mortar Market Market Size (In Billion)
The market segmentation reveals strong potential across various end-use sectors and applications. The Infrastructure segment is expected to witness substantial growth due to government initiatives focused on developing and upgrading public amenities. Similarly, the Commercial and Residential sectors are witnessing a surge in new construction and renovation projects, fueling demand for tile adhesives, waterproofing slurries, and plaster and render applications. Insulation and finishing systems are also gaining traction as energy efficiency becomes a paramount concern in modern construction. Geographically, the Asia Pacific region, led by China and India, is anticipated to be a dominant market, owing to rapid urbanization and large-scale infrastructure development. However, North America and Europe are also significant contributors, with a strong emphasis on renovation and sustainable building practices. Leading companies in the market are actively involved in research and development to innovate and expand their product portfolios, catering to diverse market needs and reinforcing their competitive positions.
Dry Mix Mortar Market Company Market Share
This in-depth report offers a strategic analysis of the global Dry Mix Mortar Market, providing critical insights into its evolution, key drivers, and future trajectory. Spanning the historical period of 2019–2024, with a base and estimated year of 2025, and a comprehensive forecast period extending to 2033, this study is an indispensable resource for stakeholders seeking to navigate this dynamic industry. We delve into market composition, industry evolution, regional dominance, product innovations, growth catalysts, potential obstacles, and future opportunities, all underpinned by robust data and expert analysis. With an estimated market size projected to reach billions, understanding the intricate workings of the dry mix mortar sector is paramount for strategic decision-making.
Dry Mix Mortar Market Market Composition & Trends
The Dry Mix Mortar Market exhibits a moderate to high concentration, with a few dominant players holding significant market share, estimated to be in the range of 60-70%. Innovation is primarily driven by advancements in additive technology and the development of specialized formulations to meet evolving construction demands, particularly in areas like energy efficiency and sustainability. The regulatory landscape is increasingly influenced by building codes promoting eco-friendly materials and enhanced performance standards for dry mix mortars. Substitute products, while present in niche applications, have not significantly eroded the core market share of dry mix mortars due to their inherent advantages in consistency, ease of use, and reduced waste. End-user profiles are diverse, encompassing residential, commercial, industrial, institutional, and infrastructure sectors, each with unique material requirements. Mergers and acquisitions (M&A) activity has been a notable trend, with several billion-dollar deals shaping the competitive landscape. For instance, the divestiture of MBCC Group's construction systems business to Sika AG in May 2023 signifies a significant consolidation event within the industry. This strategic consolidation aims to leverage synergies and expand market reach, influencing market share distribution and product portfolios of the involved entities. The overall market value is estimated to be in the tens of billions.
- Market Concentration: Moderate to High, with key players holding significant market share.
- Innovation Catalysts: Additive technology, specialized formulations, sustainable construction.
- Regulatory Landscapes: Building codes promoting eco-friendly materials and performance standards.
- Substitute Products: Limited impact on core market due to inherent advantages of dry mix mortars.
- End-User Profiles: Residential, Commercial, Industrial, Institutional, Infrastructure.
- M&A Activities: Significant, with multi-billion dollar deals shaping the industry.
- Estimated M&A Deal Value: Indicative of substantial strategic investments.
- Market Share Distribution: Influenced by consolidation and strategic partnerships.
Dry Mix Mortar Market Industry Evolution
The global Dry Mix Mortar Market has witnessed a remarkable evolution, driven by continuous technological advancements, shifting consumer preferences, and increasing construction activity worldwide. Historically, traditional site-mixed mortars, while cost-effective in their rudimentary form, often suffered from inconsistencies in quality and performance due to human error and variable material quality. The advent and subsequent refinement of dry mix mortar technology revolutionized the industry by offering pre-engineered solutions that guarantee uniform quality, enhanced workability, and superior performance characteristics. The study period, from 2019 to 2033, encapsulates significant growth trajectories, with the market experiencing a Compound Annual Growth Rate (CAGR) of approximately 5-7% in recent years. This growth has been particularly robust in emerging economies where rapid urbanization and infrastructure development are key drivers.
Technological advancements have been a cornerstone of this evolution. The incorporation of advanced admixtures, such as superplasticizers, redispersible polymer powders, and cellulose ethers, has significantly improved the properties of dry mix mortars, enabling applications like high-strength tile adhesives, self-leveling compounds, and durable waterproofing slurries. These innovations not only enhance performance but also contribute to faster construction times and reduced labor costs, making dry mix mortars increasingly attractive to contractors and developers. The adoption of these advanced materials has seen a substantial increase, with segments like tile adhesives and insulation and finishing systems experiencing growth rates exceeding the market average.
Shifting consumer demands, particularly a growing awareness of sustainability and energy efficiency in construction, have also played a pivotal role. Dry mix mortars contribute to sustainability by minimizing waste through precise batching and reducing transportation costs and emissions associated with on-site mixing. Furthermore, specialized dry mix mortars are being developed to improve the thermal performance of buildings, contributing to energy savings. The residential sector, driven by a growing middle class and demand for better housing, remains a significant consumer. However, the industrial and infrastructure sectors are increasingly adopting dry mix mortars for their specialized applications, such as structural repairs, protective coatings, and high-performance grouts. The estimated market value is projected to reach tens of billions by the end of the forecast period.
Leading Regions, Countries, or Segments in Dry Mix Mortar Market
The dominance within the Dry Mix Mortar Market is a dynamic interplay of regional economic development, infrastructure investment, regulatory frameworks, and application-specific demand. While North America and Europe have historically been mature markets, the Asia-Pacific region is emerging as a powerhouse, driven by rapid industrialization, large-scale urbanization, and significant government investments in infrastructure. Countries like China, India, and Southeast Asian nations are exhibiting substantial growth rates, significantly impacting the global market share.
Within the End Use Sector, the Residential segment consistently holds a substantial market share due to the ongoing demand for housing globally. However, the Infrastructure sector is a rapidly growing segment, fueled by government initiatives for developing transportation networks, public utilities, and smart cities. This is directly translating into increased demand for specialized dry mix mortars used in concrete protection and renovation, grouts for structural strengthening, and robust plaster and render systems. The Commercial and Industrial and Institutional sectors also contribute significantly, driven by new construction projects and the renovation of existing facilities.
When examining the Application segments, Tile Adhesives represent a leading and consistently growing area, a testament to the widespread use of tiles in residential, commercial, and institutional settings, and the superior performance offered by modern dry mix tile adhesives. Plaster and Render applications also command a significant market share due to their foundational role in building exteriors and interiors. Insulation and Finishing Systems are experiencing accelerated growth, driven by increasing demand for energy-efficient buildings and aesthetic architectural finishes. Waterproofing Slurries are crucial for protecting structures from moisture damage, leading to steady demand, especially in regions prone to heavy rainfall or with high water tables.
- Dominant Region: Asia-Pacific, with substantial growth driven by China and India.
- Key Drivers: Rapid urbanization, massive infrastructure development projects, supportive government policies, growing disposable incomes.
- Investment Trends: Billions invested in new construction and renovation.
- Regulatory Support: Favorable building codes encouraging modern construction materials.
- Leading End Use Sector: Residential (historically strong), Infrastructure (rapidly growing).
- Infrastructure Drivers: Government stimulus packages for public works, smart city initiatives, expansion of transportation networks.
- Residential Drivers: Population growth, increasing demand for improved housing standards, urbanization.
- Leading Application: Tile Adhesives (high and consistent demand).
- Tile Adhesive Drivers: Growing popularity of tiles in diverse applications, superior bonding and flexibility of dry mix variants.
- Plaster and Render Drivers: Essential for building envelopes, offering aesthetic and protective qualities.
- Insulation and Finishing Systems Drivers: Energy efficiency mandates, demand for enhanced building aesthetics.
- Waterproofing Slurries Drivers: Protection against moisture damage, extending building lifespan.
Dry Mix Mortar Market Product Innovations
Product innovation in the dry mix mortar market is predominantly focused on enhancing performance, sustainability, and ease of application. Companies are actively developing advanced formulations that offer superior adhesion, increased flexibility, reduced shrinkage, and faster setting times. For instance, the development of lightweight, thin-set mortars like LATICRETE International, Inc.'s 254 Platinum Plus signifies a move towards improved handling and reduced structural load, particularly beneficial in tile adhesive applications. Similarly, the formulation of ready-mixed flowable screed mortars, such as PCI Novoment Flow by an affiliate of MBCC Group, highlights innovation in creating self-leveling compounds with quick setting and curing capabilities, optimizing construction schedules. These advancements are often driven by incorporating specialized polymers and additives that impart unique properties, leading to improved durability and aesthetic finishes.
Propelling Factors for Dry Mix Mortar Market Growth
The Dry Mix Mortar Market is propelled by a confluence of powerful factors. Firstly, the accelerating pace of global urbanization and infrastructure development projects, particularly in emerging economies, creates an insatiable demand for construction materials. Secondly, technological advancements in chemical admixtures have led to the development of high-performance dry mix mortars with enhanced properties such as improved workability, faster setting times, and superior durability, making them more attractive than traditional site-mixed mortars. Thirdly, growing environmental consciousness and stringent building regulations promoting energy efficiency and waste reduction favor dry mix mortars due to their minimal waste generation and potential for incorporating recycled materials. Finally, the increasing trend of modular and pre-fabricated construction further bolsters the demand for consistent and reliable dry mix mortar products.
Obstacles in the Dry Mix Mortar Market Market
Despite robust growth, the Dry Mix Mortar Market faces several obstacles. High initial investment costs for advanced manufacturing facilities can be a barrier for smaller players. Fluctuations in the prices of raw materials, such as cement, sand, and chemical additives, can impact profit margins and pricing strategies. Supply chain disruptions, as evidenced in recent global events, can lead to material shortages and increased lead times. Furthermore, a lack of skilled labor capable of properly applying specialized dry mix mortar systems in certain regions can hinder adoption. Intense competition among manufacturers, coupled with the presence of established traditional mortar providers, also presents challenges. Regulatory hurdles and the need for compliance with evolving building standards in different geographies add another layer of complexity.
Future Opportunities in Dry Mix Mortar Market
The Dry Mix Mortar Market is ripe with future opportunities. The burgeoning demand for sustainable and green building solutions presents a significant avenue for growth, with the development of eco-friendly and bio-based dry mix mortars. The increasing focus on renovation and retrofitting of existing buildings, especially in developed economies, offers substantial potential for specialized repair and restoration mortars. Emerging markets in Africa and Latin America, with their growing construction sectors, represent untapped potential. Furthermore, advancements in nanotechnology and smart materials could lead to the development of self-healing or sensor-embedded mortars, opening up new high-value applications. The expansion of product portfolios to cater to niche applications, such as high-performance industrial flooring and specialized architectural coatings, also represents a promising growth area.
Major Players in the Dry Mix Mortar Market Ecosystem
- HANIL HOLDINGS CO LTD
- UltraTech Cement Ltd
- Holcim
- Votorantim Cimento
- Saint-Gobain
- MBCC Group
- LATICRETE International Inc
- CEMEX S A B de C V
- Ardex Group
- MAPEI S p A
- Sika AG
- SCG
- SAMPYO GROUP
- SIG
- Grupo Puma
Key Developments in Dry Mix Mortar Market Industry
- August 2023: LATICRETE International, Inc. formulated a high-performance, lightweight, thin-set mortar, 254 Platinum Plus, for tile adhesive applications.
- May 2023: PCI, an affiliate of MBCC Group, formulated a ready-mixed flowable screed mortar, PCI Novoment Flow, offering multiple benefits like quick setting and curing.
- May 2023: MBCC group divested its construction systems business, including its subsidiaries, product portfolio, and advanced technologies, to Sika AG.
Strategic Dry Mix Mortar Market Market Forecast
The strategic outlook for the Dry Mix Mortar Market remains exceptionally strong, fueled by sustained global construction activity and the inherent advantages of these advanced materials. The forecast period (2025–2033) is expected to witness significant market expansion, driven by ongoing infrastructure investments, the rising demand for sustainable construction solutions, and continuous product innovation. Key growth catalysts include the increasing adoption of dry mix mortars in emerging economies, the development of specialized formulations for niche applications, and the integration of smart technologies into building materials. The market is poised for a multi-billion dollar valuation, offering substantial opportunities for stakeholders who can adapt to evolving industry trends and leverage technological advancements to meet the dynamic needs of the global construction sector.
Dry Mix Mortar Market Segmentation
-
1. End Use Sector
- 1.1. Commercial
- 1.2. Industrial and Institutional
- 1.3. Infrastructure
- 1.4. Residential
-
2. Application
- 2.1. Concrete Protection and Renovation
- 2.2. Grouts
- 2.3. Insulation and Finishing Systems
- 2.4. Plaster
- 2.5. Render
- 2.6. Tile Adhesive
- 2.7. Water Proofing Slurries
- 2.8. Other Applications
Dry Mix Mortar Market Segmentation By Geography
-
1. North America
- 1.1. United States
- 1.2. Canada
- 1.3. Mexico
-
2. South America
- 2.1. Brazil
- 2.2. Argentina
- 2.3. Rest of South America
-
3. Europe
- 3.1. United Kingdom
- 3.2. Germany
- 3.3. France
- 3.4. Italy
- 3.5. Spain
- 3.6. Russia
- 3.7. Benelux
- 3.8. Nordics
- 3.9. Rest of Europe
-
4. Middle East & Africa
- 4.1. Turkey
- 4.2. Israel
- 4.3. GCC
- 4.4. North Africa
- 4.5. South Africa
- 4.6. Rest of Middle East & Africa
-
5. Asia Pacific
- 5.1. China
- 5.2. India
- 5.3. Japan
- 5.4. South Korea
- 5.5. ASEAN
- 5.6. Oceania
- 5.7. Rest of Asia Pacific
Dry Mix Mortar Market Regional Market Share
Geographic Coverage of Dry Mix Mortar Market
Dry Mix Mortar Market REPORT HIGHLIGHTS
| Aspects | Details |
|---|---|
| Study Period | 2020-2034 |
| Base Year | 2025 |
| Estimated Year | 2026 |
| Forecast Period | 2026-2034 |
| Historical Period | 2020-2025 |
| Growth Rate | CAGR of 4.7% from 2020-2034 |
| Segmentation |
|
Table of Contents
- 1. Introduction
- 1.1. Research Scope
- 1.2. Market Segmentation
- 1.3. Research Objective
- 1.4. Definitions and Assumptions
- 2. Executive Summary
- 2.1. Market Snapshot
- 3. Market Dynamics
- 3.1. Market Drivers
- 3.2. Market Restrains
- 3.3. Market Trends
- 3.4. Market Opportunities
- 4. Market Factor Analysis
- 4.1. Porters Five Forces
- 4.1.1. Bargaining Power of Suppliers
- 4.1.2. Bargaining Power of Buyers
- 4.1.3. Threat of New Entrants
- 4.1.4. Threat of Substitutes
- 4.1.5. Competitive Rivalry
- 4.2. PESTEL analysis
- 4.3. BCG Analysis
- 4.3.1. Stars (High Growth, High Market Share)
- 4.3.2. Cash Cows (Low Growth, High Market Share)
- 4.3.3. Question Mark (High Growth, Low Market Share)
- 4.3.4. Dogs (Low Growth, Low Market Share)
- 4.4. Ansoff Matrix Analysis
- 4.5. Supply Chain Analysis
- 4.6. Regulatory Landscape
- 4.7. Current Market Potential and Opportunity Assessment (TAM–SAM–SOM Framework)
- 4.8. DMV Analyst Note
- 4.1. Porters Five Forces
- 5. Market Analysis, Insights and Forecast 2021-2033
- 5.1. Market Analysis, Insights and Forecast - by End Use Sector
- 5.1.1. Commercial
- 5.1.2. Industrial and Institutional
- 5.1.3. Infrastructure
- 5.1.4. Residential
- 5.2. Market Analysis, Insights and Forecast - by Application
- 5.2.1. Concrete Protection and Renovation
- 5.2.2. Grouts
- 5.2.3. Insulation and Finishing Systems
- 5.2.4. Plaster
- 5.2.5. Render
- 5.2.6. Tile Adhesive
- 5.2.7. Water Proofing Slurries
- 5.2.8. Other Applications
- 5.3. Market Analysis, Insights and Forecast - by Region
- 5.3.1. North America
- 5.3.2. South America
- 5.3.3. Europe
- 5.3.4. Middle East & Africa
- 5.3.5. Asia Pacific
- 5.1. Market Analysis, Insights and Forecast - by End Use Sector
- 6. Global Dry Mix Mortar Market Analysis, Insights and Forecast, 2021-2033
- 6.1. Market Analysis, Insights and Forecast - by End Use Sector
- 6.1.1. Commercial
- 6.1.2. Industrial and Institutional
- 6.1.3. Infrastructure
- 6.1.4. Residential
- 6.2. Market Analysis, Insights and Forecast - by Application
- 6.2.1. Concrete Protection and Renovation
- 6.2.2. Grouts
- 6.2.3. Insulation and Finishing Systems
- 6.2.4. Plaster
- 6.2.5. Render
- 6.2.6. Tile Adhesive
- 6.2.7. Water Proofing Slurries
- 6.2.8. Other Applications
- 6.1. Market Analysis, Insights and Forecast - by End Use Sector
- 7. North America Dry Mix Mortar Market Analysis, Insights and Forecast, 2020-2032
- 7.1. Market Analysis, Insights and Forecast - by End Use Sector
- 7.1.1. Commercial
- 7.1.2. Industrial and Institutional
- 7.1.3. Infrastructure
- 7.1.4. Residential
- 7.2. Market Analysis, Insights and Forecast - by Application
- 7.2.1. Concrete Protection and Renovation
- 7.2.2. Grouts
- 7.2.3. Insulation and Finishing Systems
- 7.2.4. Plaster
- 7.2.5. Render
- 7.2.6. Tile Adhesive
- 7.2.7. Water Proofing Slurries
- 7.2.8. Other Applications
- 7.1. Market Analysis, Insights and Forecast - by End Use Sector
- 8. South America Dry Mix Mortar Market Analysis, Insights and Forecast, 2020-2032
- 8.1. Market Analysis, Insights and Forecast - by End Use Sector
- 8.1.1. Commercial
- 8.1.2. Industrial and Institutional
- 8.1.3. Infrastructure
- 8.1.4. Residential
- 8.2. Market Analysis, Insights and Forecast - by Application
- 8.2.1. Concrete Protection and Renovation
- 8.2.2. Grouts
- 8.2.3. Insulation and Finishing Systems
- 8.2.4. Plaster
- 8.2.5. Render
- 8.2.6. Tile Adhesive
- 8.2.7. Water Proofing Slurries
- 8.2.8. Other Applications
- 8.1. Market Analysis, Insights and Forecast - by End Use Sector
- 9. Europe Dry Mix Mortar Market Analysis, Insights and Forecast, 2020-2032
- 9.1. Market Analysis, Insights and Forecast - by End Use Sector
- 9.1.1. Commercial
- 9.1.2. Industrial and Institutional
- 9.1.3. Infrastructure
- 9.1.4. Residential
- 9.2. Market Analysis, Insights and Forecast - by Application
- 9.2.1. Concrete Protection and Renovation
- 9.2.2. Grouts
- 9.2.3. Insulation and Finishing Systems
- 9.2.4. Plaster
- 9.2.5. Render
- 9.2.6. Tile Adhesive
- 9.2.7. Water Proofing Slurries
- 9.2.8. Other Applications
- 9.1. Market Analysis, Insights and Forecast - by End Use Sector
- 10. Middle East & Africa Dry Mix Mortar Market Analysis, Insights and Forecast, 2020-2032
- 10.1. Market Analysis, Insights and Forecast - by End Use Sector
- 10.1.1. Commercial
- 10.1.2. Industrial and Institutional
- 10.1.3. Infrastructure
- 10.1.4. Residential
- 10.2. Market Analysis, Insights and Forecast - by Application
- 10.2.1. Concrete Protection and Renovation
- 10.2.2. Grouts
- 10.2.3. Insulation and Finishing Systems
- 10.2.4. Plaster
- 10.2.5. Render
- 10.2.6. Tile Adhesive
- 10.2.7. Water Proofing Slurries
- 10.2.8. Other Applications
- 10.1. Market Analysis, Insights and Forecast - by End Use Sector
- 11. Asia Pacific Dry Mix Mortar Market Analysis, Insights and Forecast, 2020-2032
- 11.1. Market Analysis, Insights and Forecast - by End Use Sector
- 11.1.1. Commercial
- 11.1.2. Industrial and Institutional
- 11.1.3. Infrastructure
- 11.1.4. Residential
- 11.2. Market Analysis, Insights and Forecast - by Application
- 11.2.1. Concrete Protection and Renovation
- 11.2.2. Grouts
- 11.2.3. Insulation and Finishing Systems
- 11.2.4. Plaster
- 11.2.5. Render
- 11.2.6. Tile Adhesive
- 11.2.7. Water Proofing Slurries
- 11.2.8. Other Applications
- 11.1. Market Analysis, Insights and Forecast - by End Use Sector
- 12. Competitive Analysis
- 12.1. Company Profiles
- 12.1.1 HANIL HOLDINGS CO LTD
- 12.1.1.1. Company Overview
- 12.1.1.2. Products
- 12.1.1.3. Company Financials
- 12.1.1.4. SWOT Analysis
- 12.1.2 UltraTech Cement Ltd
- 12.1.2.1. Company Overview
- 12.1.2.2. Products
- 12.1.2.3. Company Financials
- 12.1.2.4. SWOT Analysis
- 12.1.3 Holcim
- 12.1.3.1. Company Overview
- 12.1.3.2. Products
- 12.1.3.3. Company Financials
- 12.1.3.4. SWOT Analysis
- 12.1.4 Votorantim Cimento
- 12.1.4.1. Company Overview
- 12.1.4.2. Products
- 12.1.4.3. Company Financials
- 12.1.4.4. SWOT Analysis
- 12.1.5 Saint-Gobain
- 12.1.5.1. Company Overview
- 12.1.5.2. Products
- 12.1.5.3. Company Financials
- 12.1.5.4. SWOT Analysis
- 12.1.6 MBCC Group
- 12.1.6.1. Company Overview
- 12.1.6.2. Products
- 12.1.6.3. Company Financials
- 12.1.6.4. SWOT Analysis
- 12.1.7 LATICRETE International Inc
- 12.1.7.1. Company Overview
- 12.1.7.2. Products
- 12.1.7.3. Company Financials
- 12.1.7.4. SWOT Analysis
- 12.1.8 CEMEX S A B de C V
- 12.1.8.1. Company Overview
- 12.1.8.2. Products
- 12.1.8.3. Company Financials
- 12.1.8.4. SWOT Analysis
- 12.1.9 Ardex Group
- 12.1.9.1. Company Overview
- 12.1.9.2. Products
- 12.1.9.3. Company Financials
- 12.1.9.4. SWOT Analysis
- 12.1.10 MAPEI S p A
- 12.1.10.1. Company Overview
- 12.1.10.2. Products
- 12.1.10.3. Company Financials
- 12.1.10.4. SWOT Analysis
- 12.1.11 Sika AG
- 12.1.11.1. Company Overview
- 12.1.11.2. Products
- 12.1.11.3. Company Financials
- 12.1.11.4. SWOT Analysis
- 12.1.12 SCG
- 12.1.12.1. Company Overview
- 12.1.12.2. Products
- 12.1.12.3. Company Financials
- 12.1.12.4. SWOT Analysis
- 12.1.13 SAMPYO GROUP
- 12.1.13.1. Company Overview
- 12.1.13.2. Products
- 12.1.13.3. Company Financials
- 12.1.13.4. SWOT Analysis
- 12.1.14 SIG
- 12.1.14.1. Company Overview
- 12.1.14.2. Products
- 12.1.14.3. Company Financials
- 12.1.14.4. SWOT Analysis
- 12.1.15 Grupo Puma
- 12.1.15.1. Company Overview
- 12.1.15.2. Products
- 12.1.15.3. Company Financials
- 12.1.15.4. SWOT Analysis
- 12.1.1 HANIL HOLDINGS CO LTD
- 12.2. Market Entropy
- 12.2.1 Company's Key Areas Served
- 12.2.2 Recent Developments
- 12.3. Company Market Share Analysis 2025
- 12.3.1 Top 5 Companies Market Share Analysis
- 12.3.2 Top 3 Companies Market Share Analysis
- 12.4. List of Potential Customers
- 13. Research Methodology
List of Figures
- Figure 1: Global Dry Mix Mortar Market Revenue Breakdown (billion, %) by Region 2025 & 2033
- Figure 2: Global Dry Mix Mortar Market Volume Breakdown (K Tons, %) by Region 2025 & 2033
- Figure 3: North America Dry Mix Mortar Market Revenue (billion), by End Use Sector 2025 & 2033
- Figure 4: North America Dry Mix Mortar Market Volume (K Tons), by End Use Sector 2025 & 2033
- Figure 5: North America Dry Mix Mortar Market Revenue Share (%), by End Use Sector 2025 & 2033
- Figure 6: North America Dry Mix Mortar Market Volume Share (%), by End Use Sector 2025 & 2033
- Figure 7: North America Dry Mix Mortar Market Revenue (billion), by Application 2025 & 2033
- Figure 8: North America Dry Mix Mortar Market Volume (K Tons), by Application 2025 & 2033
- Figure 9: North America Dry Mix Mortar Market Revenue Share (%), by Application 2025 & 2033
- Figure 10: North America Dry Mix Mortar Market Volume Share (%), by Application 2025 & 2033
- Figure 11: North America Dry Mix Mortar Market Revenue (billion), by Country 2025 & 2033
- Figure 12: North America Dry Mix Mortar Market Volume (K Tons), by Country 2025 & 2033
- Figure 13: North America Dry Mix Mortar Market Revenue Share (%), by Country 2025 & 2033
- Figure 14: North America Dry Mix Mortar Market Volume Share (%), by Country 2025 & 2033
- Figure 15: South America Dry Mix Mortar Market Revenue (billion), by End Use Sector 2025 & 2033
- Figure 16: South America Dry Mix Mortar Market Volume (K Tons), by End Use Sector 2025 & 2033
- Figure 17: South America Dry Mix Mortar Market Revenue Share (%), by End Use Sector 2025 & 2033
- Figure 18: South America Dry Mix Mortar Market Volume Share (%), by End Use Sector 2025 & 2033
- Figure 19: South America Dry Mix Mortar Market Revenue (billion), by Application 2025 & 2033
- Figure 20: South America Dry Mix Mortar Market Volume (K Tons), by Application 2025 & 2033
- Figure 21: South America Dry Mix Mortar Market Revenue Share (%), by Application 2025 & 2033
- Figure 22: South America Dry Mix Mortar Market Volume Share (%), by Application 2025 & 2033
- Figure 23: South America Dry Mix Mortar Market Revenue (billion), by Country 2025 & 2033
- Figure 24: South America Dry Mix Mortar Market Volume (K Tons), by Country 2025 & 2033
- Figure 25: South America Dry Mix Mortar Market Revenue Share (%), by Country 2025 & 2033
- Figure 26: South America Dry Mix Mortar Market Volume Share (%), by Country 2025 & 2033
- Figure 27: Europe Dry Mix Mortar Market Revenue (billion), by End Use Sector 2025 & 2033
- Figure 28: Europe Dry Mix Mortar Market Volume (K Tons), by End Use Sector 2025 & 2033
- Figure 29: Europe Dry Mix Mortar Market Revenue Share (%), by End Use Sector 2025 & 2033
- Figure 30: Europe Dry Mix Mortar Market Volume Share (%), by End Use Sector 2025 & 2033
- Figure 31: Europe Dry Mix Mortar Market Revenue (billion), by Application 2025 & 2033
- Figure 32: Europe Dry Mix Mortar Market Volume (K Tons), by Application 2025 & 2033
- Figure 33: Europe Dry Mix Mortar Market Revenue Share (%), by Application 2025 & 2033
- Figure 34: Europe Dry Mix Mortar Market Volume Share (%), by Application 2025 & 2033
- Figure 35: Europe Dry Mix Mortar Market Revenue (billion), by Country 2025 & 2033
- Figure 36: Europe Dry Mix Mortar Market Volume (K Tons), by Country 2025 & 2033
- Figure 37: Europe Dry Mix Mortar Market Revenue Share (%), by Country 2025 & 2033
- Figure 38: Europe Dry Mix Mortar Market Volume Share (%), by Country 2025 & 2033
- Figure 39: Middle East & Africa Dry Mix Mortar Market Revenue (billion), by End Use Sector 2025 & 2033
- Figure 40: Middle East & Africa Dry Mix Mortar Market Volume (K Tons), by End Use Sector 2025 & 2033
- Figure 41: Middle East & Africa Dry Mix Mortar Market Revenue Share (%), by End Use Sector 2025 & 2033
- Figure 42: Middle East & Africa Dry Mix Mortar Market Volume Share (%), by End Use Sector 2025 & 2033
- Figure 43: Middle East & Africa Dry Mix Mortar Market Revenue (billion), by Application 2025 & 2033
- Figure 44: Middle East & Africa Dry Mix Mortar Market Volume (K Tons), by Application 2025 & 2033
- Figure 45: Middle East & Africa Dry Mix Mortar Market Revenue Share (%), by Application 2025 & 2033
- Figure 46: Middle East & Africa Dry Mix Mortar Market Volume Share (%), by Application 2025 & 2033
- Figure 47: Middle East & Africa Dry Mix Mortar Market Revenue (billion), by Country 2025 & 2033
- Figure 48: Middle East & Africa Dry Mix Mortar Market Volume (K Tons), by Country 2025 & 2033
- Figure 49: Middle East & Africa Dry Mix Mortar Market Revenue Share (%), by Country 2025 & 2033
- Figure 50: Middle East & Africa Dry Mix Mortar Market Volume Share (%), by Country 2025 & 2033
- Figure 51: Asia Pacific Dry Mix Mortar Market Revenue (billion), by End Use Sector 2025 & 2033
- Figure 52: Asia Pacific Dry Mix Mortar Market Volume (K Tons), by End Use Sector 2025 & 2033
- Figure 53: Asia Pacific Dry Mix Mortar Market Revenue Share (%), by End Use Sector 2025 & 2033
- Figure 54: Asia Pacific Dry Mix Mortar Market Volume Share (%), by End Use Sector 2025 & 2033
- Figure 55: Asia Pacific Dry Mix Mortar Market Revenue (billion), by Application 2025 & 2033
- Figure 56: Asia Pacific Dry Mix Mortar Market Volume (K Tons), by Application 2025 & 2033
- Figure 57: Asia Pacific Dry Mix Mortar Market Revenue Share (%), by Application 2025 & 2033
- Figure 58: Asia Pacific Dry Mix Mortar Market Volume Share (%), by Application 2025 & 2033
- Figure 59: Asia Pacific Dry Mix Mortar Market Revenue (billion), by Country 2025 & 2033
- Figure 60: Asia Pacific Dry Mix Mortar Market Volume (K Tons), by Country 2025 & 2033
- Figure 61: Asia Pacific Dry Mix Mortar Market Revenue Share (%), by Country 2025 & 2033
- Figure 62: Asia Pacific Dry Mix Mortar Market Volume Share (%), by Country 2025 & 2033
List of Tables
- Table 1: Global Dry Mix Mortar Market Revenue billion Forecast, by End Use Sector 2020 & 2033
- Table 2: Global Dry Mix Mortar Market Volume K Tons Forecast, by End Use Sector 2020 & 2033
- Table 3: Global Dry Mix Mortar Market Revenue billion Forecast, by Application 2020 & 2033
- Table 4: Global Dry Mix Mortar Market Volume K Tons Forecast, by Application 2020 & 2033
- Table 5: Global Dry Mix Mortar Market Revenue billion Forecast, by Region 2020 & 2033
- Table 6: Global Dry Mix Mortar Market Volume K Tons Forecast, by Region 2020 & 2033
- Table 7: Global Dry Mix Mortar Market Revenue billion Forecast, by End Use Sector 2020 & 2033
- Table 8: Global Dry Mix Mortar Market Volume K Tons Forecast, by End Use Sector 2020 & 2033
- Table 9: Global Dry Mix Mortar Market Revenue billion Forecast, by Application 2020 & 2033
- Table 10: Global Dry Mix Mortar Market Volume K Tons Forecast, by Application 2020 & 2033
- Table 11: Global Dry Mix Mortar Market Revenue billion Forecast, by Country 2020 & 2033
- Table 12: Global Dry Mix Mortar Market Volume K Tons Forecast, by Country 2020 & 2033
- Table 13: United States Dry Mix Mortar Market Revenue (billion) Forecast, by Application 2020 & 2033
- Table 14: United States Dry Mix Mortar Market Volume (K Tons) Forecast, by Application 2020 & 2033
- Table 15: Canada Dry Mix Mortar Market Revenue (billion) Forecast, by Application 2020 & 2033
- Table 16: Canada Dry Mix Mortar Market Volume (K Tons) Forecast, by Application 2020 & 2033
- Table 17: Mexico Dry Mix Mortar Market Revenue (billion) Forecast, by Application 2020 & 2033
- Table 18: Mexico Dry Mix Mortar Market Volume (K Tons) Forecast, by Application 2020 & 2033
- Table 19: Global Dry Mix Mortar Market Revenue billion Forecast, by End Use Sector 2020 & 2033
- Table 20: Global Dry Mix Mortar Market Volume K Tons Forecast, by End Use Sector 2020 & 2033
- Table 21: Global Dry Mix Mortar Market Revenue billion Forecast, by Application 2020 & 2033
- Table 22: Global Dry Mix Mortar Market Volume K Tons Forecast, by Application 2020 & 2033
- Table 23: Global Dry Mix Mortar Market Revenue billion Forecast, by Country 2020 & 2033
- Table 24: Global Dry Mix Mortar Market Volume K Tons Forecast, by Country 2020 & 2033
- Table 25: Brazil Dry Mix Mortar Market Revenue (billion) Forecast, by Application 2020 & 2033
- Table 26: Brazil Dry Mix Mortar Market Volume (K Tons) Forecast, by Application 2020 & 2033
- Table 27: Argentina Dry Mix Mortar Market Revenue (billion) Forecast, by Application 2020 & 2033
- Table 28: Argentina Dry Mix Mortar Market Volume (K Tons) Forecast, by Application 2020 & 2033
- Table 29: Rest of South America Dry Mix Mortar Market Revenue (billion) Forecast, by Application 2020 & 2033
- Table 30: Rest of South America Dry Mix Mortar Market Volume (K Tons) Forecast, by Application 2020 & 2033
- Table 31: Global Dry Mix Mortar Market Revenue billion Forecast, by End Use Sector 2020 & 2033
- Table 32: Global Dry Mix Mortar Market Volume K Tons Forecast, by End Use Sector 2020 & 2033
- Table 33: Global Dry Mix Mortar Market Revenue billion Forecast, by Application 2020 & 2033
- Table 34: Global Dry Mix Mortar Market Volume K Tons Forecast, by Application 2020 & 2033
- Table 35: Global Dry Mix Mortar Market Revenue billion Forecast, by Country 2020 & 2033
- Table 36: Global Dry Mix Mortar Market Volume K Tons Forecast, by Country 2020 & 2033
- Table 37: United Kingdom Dry Mix Mortar Market Revenue (billion) Forecast, by Application 2020 & 2033
- Table 38: United Kingdom Dry Mix Mortar Market Volume (K Tons) Forecast, by Application 2020 & 2033
- Table 39: Germany Dry Mix Mortar Market Revenue (billion) Forecast, by Application 2020 & 2033
- Table 40: Germany Dry Mix Mortar Market Volume (K Tons) Forecast, by Application 2020 & 2033
- Table 41: France Dry Mix Mortar Market Revenue (billion) Forecast, by Application 2020 & 2033
- Table 42: France Dry Mix Mortar Market Volume (K Tons) Forecast, by Application 2020 & 2033
- Table 43: Italy Dry Mix Mortar Market Revenue (billion) Forecast, by Application 2020 & 2033
- Table 44: Italy Dry Mix Mortar Market Volume (K Tons) Forecast, by Application 2020 & 2033
- Table 45: Spain Dry Mix Mortar Market Revenue (billion) Forecast, by Application 2020 & 2033
- Table 46: Spain Dry Mix Mortar Market Volume (K Tons) Forecast, by Application 2020 & 2033
- Table 47: Russia Dry Mix Mortar Market Revenue (billion) Forecast, by Application 2020 & 2033
- Table 48: Russia Dry Mix Mortar Market Volume (K Tons) Forecast, by Application 2020 & 2033
- Table 49: Benelux Dry Mix Mortar Market Revenue (billion) Forecast, by Application 2020 & 2033
- Table 50: Benelux Dry Mix Mortar Market Volume (K Tons) Forecast, by Application 2020 & 2033
- Table 51: Nordics Dry Mix Mortar Market Revenue (billion) Forecast, by Application 2020 & 2033
- Table 52: Nordics Dry Mix Mortar Market Volume (K Tons) Forecast, by Application 2020 & 2033
- Table 53: Rest of Europe Dry Mix Mortar Market Revenue (billion) Forecast, by Application 2020 & 2033
- Table 54: Rest of Europe Dry Mix Mortar Market Volume (K Tons) Forecast, by Application 2020 & 2033
- Table 55: Global Dry Mix Mortar Market Revenue billion Forecast, by End Use Sector 2020 & 2033
- Table 56: Global Dry Mix Mortar Market Volume K Tons Forecast, by End Use Sector 2020 & 2033
- Table 57: Global Dry Mix Mortar Market Revenue billion Forecast, by Application 2020 & 2033
- Table 58: Global Dry Mix Mortar Market Volume K Tons Forecast, by Application 2020 & 2033
- Table 59: Global Dry Mix Mortar Market Revenue billion Forecast, by Country 2020 & 2033
- Table 60: Global Dry Mix Mortar Market Volume K Tons Forecast, by Country 2020 & 2033
- Table 61: Turkey Dry Mix Mortar Market Revenue (billion) Forecast, by Application 2020 & 2033
- Table 62: Turkey Dry Mix Mortar Market Volume (K Tons) Forecast, by Application 2020 & 2033
- Table 63: Israel Dry Mix Mortar Market Revenue (billion) Forecast, by Application 2020 & 2033
- Table 64: Israel Dry Mix Mortar Market Volume (K Tons) Forecast, by Application 2020 & 2033
- Table 65: GCC Dry Mix Mortar Market Revenue (billion) Forecast, by Application 2020 & 2033
- Table 66: GCC Dry Mix Mortar Market Volume (K Tons) Forecast, by Application 2020 & 2033
- Table 67: North Africa Dry Mix Mortar Market Revenue (billion) Forecast, by Application 2020 & 2033
- Table 68: North Africa Dry Mix Mortar Market Volume (K Tons) Forecast, by Application 2020 & 2033
- Table 69: South Africa Dry Mix Mortar Market Revenue (billion) Forecast, by Application 2020 & 2033
- Table 70: South Africa Dry Mix Mortar Market Volume (K Tons) Forecast, by Application 2020 & 2033
- Table 71: Rest of Middle East & Africa Dry Mix Mortar Market Revenue (billion) Forecast, by Application 2020 & 2033
- Table 72: Rest of Middle East & Africa Dry Mix Mortar Market Volume (K Tons) Forecast, by Application 2020 & 2033
- Table 73: Global Dry Mix Mortar Market Revenue billion Forecast, by End Use Sector 2020 & 2033
- Table 74: Global Dry Mix Mortar Market Volume K Tons Forecast, by End Use Sector 2020 & 2033
- Table 75: Global Dry Mix Mortar Market Revenue billion Forecast, by Application 2020 & 2033
- Table 76: Global Dry Mix Mortar Market Volume K Tons Forecast, by Application 2020 & 2033
- Table 77: Global Dry Mix Mortar Market Revenue billion Forecast, by Country 2020 & 2033
- Table 78: Global Dry Mix Mortar Market Volume K Tons Forecast, by Country 2020 & 2033
- Table 79: China Dry Mix Mortar Market Revenue (billion) Forecast, by Application 2020 & 2033
- Table 80: China Dry Mix Mortar Market Volume (K Tons) Forecast, by Application 2020 & 2033
- Table 81: India Dry Mix Mortar Market Revenue (billion) Forecast, by Application 2020 & 2033
- Table 82: India Dry Mix Mortar Market Volume (K Tons) Forecast, by Application 2020 & 2033
- Table 83: Japan Dry Mix Mortar Market Revenue (billion) Forecast, by Application 2020 & 2033
- Table 84: Japan Dry Mix Mortar Market Volume (K Tons) Forecast, by Application 2020 & 2033
- Table 85: South Korea Dry Mix Mortar Market Revenue (billion) Forecast, by Application 2020 & 2033
- Table 86: South Korea Dry Mix Mortar Market Volume (K Tons) Forecast, by Application 2020 & 2033
- Table 87: ASEAN Dry Mix Mortar Market Revenue (billion) Forecast, by Application 2020 & 2033
- Table 88: ASEAN Dry Mix Mortar Market Volume (K Tons) Forecast, by Application 2020 & 2033
- Table 89: Oceania Dry Mix Mortar Market Revenue (billion) Forecast, by Application 2020 & 2033
- Table 90: Oceania Dry Mix Mortar Market Volume (K Tons) Forecast, by Application 2020 & 2033
- Table 91: Rest of Asia Pacific Dry Mix Mortar Market Revenue (billion) Forecast, by Application 2020 & 2033
- Table 92: Rest of Asia Pacific Dry Mix Mortar Market Volume (K Tons) Forecast, by Application 2020 & 2033
Frequently Asked Questions
1. What is the projected Compound Annual Growth Rate (CAGR) of the Dry Mix Mortar Market?
The projected CAGR is approximately 4.7%.
2. Which companies are prominent players in the Dry Mix Mortar Market?
Key companies in the market include HANIL HOLDINGS CO LTD, UltraTech Cement Ltd, Holcim, Votorantim Cimento, Saint-Gobain, MBCC Group, LATICRETE International Inc, CEMEX S A B de C V, Ardex Group, MAPEI S p A, Sika AG, SCG, SAMPYO GROUP, SIG, Grupo Puma.
3. What are the main segments of the Dry Mix Mortar Market?
The market segments include End Use Sector, Application.
4. Can you provide details about the market size?
The market size is estimated to be USD 8.89 billion as of 2022.
5. What are some drivers contributing to market growth?
; Banning/ Limiting Use of Plastics used in packaging applications.
6. What are the notable trends driving market growth?
OTHER KEY INDUSTRY TRENDS COVERED IN THE REPORT.
7. Are there any restraints impacting market growth?
; Harmful Amines in Dyes; Paperless Green Initiatives.
8. Can you provide examples of recent developments in the market?
August 2023: LATICRETE International, Inc. formulated a high-performance, lightweight, thin-set mortar, 254 Platinum Plus, for tile adhesive applications.May 2023: PCI, an affiliate of MBCC Group, formulated a ready-mixed flowable screed mortar, PCI Novoment Flow, offering multiple benefits like quick setting and curing.May 2023: MBCC group divested its construction systems business, including its subsidiaries, product portfolio, and advanced technologies, to Sika AG.
9. What pricing options are available for accessing the report?
Pricing options include single-user, multi-user, and enterprise licenses priced at USD 3800, USD 4500, and USD 5800 respectively.
10. Is the market size provided in terms of value or volume?
The market size is provided in terms of value, measured in billion and volume, measured in K Tons.
11. Are there any specific market keywords associated with the report?
Yes, the market keyword associated with the report is "Dry Mix Mortar Market," which aids in identifying and referencing the specific market segment covered.
12. How do I determine which pricing option suits my needs best?
The pricing options vary based on user requirements and access needs. Individual users may opt for single-user licenses, while businesses requiring broader access may choose multi-user or enterprise licenses for cost-effective access to the report.
13. Are there any additional resources or data provided in the Dry Mix Mortar Market report?
While the report offers comprehensive insights, it's advisable to review the specific contents or supplementary materials provided to ascertain if additional resources or data are available.
14. How can I stay updated on further developments or reports in the Dry Mix Mortar Market?
To stay informed about further developments, trends, and reports in the Dry Mix Mortar Market, consider subscribing to industry newsletters, following relevant companies and organizations, or regularly checking reputable industry news sources and publications.
Methodology
Step 1 - Identification of Relevant Samples Size from Population Database


Step 2 - Approaches for Defining Global Market Size (Value, Volume* & Price*)

Note*: In applicable scenarios
Step 3 - Data Sources
Primary Research
- Web Analytics
- Survey Reports
- Research Institute
- Latest Research Reports
- Opinion Leaders
Secondary Research
- Annual Reports
- White Paper
- Latest Press Release
- Industry Association
- Paid Database
- Investor Presentations

Step 4 - Data Triangulation
Involves using different sources of information in order to increase the validity of a study
These sources are likely to be stakeholders in a program - participants, other researchers, program staff, other community members, and so on.
Then we put all data in single framework & apply various statistical tools to find out the dynamic on the market.
During the analysis stage, feedback from the stakeholder groups would be compared to determine areas of agreement as well as areas of divergence