

Key Insights
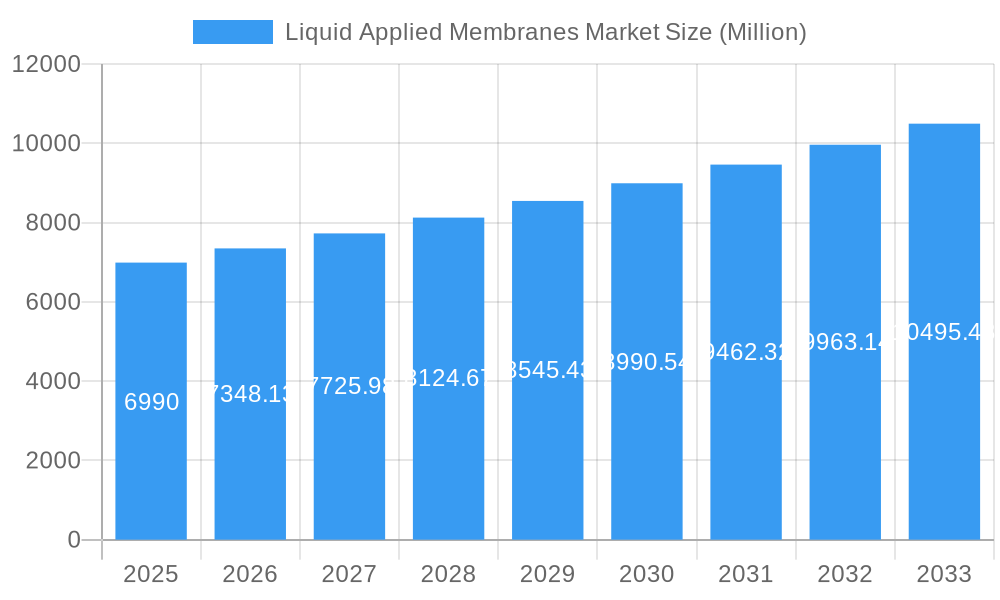
The global Liquid Applied Membranes (LAM) market is experiencing robust expansion, driven by increasing construction activities and a growing emphasis on building envelope protection. With a current market size of $6,990 million in 2025 and a projected Compound Annual Growth Rate (CAGR) of 5.25%, the market is poised for significant value appreciation throughout the forecast period (2025-2033). This growth is primarily fueled by the escalating demand for advanced waterproofing and protective solutions in both residential and commercial construction sectors. The inherent benefits of LAMs, such as their seamless application, excellent adhesion, and ability to form a monolithic barrier against moisture ingress, are key differentiators. Furthermore, stringent building codes and a heightened awareness of the long-term economic and structural advantages of effective waterproofing are compelling property owners and developers to invest in these high-performance materials. The trend towards sustainable construction practices also favors LAMs, many of which offer low VOC content and contribute to improved building energy efficiency through enhanced thermal performance.
Liquid Applied Membranes Market Market Size (In Billion)
The market's expansion is further supported by a diversified range of applications, with roofing and walls representing the dominant segments. The underground and tunnels segment is also witnessing steady growth due to infrastructure development initiatives. Polyurethane and cementitious LAMs are leading the product type segments, offering distinct advantages in terms of flexibility, durability, and cost-effectiveness, respectively. While the market enjoys strong tailwinds, potential restraints include the initial cost of certain advanced LAM formulations compared to traditional methods and the need for skilled labor for optimal application. However, the long-term performance benefits and reduced maintenance requirements often outweigh these initial considerations. The competitive landscape is characterized by the presence of established global players and regional specialists, fostering innovation and driving product development to meet evolving market demands for enhanced performance, sustainability, and ease of application.
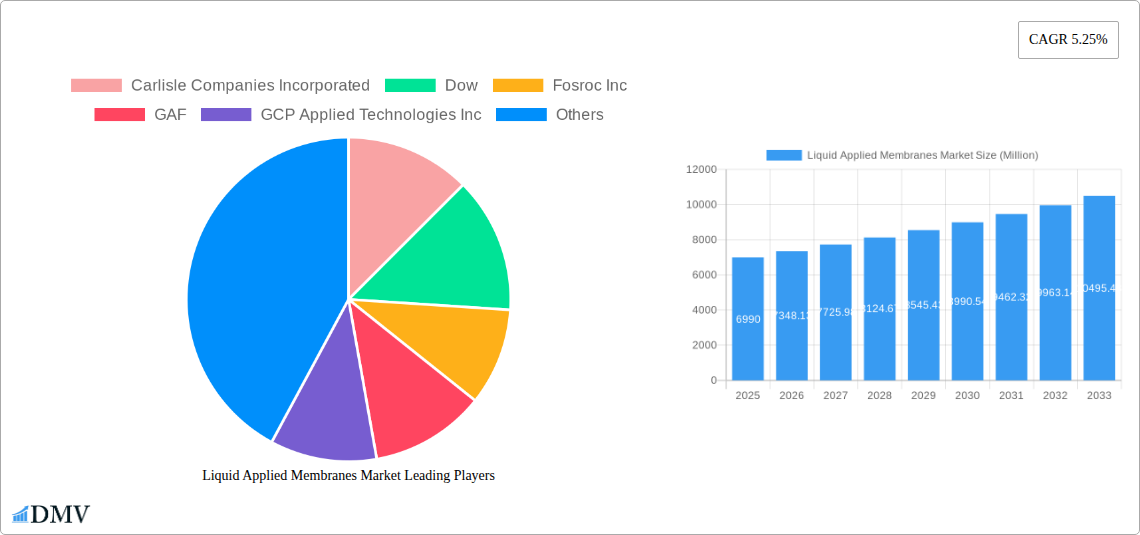
Liquid Applied Membranes Market Company Market Share
This in-depth Liquid Applied Membranes Market report provides a meticulously researched analysis of the global market, forecasting growth and identifying key trends from 2019 to 2033. With a base year of 2025 and an estimated year also of 2025, the forecast period spans 2025–2033, building upon robust data from the historical period (2019–2024). Discover critical insights into polyurethane liquid membranes, cementitious liquid membranes, bituminous liquid membranes, and other types, alongside their applications in roofing, walls, underground and tunnels, and other key sectors.
Liquid Applied Membranes Market Market Composition & Trends
The global Liquid Applied Membranes Market exhibits a moderate level of concentration, with a few key players holding significant market share, estimated to be around 70% within the top 10 vendors. Innovation is primarily driven by the demand for sustainable and high-performance building materials, leading to advancements in waterproofing solutions and protective coatings. Regulatory landscapes, particularly concerning building codes and environmental standards, are shaping product development and adoption. Substitute products, such as pre-formed membranes and traditional waterproofing methods, offer competition, but the superior ease of application and seamless performance of liquid applied membranes are increasingly favored. End-user profiles span construction companies, infrastructure developers, and industrial facilities, all seeking durable and reliable waterproofing. Mergers and acquisitions are a notable trend, with M&A deal values projected to reach over $2,000 Million in the forecast period, consolidating market influence and expanding product portfolios.
- Market Share Distribution: Top 10 vendors collectively hold an estimated 70% market share.
- Innovation Catalysts: Demand for sustainable construction, enhanced durability, and energy efficiency.
- Regulatory Landscapes: Evolving building codes, VOC emission standards, and fire safety regulations.
- Substitute Products: Pre-formed membranes, asphalt felts, and traditional waterproofing systems.
- End-User Profiles: Residential, commercial, industrial, infrastructure, and public sector construction projects.
- M&A Activity: Projected deal values exceeding $2,000 Million during the forecast period.
Liquid Applied Membranes Market Industry Evolution
The Liquid Applied Membranes Market has witnessed a consistent upward trajectory, driven by robust global construction activity and an increasing awareness of the long-term benefits of effective waterproofing. The market is projected to grow at a Compound Annual Growth Rate (CAGR) of approximately 6.5% from 2025 to 2033. Technological advancements have been pivotal, with manufacturers continuously refining formulations to improve application speed, durability, and environmental compatibility. The shift towards green building practices and stringent energy efficiency standards further fuels the demand for advanced waterproofing membranes. Consumer demand is evolving, with specifiers and end-users increasingly prioritizing solutions that offer superior performance, reduced maintenance, and extended lifespan. This evolution is characterized by a move away from one-size-fits-all solutions towards application-specific formulations that address unique project requirements. The adoption of liquid applied membranes in challenging environments, such as subterranean structures and exposed roofing systems, underscores their expanding versatility. The market's growth is further bolstered by increasing investments in infrastructure development and the renovation of aging building stock worldwide. The continuous innovation in material science, including the development of self-healing and reflective membrane technologies, is expected to further accelerate market expansion.
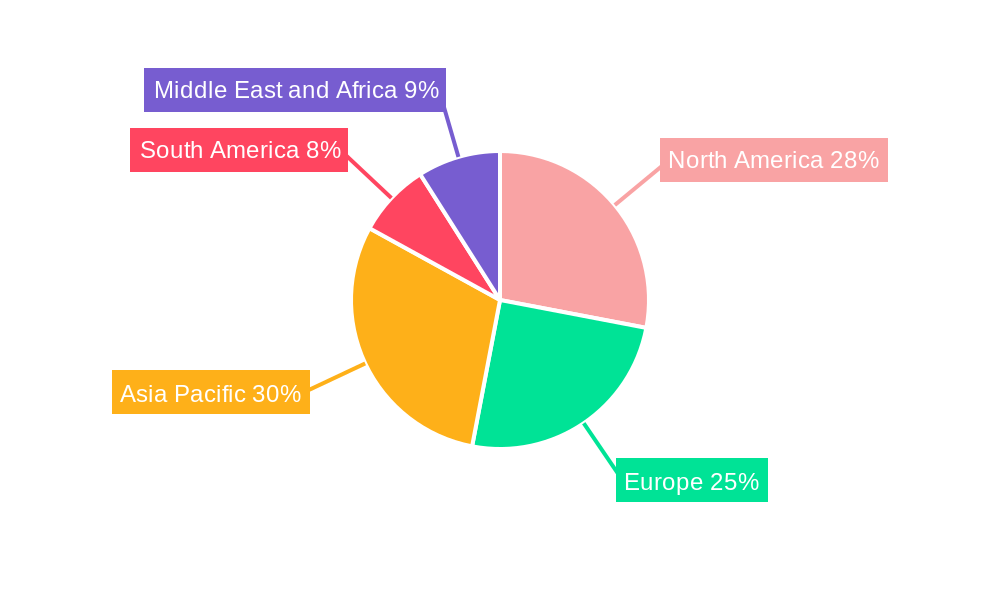
Leading Regions, Countries, or Segments in Liquid Applied Membranes Market
The Roofing application segment is anticipated to dominate the Liquid Applied Membranes Market, driven by the critical need for reliable weatherproofing in both new construction and renovation projects. Within this segment, Polyurethane liquid membranes are expected to command a substantial market share due to their excellent elasticity, UV resistance, and chemical durability. Geographically, North America is projected to lead the market, fueled by high levels of construction spending, stringent building codes mandating superior waterproofing, and a strong emphasis on energy-efficient buildings. The United States, in particular, represents a significant market due to its diverse climate and extensive renovation market.
- Dominant Application: Roofing, accounting for an estimated 40% of the market.
- Leading Type Segment: Polyurethane liquid membranes, favored for their performance characteristics.
- Leading Region: North America, driven by robust construction and stringent regulations.
- Key Drivers in North America:
- Significant investment in commercial and residential construction.
- Strict building codes requiring high-performance waterproofing.
- Increasing demand for cool roofing solutions and energy efficiency.
- Extensive renovation and retrofitting of existing infrastructure.
- Dominance Factors in Roofing Application:
- Protection against water ingress, preventing structural damage and mold growth.
- Extended lifespan and reduced maintenance costs compared to traditional methods.
- Seamless application, eliminating potential leak points.
- Compatibility with various roofing substrates and designs.
- Emerging Trends: Growing adoption in solar panel installations and green roofing systems.
Liquid Applied Membranes Market Product Innovations
Product innovations in the Liquid Applied Membranes Market are increasingly focused on enhanced sustainability, ease of application, and superior performance characteristics. Manufacturers are developing low-VOC and solvent-free formulations to meet environmental regulations and improve worker safety. Advancements in self-healing technologies promise to extend the lifespan of waterproofed surfaces by automatically repairing minor punctures. Furthermore, innovations in thermal reflectivity for roofing membranes are contributing to energy efficiency in buildings. Performance metrics such as tensile strength, elongation, water vapor permeability, and UV resistance are continuously being improved, offering longer-lasting and more resilient waterproofing solutions for diverse applications like walls and underground structures.
Propelling Factors for Liquid Applied Membranes Market Growth
Several key factors are propelling the growth of the Liquid Applied Membranes Market. The escalating global demand for durable and reliable waterproofing solutions in the construction industry is a primary driver. Increasing urbanization and infrastructure development projects worldwide necessitate robust protection against water damage. Furthermore, the growing emphasis on sustainable building practices and energy efficiency is fostering the adoption of advanced liquid applied membranes that contribute to building longevity and reduced environmental impact. Technological advancements in formulations, offering faster curing times and enhanced performance, also play a crucial role. Regulatory mandates for improved building safety and performance further support market expansion.
- Rising global construction output.
- Increasing awareness of the economic benefits of effective waterproofing.
- Government initiatives promoting green building and energy-efficient construction.
- Technological advancements in membrane formulations and application techniques.
Obstacles in the Liquid Applied Membranes Market Market
Despite the promising growth, the Liquid Applied Membranes Market faces certain obstacles. Fluctuations in the prices of raw materials, such as bitumen and polyurethanes, can impact manufacturing costs and profit margins. Stringent and evolving regulatory requirements in some regions, particularly concerning VOC emissions and hazardous substances, can pose challenges for manufacturers in terms of product formulation and compliance. The availability of skilled labor for proper application also remains a concern in certain markets. Furthermore, the initial cost of some high-performance liquid applied membranes can be higher than traditional alternatives, potentially deterring price-sensitive customers. Supply chain disruptions, exacerbated by geopolitical events or logistical challenges, can also affect product availability and delivery timelines.
- Volatility in raw material prices.
- Strict and evolving environmental regulations.
- Shortage of skilled labor for application.
- Higher upfront costs compared to some conventional methods.
- Potential supply chain disruptions.
Future Opportunities in Liquid Applied Membranes Market
The Liquid Applied Membranes Market is ripe with future opportunities. The increasing adoption of modular and prefabricated construction methods presents a fertile ground for specialized liquid applied membranes designed for factory application. The growing demand for renovation and retrofitting of existing infrastructure, particularly in aging urban areas, offers significant market potential. Furthermore, the development of smart membranes with integrated sensors for real-time monitoring of structural integrity represents a futuristic opportunity. Expansion into emerging economies with rapidly developing construction sectors and increasing investments in infrastructure will also drive future growth. The integration of nanotechnology for enhanced durability and self-cleaning properties is another promising avenue.
- Growth in modular and prefabricated construction.
- Significant opportunities in the building renovation and retrofitting market.
- Development of "smart" membranes with integrated monitoring capabilities.
- Expansion into emerging markets with substantial infrastructure investment.
- Integration of nanotechnology for enhanced performance.
Major Players in the Liquid Applied Membranes Market Ecosystem
The Liquid Applied Membranes Market is characterized by the presence of several leading global manufacturers committed to innovation and quality. These companies are instrumental in driving market growth through continuous product development and strategic expansion.
- Carlisle Companies Incorporated
- Dow
- Fosroc Inc
- GAF
- GCP Applied Technologies Inc
- Henry Company
- Johns Manville (A Berkshire Hathaway Company)
- KEMPER SYSTEM Ltd
- MAPEI SpA
- SOPREMA INC
- Saint-Gobain Weber
- Sika AG
Key Developments in Liquid Applied Membranes Market Industry
The Liquid Applied Membranes Market has witnessed significant strategic developments aimed at expanding market reach and product portfolios. These developments reflect the dynamic nature of the industry and its continuous evolution.
- May 2023: Sika AG completed the acquisition of MBCC Group. MBCC Group is a global supplier of construction chemicals. This strategic move is expected to significantly strengthen Sika AG's position in the construction chemicals market, including its offerings in waterproofing solutions. The integration of MBCC Group's product lines and R&D capabilities is anticipated to lead to enhanced product innovation and broader market coverage for Sika AG within the liquid applied membranes sector.
Strategic Liquid Applied Membranes Market Market Forecast
The Liquid Applied Membranes Market is poised for substantial growth driven by a confluence of factors. The ongoing global construction boom, coupled with increasing governmental emphasis on sustainable and resilient infrastructure, will continue to fuel demand for high-performance waterproofing solutions. Innovations in material science, particularly in the development of eco-friendly and energy-efficient membranes, will further enhance market appeal. The strategic acquisitions and mergers observed within the industry are indicative of a maturing market consolidating its strengths and expanding its global footprint. The increasing awareness of the long-term cost benefits associated with durable waterproofing is also a significant market catalyst, pushing specifiers and end-users towards advanced solutions like liquid applied membranes. The forecast suggests a robust expansion, with market size projected to reach over $15,000 Million by 2033.
Liquid Applied Membranes Market Segmentation
-
1. Type
- 1.1. Polyurethane
- 1.2. Cementitious
- 1.3. Bituminous
- 1.4. Other Types
-
2. Application
- 2.1. Roofing
- 2.2. Walls
- 2.3. Underground and Tunnels
- 2.4. Other Applications
Liquid Applied Membranes Market Segmentation By Geography
-
1. Asia Pacific
- 1.1. China
- 1.2. India
- 1.3. Japan
- 1.4. South Korea
- 1.5. ASEAN Countries
- 1.6. Rest of Asia Pacific
-
2. North America
- 2.1. United States
- 2.2. Canada
- 2.3. Mexico
-
3. Europe
- 3.1. Germany
- 3.2. United Kingdom
- 3.3. Italy
- 3.4. France
- 3.5. Russia
- 3.6. Rest of Europe
-
4. South America
- 4.1. Brazil
- 4.2. Argentina
- 4.3. Rest of South America
-
5. Middle East and Africa
- 5.1. Saudi Arabia
- 5.2. South Africa
- 5.3. Rest of Middle East and Africa
Liquid Applied Membranes Market Regional Market Share
Geographic Coverage of Liquid Applied Membranes Market
Liquid Applied Membranes Market REPORT HIGHLIGHTS
| Aspects | Details |
|---|---|
| Study Period | 2020-2034 |
| Base Year | 2025 |
| Estimated Year | 2026 |
| Forecast Period | 2026-2034 |
| Historical Period | 2020-2025 |
| Growth Rate | CAGR of 5.25% from 2020-2034 |
| Segmentation |
|
Table of Contents
- 1. Introduction
- 1.1. Research Scope
- 1.2. Market Segmentation
- 1.3. Research Objective
- 1.4. Definitions and Assumptions
- 2. Executive Summary
- 2.1. Market Snapshot
- 3. Market Dynamics
- 3.1. Market Drivers
- 3.2. Market Restrains
- 3.3. Market Trends
- 3.4. Market Opportunities
- 4. Market Factor Analysis
- 4.1. Porters Five Forces
- 4.1.1. Bargaining Power of Suppliers
- 4.1.2. Bargaining Power of Buyers
- 4.1.3. Threat of New Entrants
- 4.1.4. Threat of Substitutes
- 4.1.5. Competitive Rivalry
- 4.2. PESTEL analysis
- 4.3. BCG Analysis
- 4.3.1. Stars (High Growth, High Market Share)
- 4.3.2. Cash Cows (Low Growth, High Market Share)
- 4.3.3. Question Mark (High Growth, Low Market Share)
- 4.3.4. Dogs (Low Growth, Low Market Share)
- 4.4. Ansoff Matrix Analysis
- 4.5. Supply Chain Analysis
- 4.6. Regulatory Landscape
- 4.7. Current Market Potential and Opportunity Assessment (TAM–SAM–SOM Framework)
- 4.8. DMV Analyst Note
- 4.1. Porters Five Forces
- 5. Market Analysis, Insights and Forecast 2021-2033
- 5.1. Market Analysis, Insights and Forecast - by Type
- 5.1.1. Polyurethane
- 5.1.2. Cementitious
- 5.1.3. Bituminous
- 5.1.4. Other Types
- 5.2. Market Analysis, Insights and Forecast - by Application
- 5.2.1. Roofing
- 5.2.2. Walls
- 5.2.3. Underground and Tunnels
- 5.2.4. Other Applications
- 5.3. Market Analysis, Insights and Forecast - by Region
- 5.3.1. Asia Pacific
- 5.3.2. North America
- 5.3.3. Europe
- 5.3.4. South America
- 5.3.5. Middle East and Africa
- 5.1. Market Analysis, Insights and Forecast - by Type
- 6. Global Liquid Applied Membranes Market Analysis, Insights and Forecast, 2021-2033
- 6.1. Market Analysis, Insights and Forecast - by Type
- 6.1.1. Polyurethane
- 6.1.2. Cementitious
- 6.1.3. Bituminous
- 6.1.4. Other Types
- 6.2. Market Analysis, Insights and Forecast - by Application
- 6.2.1. Roofing
- 6.2.2. Walls
- 6.2.3. Underground and Tunnels
- 6.2.4. Other Applications
- 6.1. Market Analysis, Insights and Forecast - by Type
- 7. Asia Pacific Liquid Applied Membranes Market Analysis, Insights and Forecast, 2020-2032
- 7.1. Market Analysis, Insights and Forecast - by Type
- 7.1.1. Polyurethane
- 7.1.2. Cementitious
- 7.1.3. Bituminous
- 7.1.4. Other Types
- 7.2. Market Analysis, Insights and Forecast - by Application
- 7.2.1. Roofing
- 7.2.2. Walls
- 7.2.3. Underground and Tunnels
- 7.2.4. Other Applications
- 7.1. Market Analysis, Insights and Forecast - by Type
- 8. North America Liquid Applied Membranes Market Analysis, Insights and Forecast, 2020-2032
- 8.1. Market Analysis, Insights and Forecast - by Type
- 8.1.1. Polyurethane
- 8.1.2. Cementitious
- 8.1.3. Bituminous
- 8.1.4. Other Types
- 8.2. Market Analysis, Insights and Forecast - by Application
- 8.2.1. Roofing
- 8.2.2. Walls
- 8.2.3. Underground and Tunnels
- 8.2.4. Other Applications
- 8.1. Market Analysis, Insights and Forecast - by Type
- 9. Europe Liquid Applied Membranes Market Analysis, Insights and Forecast, 2020-2032
- 9.1. Market Analysis, Insights and Forecast - by Type
- 9.1.1. Polyurethane
- 9.1.2. Cementitious
- 9.1.3. Bituminous
- 9.1.4. Other Types
- 9.2. Market Analysis, Insights and Forecast - by Application
- 9.2.1. Roofing
- 9.2.2. Walls
- 9.2.3. Underground and Tunnels
- 9.2.4. Other Applications
- 9.1. Market Analysis, Insights and Forecast - by Type
- 10. South America Liquid Applied Membranes Market Analysis, Insights and Forecast, 2020-2032
- 10.1. Market Analysis, Insights and Forecast - by Type
- 10.1.1. Polyurethane
- 10.1.2. Cementitious
- 10.1.3. Bituminous
- 10.1.4. Other Types
- 10.2. Market Analysis, Insights and Forecast - by Application
- 10.2.1. Roofing
- 10.2.2. Walls
- 10.2.3. Underground and Tunnels
- 10.2.4. Other Applications
- 10.1. Market Analysis, Insights and Forecast - by Type
- 11. Middle East and Africa Liquid Applied Membranes Market Analysis, Insights and Forecast, 2020-2032
- 11.1. Market Analysis, Insights and Forecast - by Type
- 11.1.1. Polyurethane
- 11.1.2. Cementitious
- 11.1.3. Bituminous
- 11.1.4. Other Types
- 11.2. Market Analysis, Insights and Forecast - by Application
- 11.2.1. Roofing
- 11.2.2. Walls
- 11.2.3. Underground and Tunnels
- 11.2.4. Other Applications
- 11.1. Market Analysis, Insights and Forecast - by Type
- 12. Competitive Analysis
- 12.1. Company Profiles
- 12.1.1 Carlisle Companies Incorporated
- 12.1.1.1. Company Overview
- 12.1.1.2. Products
- 12.1.1.3. Company Financials
- 12.1.1.4. SWOT Analysis
- 12.1.2 Dow
- 12.1.2.1. Company Overview
- 12.1.2.2. Products
- 12.1.2.3. Company Financials
- 12.1.2.4. SWOT Analysis
- 12.1.3 Fosroc Inc
- 12.1.3.1. Company Overview
- 12.1.3.2. Products
- 12.1.3.3. Company Financials
- 12.1.3.4. SWOT Analysis
- 12.1.4 GAF
- 12.1.4.1. Company Overview
- 12.1.4.2. Products
- 12.1.4.3. Company Financials
- 12.1.4.4. SWOT Analysis
- 12.1.5 GCP Applied Technologies Inc
- 12.1.5.1. Company Overview
- 12.1.5.2. Products
- 12.1.5.3. Company Financials
- 12.1.5.4. SWOT Analysis
- 12.1.6 Henry Company
- 12.1.6.1. Company Overview
- 12.1.6.2. Products
- 12.1.6.3. Company Financials
- 12.1.6.4. SWOT Analysis
- 12.1.7 Johns Manville (A Berkshire Hathaway Company)
- 12.1.7.1. Company Overview
- 12.1.7.2. Products
- 12.1.7.3. Company Financials
- 12.1.7.4. SWOT Analysis
- 12.1.8 KEMPER SYSTEM Ltd
- 12.1.8.1. Company Overview
- 12.1.8.2. Products
- 12.1.8.3. Company Financials
- 12.1.8.4. SWOT Analysis
- 12.1.9 MAPEI SpA
- 12.1.9.1. Company Overview
- 12.1.9.2. Products
- 12.1.9.3. Company Financials
- 12.1.9.4. SWOT Analysis
- 12.1.10 SOPREMA INC
- 12.1.10.1. Company Overview
- 12.1.10.2. Products
- 12.1.10.3. Company Financials
- 12.1.10.4. SWOT Analysis
- 12.1.11 Saint-Gobain Weber
- 12.1.11.1. Company Overview
- 12.1.11.2. Products
- 12.1.11.3. Company Financials
- 12.1.11.4. SWOT Analysis
- 12.1.12 Sika AG*List Not Exhaustive
- 12.1.12.1. Company Overview
- 12.1.12.2. Products
- 12.1.12.3. Company Financials
- 12.1.12.4. SWOT Analysis
- 12.1.1 Carlisle Companies Incorporated
- 12.2. Market Entropy
- 12.2.1 Company's Key Areas Served
- 12.2.2 Recent Developments
- 12.3. Company Market Share Analysis 2025
- 12.3.1 Top 5 Companies Market Share Analysis
- 12.3.2 Top 3 Companies Market Share Analysis
- 12.4. List of Potential Customers
- 13. Research Methodology
List of Figures
- Figure 1: Global Liquid Applied Membranes Market Revenue Breakdown (Million, %) by Region 2025 & 2033
- Figure 2: Global Liquid Applied Membranes Market Volume Breakdown (Billion, %) by Region 2025 & 2033
- Figure 3: Asia Pacific Liquid Applied Membranes Market Revenue (Million), by Type 2025 & 2033
- Figure 4: Asia Pacific Liquid Applied Membranes Market Volume (Billion), by Type 2025 & 2033
- Figure 5: Asia Pacific Liquid Applied Membranes Market Revenue Share (%), by Type 2025 & 2033
- Figure 6: Asia Pacific Liquid Applied Membranes Market Volume Share (%), by Type 2025 & 2033
- Figure 7: Asia Pacific Liquid Applied Membranes Market Revenue (Million), by Application 2025 & 2033
- Figure 8: Asia Pacific Liquid Applied Membranes Market Volume (Billion), by Application 2025 & 2033
- Figure 9: Asia Pacific Liquid Applied Membranes Market Revenue Share (%), by Application 2025 & 2033
- Figure 10: Asia Pacific Liquid Applied Membranes Market Volume Share (%), by Application 2025 & 2033
- Figure 11: Asia Pacific Liquid Applied Membranes Market Revenue (Million), by Country 2025 & 2033
- Figure 12: Asia Pacific Liquid Applied Membranes Market Volume (Billion), by Country 2025 & 2033
- Figure 13: Asia Pacific Liquid Applied Membranes Market Revenue Share (%), by Country 2025 & 2033
- Figure 14: Asia Pacific Liquid Applied Membranes Market Volume Share (%), by Country 2025 & 2033
- Figure 15: North America Liquid Applied Membranes Market Revenue (Million), by Type 2025 & 2033
- Figure 16: North America Liquid Applied Membranes Market Volume (Billion), by Type 2025 & 2033
- Figure 17: North America Liquid Applied Membranes Market Revenue Share (%), by Type 2025 & 2033
- Figure 18: North America Liquid Applied Membranes Market Volume Share (%), by Type 2025 & 2033
- Figure 19: North America Liquid Applied Membranes Market Revenue (Million), by Application 2025 & 2033
- Figure 20: North America Liquid Applied Membranes Market Volume (Billion), by Application 2025 & 2033
- Figure 21: North America Liquid Applied Membranes Market Revenue Share (%), by Application 2025 & 2033
- Figure 22: North America Liquid Applied Membranes Market Volume Share (%), by Application 2025 & 2033
- Figure 23: North America Liquid Applied Membranes Market Revenue (Million), by Country 2025 & 2033
- Figure 24: North America Liquid Applied Membranes Market Volume (Billion), by Country 2025 & 2033
- Figure 25: North America Liquid Applied Membranes Market Revenue Share (%), by Country 2025 & 2033
- Figure 26: North America Liquid Applied Membranes Market Volume Share (%), by Country 2025 & 2033
- Figure 27: Europe Liquid Applied Membranes Market Revenue (Million), by Type 2025 & 2033
- Figure 28: Europe Liquid Applied Membranes Market Volume (Billion), by Type 2025 & 2033
- Figure 29: Europe Liquid Applied Membranes Market Revenue Share (%), by Type 2025 & 2033
- Figure 30: Europe Liquid Applied Membranes Market Volume Share (%), by Type 2025 & 2033
- Figure 31: Europe Liquid Applied Membranes Market Revenue (Million), by Application 2025 & 2033
- Figure 32: Europe Liquid Applied Membranes Market Volume (Billion), by Application 2025 & 2033
- Figure 33: Europe Liquid Applied Membranes Market Revenue Share (%), by Application 2025 & 2033
- Figure 34: Europe Liquid Applied Membranes Market Volume Share (%), by Application 2025 & 2033
- Figure 35: Europe Liquid Applied Membranes Market Revenue (Million), by Country 2025 & 2033
- Figure 36: Europe Liquid Applied Membranes Market Volume (Billion), by Country 2025 & 2033
- Figure 37: Europe Liquid Applied Membranes Market Revenue Share (%), by Country 2025 & 2033
- Figure 38: Europe Liquid Applied Membranes Market Volume Share (%), by Country 2025 & 2033
- Figure 39: South America Liquid Applied Membranes Market Revenue (Million), by Type 2025 & 2033
- Figure 40: South America Liquid Applied Membranes Market Volume (Billion), by Type 2025 & 2033
- Figure 41: South America Liquid Applied Membranes Market Revenue Share (%), by Type 2025 & 2033
- Figure 42: South America Liquid Applied Membranes Market Volume Share (%), by Type 2025 & 2033
- Figure 43: South America Liquid Applied Membranes Market Revenue (Million), by Application 2025 & 2033
- Figure 44: South America Liquid Applied Membranes Market Volume (Billion), by Application 2025 & 2033
- Figure 45: South America Liquid Applied Membranes Market Revenue Share (%), by Application 2025 & 2033
- Figure 46: South America Liquid Applied Membranes Market Volume Share (%), by Application 2025 & 2033
- Figure 47: South America Liquid Applied Membranes Market Revenue (Million), by Country 2025 & 2033
- Figure 48: South America Liquid Applied Membranes Market Volume (Billion), by Country 2025 & 2033
- Figure 49: South America Liquid Applied Membranes Market Revenue Share (%), by Country 2025 & 2033
- Figure 50: South America Liquid Applied Membranes Market Volume Share (%), by Country 2025 & 2033
- Figure 51: Middle East and Africa Liquid Applied Membranes Market Revenue (Million), by Type 2025 & 2033
- Figure 52: Middle East and Africa Liquid Applied Membranes Market Volume (Billion), by Type 2025 & 2033
- Figure 53: Middle East and Africa Liquid Applied Membranes Market Revenue Share (%), by Type 2025 & 2033
- Figure 54: Middle East and Africa Liquid Applied Membranes Market Volume Share (%), by Type 2025 & 2033
- Figure 55: Middle East and Africa Liquid Applied Membranes Market Revenue (Million), by Application 2025 & 2033
- Figure 56: Middle East and Africa Liquid Applied Membranes Market Volume (Billion), by Application 2025 & 2033
- Figure 57: Middle East and Africa Liquid Applied Membranes Market Revenue Share (%), by Application 2025 & 2033
- Figure 58: Middle East and Africa Liquid Applied Membranes Market Volume Share (%), by Application 2025 & 2033
- Figure 59: Middle East and Africa Liquid Applied Membranes Market Revenue (Million), by Country 2025 & 2033
- Figure 60: Middle East and Africa Liquid Applied Membranes Market Volume (Billion), by Country 2025 & 2033
- Figure 61: Middle East and Africa Liquid Applied Membranes Market Revenue Share (%), by Country 2025 & 2033
- Figure 62: Middle East and Africa Liquid Applied Membranes Market Volume Share (%), by Country 2025 & 2033
List of Tables
- Table 1: Global Liquid Applied Membranes Market Revenue Million Forecast, by Type 2020 & 2033
- Table 2: Global Liquid Applied Membranes Market Volume Billion Forecast, by Type 2020 & 2033
- Table 3: Global Liquid Applied Membranes Market Revenue Million Forecast, by Application 2020 & 2033
- Table 4: Global Liquid Applied Membranes Market Volume Billion Forecast, by Application 2020 & 2033
- Table 5: Global Liquid Applied Membranes Market Revenue Million Forecast, by Region 2020 & 2033
- Table 6: Global Liquid Applied Membranes Market Volume Billion Forecast, by Region 2020 & 2033
- Table 7: Global Liquid Applied Membranes Market Revenue Million Forecast, by Type 2020 & 2033
- Table 8: Global Liquid Applied Membranes Market Volume Billion Forecast, by Type 2020 & 2033
- Table 9: Global Liquid Applied Membranes Market Revenue Million Forecast, by Application 2020 & 2033
- Table 10: Global Liquid Applied Membranes Market Volume Billion Forecast, by Application 2020 & 2033
- Table 11: Global Liquid Applied Membranes Market Revenue Million Forecast, by Country 2020 & 2033
- Table 12: Global Liquid Applied Membranes Market Volume Billion Forecast, by Country 2020 & 2033
- Table 13: China Liquid Applied Membranes Market Revenue (Million) Forecast, by Application 2020 & 2033
- Table 14: China Liquid Applied Membranes Market Volume (Billion) Forecast, by Application 2020 & 2033
- Table 15: India Liquid Applied Membranes Market Revenue (Million) Forecast, by Application 2020 & 2033
- Table 16: India Liquid Applied Membranes Market Volume (Billion) Forecast, by Application 2020 & 2033
- Table 17: Japan Liquid Applied Membranes Market Revenue (Million) Forecast, by Application 2020 & 2033
- Table 18: Japan Liquid Applied Membranes Market Volume (Billion) Forecast, by Application 2020 & 2033
- Table 19: South Korea Liquid Applied Membranes Market Revenue (Million) Forecast, by Application 2020 & 2033
- Table 20: South Korea Liquid Applied Membranes Market Volume (Billion) Forecast, by Application 2020 & 2033
- Table 21: ASEAN Countries Liquid Applied Membranes Market Revenue (Million) Forecast, by Application 2020 & 2033
- Table 22: ASEAN Countries Liquid Applied Membranes Market Volume (Billion) Forecast, by Application 2020 & 2033
- Table 23: Rest of Asia Pacific Liquid Applied Membranes Market Revenue (Million) Forecast, by Application 2020 & 2033
- Table 24: Rest of Asia Pacific Liquid Applied Membranes Market Volume (Billion) Forecast, by Application 2020 & 2033
- Table 25: Global Liquid Applied Membranes Market Revenue Million Forecast, by Type 2020 & 2033
- Table 26: Global Liquid Applied Membranes Market Volume Billion Forecast, by Type 2020 & 2033
- Table 27: Global Liquid Applied Membranes Market Revenue Million Forecast, by Application 2020 & 2033
- Table 28: Global Liquid Applied Membranes Market Volume Billion Forecast, by Application 2020 & 2033
- Table 29: Global Liquid Applied Membranes Market Revenue Million Forecast, by Country 2020 & 2033
- Table 30: Global Liquid Applied Membranes Market Volume Billion Forecast, by Country 2020 & 2033
- Table 31: United States Liquid Applied Membranes Market Revenue (Million) Forecast, by Application 2020 & 2033
- Table 32: United States Liquid Applied Membranes Market Volume (Billion) Forecast, by Application 2020 & 2033
- Table 33: Canada Liquid Applied Membranes Market Revenue (Million) Forecast, by Application 2020 & 2033
- Table 34: Canada Liquid Applied Membranes Market Volume (Billion) Forecast, by Application 2020 & 2033
- Table 35: Mexico Liquid Applied Membranes Market Revenue (Million) Forecast, by Application 2020 & 2033
- Table 36: Mexico Liquid Applied Membranes Market Volume (Billion) Forecast, by Application 2020 & 2033
- Table 37: Global Liquid Applied Membranes Market Revenue Million Forecast, by Type 2020 & 2033
- Table 38: Global Liquid Applied Membranes Market Volume Billion Forecast, by Type 2020 & 2033
- Table 39: Global Liquid Applied Membranes Market Revenue Million Forecast, by Application 2020 & 2033
- Table 40: Global Liquid Applied Membranes Market Volume Billion Forecast, by Application 2020 & 2033
- Table 41: Global Liquid Applied Membranes Market Revenue Million Forecast, by Country 2020 & 2033
- Table 42: Global Liquid Applied Membranes Market Volume Billion Forecast, by Country 2020 & 2033
- Table 43: Germany Liquid Applied Membranes Market Revenue (Million) Forecast, by Application 2020 & 2033
- Table 44: Germany Liquid Applied Membranes Market Volume (Billion) Forecast, by Application 2020 & 2033
- Table 45: United Kingdom Liquid Applied Membranes Market Revenue (Million) Forecast, by Application 2020 & 2033
- Table 46: United Kingdom Liquid Applied Membranes Market Volume (Billion) Forecast, by Application 2020 & 2033
- Table 47: Italy Liquid Applied Membranes Market Revenue (Million) Forecast, by Application 2020 & 2033
- Table 48: Italy Liquid Applied Membranes Market Volume (Billion) Forecast, by Application 2020 & 2033
- Table 49: France Liquid Applied Membranes Market Revenue (Million) Forecast, by Application 2020 & 2033
- Table 50: France Liquid Applied Membranes Market Volume (Billion) Forecast, by Application 2020 & 2033
- Table 51: Russia Liquid Applied Membranes Market Revenue (Million) Forecast, by Application 2020 & 2033
- Table 52: Russia Liquid Applied Membranes Market Volume (Billion) Forecast, by Application 2020 & 2033
- Table 53: Rest of Europe Liquid Applied Membranes Market Revenue (Million) Forecast, by Application 2020 & 2033
- Table 54: Rest of Europe Liquid Applied Membranes Market Volume (Billion) Forecast, by Application 2020 & 2033
- Table 55: Global Liquid Applied Membranes Market Revenue Million Forecast, by Type 2020 & 2033
- Table 56: Global Liquid Applied Membranes Market Volume Billion Forecast, by Type 2020 & 2033
- Table 57: Global Liquid Applied Membranes Market Revenue Million Forecast, by Application 2020 & 2033
- Table 58: Global Liquid Applied Membranes Market Volume Billion Forecast, by Application 2020 & 2033
- Table 59: Global Liquid Applied Membranes Market Revenue Million Forecast, by Country 2020 & 2033
- Table 60: Global Liquid Applied Membranes Market Volume Billion Forecast, by Country 2020 & 2033
- Table 61: Brazil Liquid Applied Membranes Market Revenue (Million) Forecast, by Application 2020 & 2033
- Table 62: Brazil Liquid Applied Membranes Market Volume (Billion) Forecast, by Application 2020 & 2033
- Table 63: Argentina Liquid Applied Membranes Market Revenue (Million) Forecast, by Application 2020 & 2033
- Table 64: Argentina Liquid Applied Membranes Market Volume (Billion) Forecast, by Application 2020 & 2033
- Table 65: Rest of South America Liquid Applied Membranes Market Revenue (Million) Forecast, by Application 2020 & 2033
- Table 66: Rest of South America Liquid Applied Membranes Market Volume (Billion) Forecast, by Application 2020 & 2033
- Table 67: Global Liquid Applied Membranes Market Revenue Million Forecast, by Type 2020 & 2033
- Table 68: Global Liquid Applied Membranes Market Volume Billion Forecast, by Type 2020 & 2033
- Table 69: Global Liquid Applied Membranes Market Revenue Million Forecast, by Application 2020 & 2033
- Table 70: Global Liquid Applied Membranes Market Volume Billion Forecast, by Application 2020 & 2033
- Table 71: Global Liquid Applied Membranes Market Revenue Million Forecast, by Country 2020 & 2033
- Table 72: Global Liquid Applied Membranes Market Volume Billion Forecast, by Country 2020 & 2033
- Table 73: Saudi Arabia Liquid Applied Membranes Market Revenue (Million) Forecast, by Application 2020 & 2033
- Table 74: Saudi Arabia Liquid Applied Membranes Market Volume (Billion) Forecast, by Application 2020 & 2033
- Table 75: South Africa Liquid Applied Membranes Market Revenue (Million) Forecast, by Application 2020 & 2033
- Table 76: South Africa Liquid Applied Membranes Market Volume (Billion) Forecast, by Application 2020 & 2033
- Table 77: Rest of Middle East and Africa Liquid Applied Membranes Market Revenue (Million) Forecast, by Application 2020 & 2033
- Table 78: Rest of Middle East and Africa Liquid Applied Membranes Market Volume (Billion) Forecast, by Application 2020 & 2033
Frequently Asked Questions
1. What is the projected Compound Annual Growth Rate (CAGR) of the Liquid Applied Membranes Market?
The projected CAGR is approximately 5.25%.
2. Which companies are prominent players in the Liquid Applied Membranes Market?
Key companies in the market include Carlisle Companies Incorporated, Dow, Fosroc Inc, GAF, GCP Applied Technologies Inc, Henry Company, Johns Manville (A Berkshire Hathaway Company), KEMPER SYSTEM Ltd, MAPEI SpA, SOPREMA INC, Saint-Gobain Weber, Sika AG*List Not Exhaustive.
3. What are the main segments of the Liquid Applied Membranes Market?
The market segments include Type, Application.
4. Can you provide details about the market size?
The market size is estimated to be USD 6.99 Million as of 2022.
5. What are some drivers contributing to market growth?
Growing Usage of Waterproofing Membranes to Maintain Longevity of Buildings; Increasing Benefits of Liquid Applied Membranes Resulting in Cost-effective Construction; Growing Infrastructural and Commercial Projects in Emerging Economies.
6. What are the notable trends driving market growth?
Roofing Application is Expected to Dominate the Market.
7. Are there any restraints impacting market growth?
Growing Usage of Waterproofing Membranes to Maintain Longevity of Buildings; Increasing Benefits of Liquid Applied Membranes Resulting in Cost-effective Construction; Growing Infrastructural and Commercial Projects in Emerging Economies.
8. Can you provide examples of recent developments in the market?
May 2023: Sika AG completed the acquisition of MBCC Group. MBCC Group is a global supplier of construction chemicals.
9. What pricing options are available for accessing the report?
Pricing options include single-user, multi-user, and enterprise licenses priced at USD 4750, USD 5250, and USD 8750 respectively.
10. Is the market size provided in terms of value or volume?
The market size is provided in terms of value, measured in Million and volume, measured in Billion.
11. Are there any specific market keywords associated with the report?
Yes, the market keyword associated with the report is "Liquid Applied Membranes Market," which aids in identifying and referencing the specific market segment covered.
12. How do I determine which pricing option suits my needs best?
The pricing options vary based on user requirements and access needs. Individual users may opt for single-user licenses, while businesses requiring broader access may choose multi-user or enterprise licenses for cost-effective access to the report.
13. Are there any additional resources or data provided in the Liquid Applied Membranes Market report?
While the report offers comprehensive insights, it's advisable to review the specific contents or supplementary materials provided to ascertain if additional resources or data are available.
14. How can I stay updated on further developments or reports in the Liquid Applied Membranes Market?
To stay informed about further developments, trends, and reports in the Liquid Applied Membranes Market, consider subscribing to industry newsletters, following relevant companies and organizations, or regularly checking reputable industry news sources and publications.
Methodology
Step 1 - Identification of Relevant Samples Size from Population Database


Step 2 - Approaches for Defining Global Market Size (Value, Volume* & Price*)

Note*: In applicable scenarios
Step 3 - Data Sources
Primary Research
- Web Analytics
- Survey Reports
- Research Institute
- Latest Research Reports
- Opinion Leaders
Secondary Research
- Annual Reports
- White Paper
- Latest Press Release
- Industry Association
- Paid Database
- Investor Presentations

Step 4 - Data Triangulation
Involves using different sources of information in order to increase the validity of a study
These sources are likely to be stakeholders in a program - participants, other researchers, program staff, other community members, and so on.
Then we put all data in single framework & apply various statistical tools to find out the dynamic on the market.
During the analysis stage, feedback from the stakeholder groups would be compared to determine areas of agreement as well as areas of divergence