

Key Insights
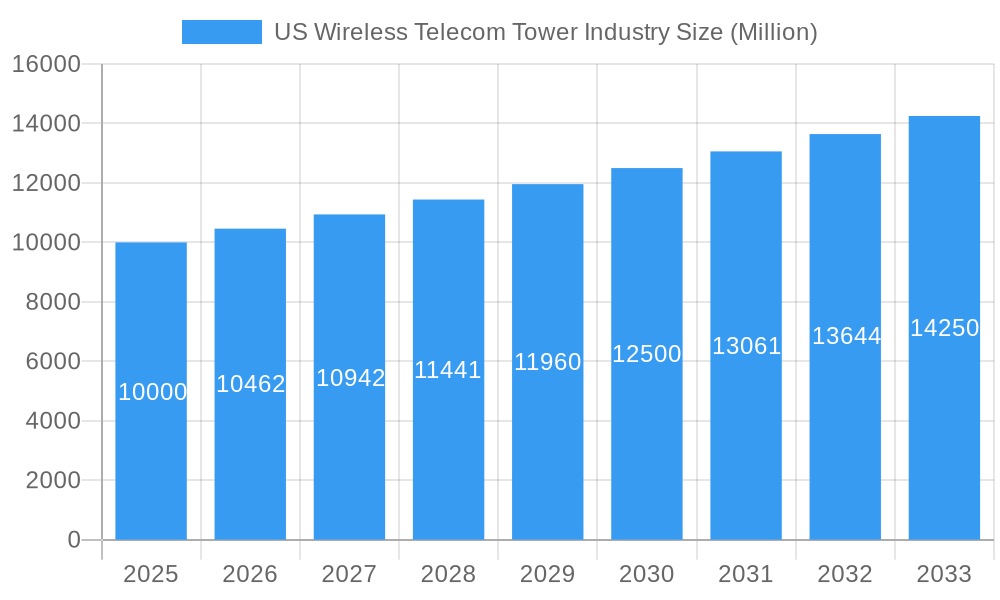
The US Wireless Telecom Tower market is projected for substantial expansion, driven by escalating demand for high-speed data and the widespread deployment of 5G networks. The market is valued at $14.1 billion in the base year 2025 and is anticipated to grow at a Compound Annual Growth Rate (CAGR) of 4.7% from 2025 to 2033. Key growth drivers include the increasing penetration of mobile devices, the surge in data-intensive applications such as video streaming and online gaming, and the critical need for enhanced wireless infrastructure. The ongoing 5G network rollout necessitates a denser tower footprint to accommodate higher frequencies and increased capacity. Market segmentation includes fuel type (renewable, non-renewable), installation (rooftop, ground-based), and ownership (operator-owned, joint venture, private-owned, MNO Captive). Major industry participants include SBA Communications Corporation, Crown Castle International Corp, and American Tower Corporation. Despite challenges like regulatory complexities and site acquisition, the long-term outlook is positive, fueled by continuous technological innovation and rising mobile data consumption.
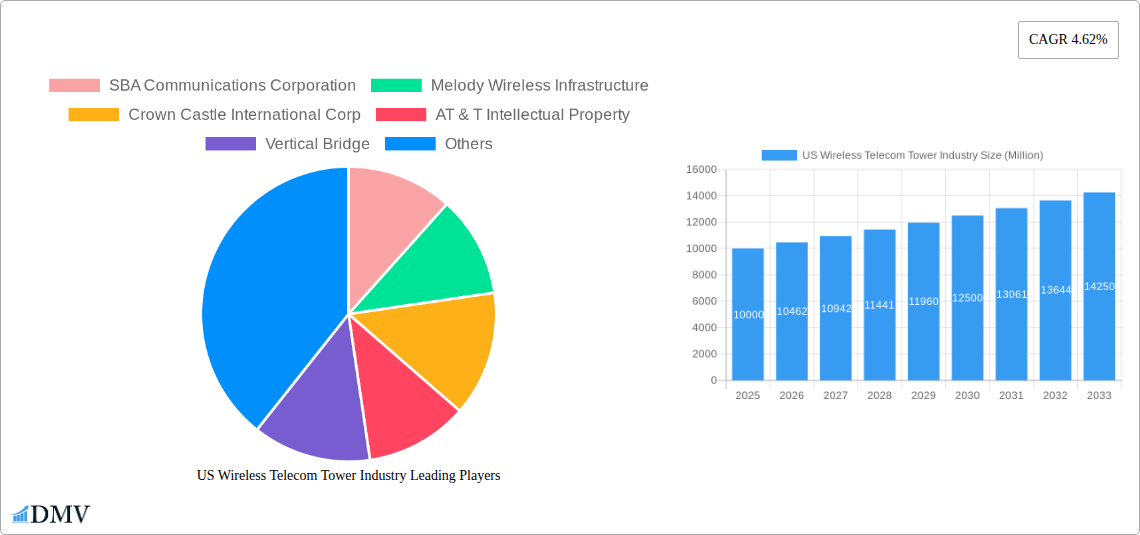
US Wireless Telecom Tower Industry Market Size (In Billion)
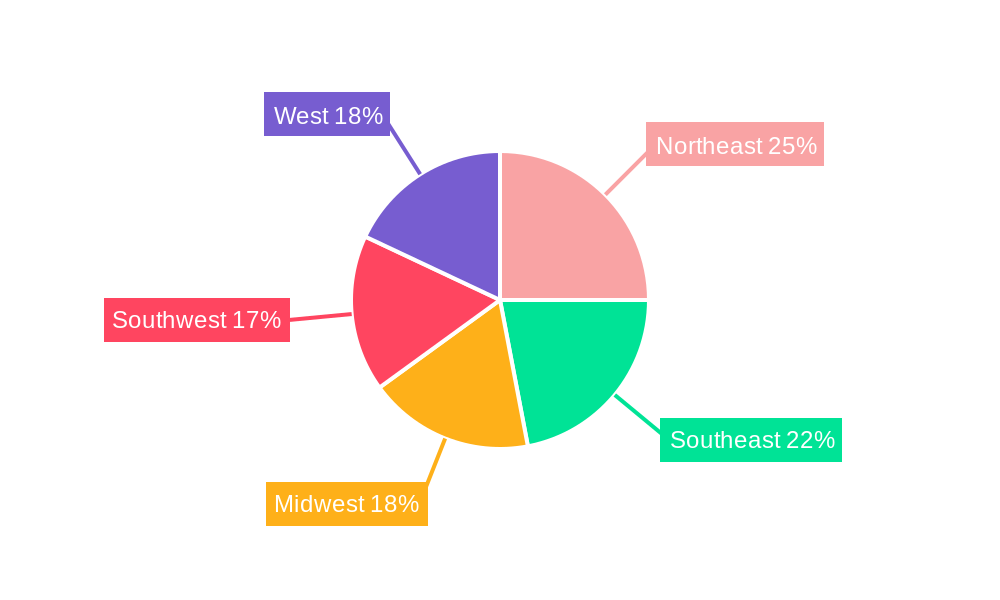
Geographic distribution of towers will align with population density and network coverage objectives, with higher concentrations expected in regions like the Northeast and West Coast. However, growth is also anticipated in less populated areas to support comprehensive nationwide 5G coverage. The adoption of renewable energy for tower power is a notable trend, driven by sustainability goals and cost-efficiency. The rise of private tower ownership and joint ventures indicates a dynamic market focused on investment and operational optimization. Evolving infrastructure, including the integration of small cells and distributed antenna systems, will further shape the industry. Continuous innovation and strategic alliances will be crucial for maintaining competitiveness and capitalizing on market opportunities.
US Wireless Telecom Tower Industry Company Market Share
US Wireless Telecom Tower Industry Market Report: 2019-2033
This comprehensive report provides an in-depth analysis of the US Wireless Telecom Tower Industry, offering valuable insights for stakeholders seeking to navigate this dynamic market. Covering the period from 2019 to 2033, with a focus on 2025, this report analyzes market trends, leading players, technological advancements, and future growth prospects. The US wireless telecom tower market is projected to reach xx Million by 2033, presenting significant opportunities for investment and growth.
US Wireless Telecom Tower Industry Market Composition & Trends
The US Wireless Telecom Tower Industry is characterized by a moderately concentrated market, with key players like Crown Castle International Corp, SBA Communications Corporation, and American Tower Corporation holding significant market share. However, the landscape is evolving rapidly due to mergers and acquisitions (M&A) activity, technological innovations driving 5G deployment, and a changing regulatory environment. Innovation is primarily driven by the need for increased network capacity, improved coverage, and the deployment of next-generation technologies like 5G and private networks. Substitute products, while limited, include distributed antenna systems (DAS) and small cells. End-users are primarily mobile network operators (MNOs), but the rise of private networks is opening new opportunities for various industries.
- Market Share Distribution (2024 Estimate): Crown Castle International Corp (35%), SBA Communications Corporation (25%), American Tower Corporation (20%), Others (20%). These figures are estimates based on available public information and may vary slightly.
- M&A Activity (2019-2024): Total deal value estimated at xx Million, with significant transactions involving major players consolidating market share and expanding their footprints.
- Regulatory Landscape: The FCC's policies significantly impact tower construction, siting, and licensing. This continues to be a crucial factor affecting market dynamics.
US Wireless Telecom Tower Industry Evolution
The US wireless telecom tower industry has experienced significant growth driven by the increasing demand for mobile data and the rollout of 5G networks. Technological advancements, such as the deployment of 5G and the integration of fiber optics for enhanced backhaul capacity, have been instrumental in shaping market expansion. This trend is further accelerated by the rising adoption of smartphones and the growing demand for high-bandwidth applications, such as video streaming and online gaming. The market has witnessed a steady increase in tower construction activity alongside the integration of small cells to enhance network coverage and capacity. This is reflected in a Compound Annual Growth Rate (CAGR) of xx% between 2019 and 2024. The forecast period (2025-2033) projects a CAGR of xx% fueled by continued 5G rollout and rising data consumption. Shifting consumer demands for seamless connectivity are pushing MNOs to invest heavily in infrastructure modernization and expansion, sustaining growth in the telecom tower sector.
Leading Regions, Countries, or Segments in US Wireless Telecom Tower Industry
The US wireless telecom tower market exhibits diverse characteristics across various segments.
By Fuel Type:
- Non-Renewable: Currently dominates due to existing infrastructure reliance. However, there is a growing shift towards renewable energy sources.
- Renewable: The segment is experiencing significant growth due to sustainability initiatives and government incentives. The rising adoption of solar and wind power for powering telecom towers is expected to drive growth in this segment.
By Installation:
- Ground-based: Remains the dominant segment due to higher capacity and coverage, although the rooftop segment is seeing significant growth in densely populated urban areas.
- Rooftop: Growth is fueled by space constraints in urban environments and cost-effectiveness in certain situations.
By Ownership:
- Operator-owned: Major MNOs hold significant ownership, but this is evolving with increased participation from independent tower companies.
- Private-owned: This segment exhibits substantial growth, with significant investment from private equity firms and independent tower companies.
- Joint Venture: Joint ventures provide an avenue for shared infrastructure investment and risk mitigation.
- MNO Captive: MNOs continue to invest significantly in captive towers to maintain control over network infrastructure, although this model is becoming less prevalent due to the advantages of co-location and partnerships.
Key drivers for the dominant segments include significant investments by MNOs and independent tower companies, supportive regulatory frameworks encouraging infrastructure development, and increasing demand for network capacity.
US Wireless Telecom Tower Industry Product Innovations
Recent innovations include the development of more efficient and environmentally friendly towers, the integration of smart technologies for remote monitoring and maintenance, and the deployment of advanced antenna systems to enhance network performance and capacity. These innovations focus on improving efficiency, reducing operational costs, and increasing network density to meet the growing demand for data and connectivity. Key innovations include the use of advanced materials, optimized designs, and AI-driven network management tools.
Propelling Factors for US Wireless Telecom Tower Industry Growth
The US wireless telecom tower industry's growth is propelled by several factors: the widespread adoption of 5G technology, increasing mobile data consumption, government initiatives promoting infrastructure development, and the rising demand for enhanced connectivity across various sectors. Further impetus comes from the expansion of IoT applications and the increasing need for robust network infrastructure. The ongoing investments by major MNOs in network upgrades and expansions further contribute to the market's growth trajectory.
Obstacles in the US Wireless Telecom Tower Industry Market
Challenges include securing necessary permits and approvals for new tower constructions, dealing with community opposition to tower installations, and managing the complexities of securing land rights. Supply chain disruptions and the rising cost of materials also present significant obstacles. Competition among major tower companies and the entry of new players further intensifies market pressures. These factors can impact the construction timelines and operational costs of the tower projects.
Future Opportunities in US Wireless Telecom Tower Industry
Future opportunities lie in the expansion of 5G networks, the increasing demand for private LTE/5G networks in various industries (e.g., manufacturing, healthcare), and the potential for incorporating renewable energy sources to power towers. The continued development of innovative antenna technologies and the integration of edge computing capabilities further promise growth opportunities in the future. Expanding into underserved rural areas also presents a significant opportunity for growth.
Major Players in the US Wireless Telecom Tower Industry Ecosystem
- SBA Communications Corporation
- Melody Wireless Infrastructure
- Crown Castle International Corp
- AT&T Intellectual Property
- Vertical Bridge
- Helios Towers plc
- Tillman Infrastructure LLC
- United States Cellular Co
- ATC IP LLC
- Insite Wireless Group
- BNSF Railroad
Key Developments in US Wireless Telecom Tower Industry Industry
- January 2022: T-Mobile US, Inc. and Crown Castle International Corp. announce a 12-year collaboration to expand T-Mobile's 5G network access.
- January 2022: American Tower Corporation acquires CoreSite Realty Corporation, integrating data center capabilities to enhance its tower real estate value.
Strategic US Wireless Telecom Tower Industry Market Forecast
The US wireless telecom tower market is poised for continued growth, driven by sustained investments in 5G network expansion, the increasing demand for mobile data, and the emergence of new applications requiring robust network infrastructure. The market's potential is significant, offering attractive investment opportunities and promising substantial returns for stakeholders. The ongoing technological advancements and expanding applications will propel the growth and create a robust ecosystem for future expansion.
US Wireless Telecom Tower Industry Segmentation
-
1. Fuel Type
- 1.1. Renewable
- 1.2. Non-renewable
-
2. Installation
- 2.1. Rooftop
- 2.2. Ground-based
-
3. Ownership
- 3.1. Operator-owned
- 3.2. Joint Venture
- 3.3. Private-owned
- 3.4. MNO Captive
US Wireless Telecom Tower Industry Segmentation By Geography
-
1. North America
- 1.1. United States
- 1.2. Canada
- 1.3. Mexico
-
2. South America
- 2.1. Brazil
- 2.2. Argentina
- 2.3. Rest of South America
-
3. Europe
- 3.1. United Kingdom
- 3.2. Germany
- 3.3. France
- 3.4. Italy
- 3.5. Spain
- 3.6. Russia
- 3.7. Benelux
- 3.8. Nordics
- 3.9. Rest of Europe
-
4. Middle East & Africa
- 4.1. Turkey
- 4.2. Israel
- 4.3. GCC
- 4.4. North Africa
- 4.5. South Africa
- 4.6. Rest of Middle East & Africa
-
5. Asia Pacific
- 5.1. China
- 5.2. India
- 5.3. Japan
- 5.4. South Korea
- 5.5. ASEAN
- 5.6. Oceania
- 5.7. Rest of Asia Pacific
US Wireless Telecom Tower Industry Regional Market Share
Geographic Coverage of US Wireless Telecom Tower Industry
US Wireless Telecom Tower Industry REPORT HIGHLIGHTS
| Aspects | Details |
|---|---|
| Study Period | 2020-2034 |
| Base Year | 2025 |
| Estimated Year | 2026 |
| Forecast Period | 2026-2034 |
| Historical Period | 2020-2025 |
| Growth Rate | CAGR of 4.7% from 2020-2034 |
| Segmentation |
|
Table of Contents
- 1. Introduction
- 1.1. Research Scope
- 1.2. Market Segmentation
- 1.3. Research Objective
- 1.4. Definitions and Assumptions
- 2. Executive Summary
- 2.1. Market Snapshot
- 3. Market Dynamics
- 3.1. Market Drivers
- 3.2. Market Restrains
- 3.3. Market Trends
- 3.4. Market Opportunities
- 4. Market Factor Analysis
- 4.1. Porters Five Forces
- 4.1.1. Bargaining Power of Suppliers
- 4.1.2. Bargaining Power of Buyers
- 4.1.3. Threat of New Entrants
- 4.1.4. Threat of Substitutes
- 4.1.5. Competitive Rivalry
- 4.2. PESTEL analysis
- 4.3. BCG Analysis
- 4.3.1. Stars (High Growth, High Market Share)
- 4.3.2. Cash Cows (Low Growth, High Market Share)
- 4.3.3. Question Mark (High Growth, Low Market Share)
- 4.3.4. Dogs (Low Growth, Low Market Share)
- 4.4. Ansoff Matrix Analysis
- 4.5. Supply Chain Analysis
- 4.6. Regulatory Landscape
- 4.7. Current Market Potential and Opportunity Assessment (TAM–SAM–SOM Framework)
- 4.8. DMV Analyst Note
- 4.1. Porters Five Forces
- 5. Market Analysis, Insights and Forecast 2021-2033
- 5.1. Market Analysis, Insights and Forecast - by Fuel Type
- 5.1.1. Renewable
- 5.1.2. Non-renewable
- 5.2. Market Analysis, Insights and Forecast - by Installation
- 5.2.1. Rooftop
- 5.2.2. Ground-based
- 5.3. Market Analysis, Insights and Forecast - by Ownership
- 5.3.1. Operator-owned
- 5.3.2. Joint Venture
- 5.3.3. Private-owned
- 5.3.4. MNO Captive
- 5.4. Market Analysis, Insights and Forecast - by Region
- 5.4.1. North America
- 5.4.2. South America
- 5.4.3. Europe
- 5.4.4. Middle East & Africa
- 5.4.5. Asia Pacific
- 5.1. Market Analysis, Insights and Forecast - by Fuel Type
- 6. Global US Wireless Telecom Tower Industry Analysis, Insights and Forecast, 2021-2033
- 6.1. Market Analysis, Insights and Forecast - by Fuel Type
- 6.1.1. Renewable
- 6.1.2. Non-renewable
- 6.2. Market Analysis, Insights and Forecast - by Installation
- 6.2.1. Rooftop
- 6.2.2. Ground-based
- 6.3. Market Analysis, Insights and Forecast - by Ownership
- 6.3.1. Operator-owned
- 6.3.2. Joint Venture
- 6.3.3. Private-owned
- 6.3.4. MNO Captive
- 6.1. Market Analysis, Insights and Forecast - by Fuel Type
- 7. North America US Wireless Telecom Tower Industry Analysis, Insights and Forecast, 2020-2032
- 7.1. Market Analysis, Insights and Forecast - by Fuel Type
- 7.1.1. Renewable
- 7.1.2. Non-renewable
- 7.2. Market Analysis, Insights and Forecast - by Installation
- 7.2.1. Rooftop
- 7.2.2. Ground-based
- 7.3. Market Analysis, Insights and Forecast - by Ownership
- 7.3.1. Operator-owned
- 7.3.2. Joint Venture
- 7.3.3. Private-owned
- 7.3.4. MNO Captive
- 7.1. Market Analysis, Insights and Forecast - by Fuel Type
- 8. South America US Wireless Telecom Tower Industry Analysis, Insights and Forecast, 2020-2032
- 8.1. Market Analysis, Insights and Forecast - by Fuel Type
- 8.1.1. Renewable
- 8.1.2. Non-renewable
- 8.2. Market Analysis, Insights and Forecast - by Installation
- 8.2.1. Rooftop
- 8.2.2. Ground-based
- 8.3. Market Analysis, Insights and Forecast - by Ownership
- 8.3.1. Operator-owned
- 8.3.2. Joint Venture
- 8.3.3. Private-owned
- 8.3.4. MNO Captive
- 8.1. Market Analysis, Insights and Forecast - by Fuel Type
- 9. Europe US Wireless Telecom Tower Industry Analysis, Insights and Forecast, 2020-2032
- 9.1. Market Analysis, Insights and Forecast - by Fuel Type
- 9.1.1. Renewable
- 9.1.2. Non-renewable
- 9.2. Market Analysis, Insights and Forecast - by Installation
- 9.2.1. Rooftop
- 9.2.2. Ground-based
- 9.3. Market Analysis, Insights and Forecast - by Ownership
- 9.3.1. Operator-owned
- 9.3.2. Joint Venture
- 9.3.3. Private-owned
- 9.3.4. MNO Captive
- 9.1. Market Analysis, Insights and Forecast - by Fuel Type
- 10. Middle East & Africa US Wireless Telecom Tower Industry Analysis, Insights and Forecast, 2020-2032
- 10.1. Market Analysis, Insights and Forecast - by Fuel Type
- 10.1.1. Renewable
- 10.1.2. Non-renewable
- 10.2. Market Analysis, Insights and Forecast - by Installation
- 10.2.1. Rooftop
- 10.2.2. Ground-based
- 10.3. Market Analysis, Insights and Forecast - by Ownership
- 10.3.1. Operator-owned
- 10.3.2. Joint Venture
- 10.3.3. Private-owned
- 10.3.4. MNO Captive
- 10.1. Market Analysis, Insights and Forecast - by Fuel Type
- 11. Asia Pacific US Wireless Telecom Tower Industry Analysis, Insights and Forecast, 2020-2032
- 11.1. Market Analysis, Insights and Forecast - by Fuel Type
- 11.1.1. Renewable
- 11.1.2. Non-renewable
- 11.2. Market Analysis, Insights and Forecast - by Installation
- 11.2.1. Rooftop
- 11.2.2. Ground-based
- 11.3. Market Analysis, Insights and Forecast - by Ownership
- 11.3.1. Operator-owned
- 11.3.2. Joint Venture
- 11.3.3. Private-owned
- 11.3.4. MNO Captive
- 11.1. Market Analysis, Insights and Forecast - by Fuel Type
- 12. Competitive Analysis
- 12.1. Company Profiles
- 12.1.1 SBA Communications Corporation
- 12.1.1.1. Company Overview
- 12.1.1.2. Products
- 12.1.1.3. Company Financials
- 12.1.1.4. SWOT Analysis
- 12.1.2 Melody Wireless Infrastructure
- 12.1.2.1. Company Overview
- 12.1.2.2. Products
- 12.1.2.3. Company Financials
- 12.1.2.4. SWOT Analysis
- 12.1.3 Crown Castle International Corp
- 12.1.3.1. Company Overview
- 12.1.3.2. Products
- 12.1.3.3. Company Financials
- 12.1.3.4. SWOT Analysis
- 12.1.4 AT & T Intellectual Property
- 12.1.4.1. Company Overview
- 12.1.4.2. Products
- 12.1.4.3. Company Financials
- 12.1.4.4. SWOT Analysis
- 12.1.5 Vertical Bridge
- 12.1.5.1. Company Overview
- 12.1.5.2. Products
- 12.1.5.3. Company Financials
- 12.1.5.4. SWOT Analysis
- 12.1.6 Helios Towers plc
- 12.1.6.1. Company Overview
- 12.1.6.2. Products
- 12.1.6.3. Company Financials
- 12.1.6.4. SWOT Analysis
- 12.1.7 Tillman Infrastructure LLC
- 12.1.7.1. Company Overview
- 12.1.7.2. Products
- 12.1.7.3. Company Financials
- 12.1.7.4. SWOT Analysis
- 12.1.8 United States Cellular Co
- 12.1.8.1. Company Overview
- 12.1.8.2. Products
- 12.1.8.3. Company Financials
- 12.1.8.4. SWOT Analysis
- 12.1.9 ATC IP LLC
- 12.1.9.1. Company Overview
- 12.1.9.2. Products
- 12.1.9.3. Company Financials
- 12.1.9.4. SWOT Analysis
- 12.1.10 Insite Wireless Group
- 12.1.10.1. Company Overview
- 12.1.10.2. Products
- 12.1.10.3. Company Financials
- 12.1.10.4. SWOT Analysis
- 12.1.11 BNSF Railroad
- 12.1.11.1. Company Overview
- 12.1.11.2. Products
- 12.1.11.3. Company Financials
- 12.1.11.4. SWOT Analysis
- 12.1.1 SBA Communications Corporation
- 12.2. Market Entropy
- 12.2.1 Company's Key Areas Served
- 12.2.2 Recent Developments
- 12.3. Company Market Share Analysis 2025
- 12.3.1 Top 5 Companies Market Share Analysis
- 12.3.2 Top 3 Companies Market Share Analysis
- 12.4. List of Potential Customers
- 13. Research Methodology
List of Figures
- Figure 1: Global US Wireless Telecom Tower Industry Revenue Breakdown (billion, %) by Region 2025 & 2033
- Figure 2: Global US Wireless Telecom Tower Industry Volume Breakdown (K Unit, %) by Region 2025 & 2033
- Figure 3: North America US Wireless Telecom Tower Industry Revenue (billion), by Fuel Type 2025 & 2033
- Figure 4: North America US Wireless Telecom Tower Industry Volume (K Unit), by Fuel Type 2025 & 2033
- Figure 5: North America US Wireless Telecom Tower Industry Revenue Share (%), by Fuel Type 2025 & 2033
- Figure 6: North America US Wireless Telecom Tower Industry Volume Share (%), by Fuel Type 2025 & 2033
- Figure 7: North America US Wireless Telecom Tower Industry Revenue (billion), by Installation 2025 & 2033
- Figure 8: North America US Wireless Telecom Tower Industry Volume (K Unit), by Installation 2025 & 2033
- Figure 9: North America US Wireless Telecom Tower Industry Revenue Share (%), by Installation 2025 & 2033
- Figure 10: North America US Wireless Telecom Tower Industry Volume Share (%), by Installation 2025 & 2033
- Figure 11: North America US Wireless Telecom Tower Industry Revenue (billion), by Ownership 2025 & 2033
- Figure 12: North America US Wireless Telecom Tower Industry Volume (K Unit), by Ownership 2025 & 2033
- Figure 13: North America US Wireless Telecom Tower Industry Revenue Share (%), by Ownership 2025 & 2033
- Figure 14: North America US Wireless Telecom Tower Industry Volume Share (%), by Ownership 2025 & 2033
- Figure 15: North America US Wireless Telecom Tower Industry Revenue (billion), by Country 2025 & 2033
- Figure 16: North America US Wireless Telecom Tower Industry Volume (K Unit), by Country 2025 & 2033
- Figure 17: North America US Wireless Telecom Tower Industry Revenue Share (%), by Country 2025 & 2033
- Figure 18: North America US Wireless Telecom Tower Industry Volume Share (%), by Country 2025 & 2033
- Figure 19: South America US Wireless Telecom Tower Industry Revenue (billion), by Fuel Type 2025 & 2033
- Figure 20: South America US Wireless Telecom Tower Industry Volume (K Unit), by Fuel Type 2025 & 2033
- Figure 21: South America US Wireless Telecom Tower Industry Revenue Share (%), by Fuel Type 2025 & 2033
- Figure 22: South America US Wireless Telecom Tower Industry Volume Share (%), by Fuel Type 2025 & 2033
- Figure 23: South America US Wireless Telecom Tower Industry Revenue (billion), by Installation 2025 & 2033
- Figure 24: South America US Wireless Telecom Tower Industry Volume (K Unit), by Installation 2025 & 2033
- Figure 25: South America US Wireless Telecom Tower Industry Revenue Share (%), by Installation 2025 & 2033
- Figure 26: South America US Wireless Telecom Tower Industry Volume Share (%), by Installation 2025 & 2033
- Figure 27: South America US Wireless Telecom Tower Industry Revenue (billion), by Ownership 2025 & 2033
- Figure 28: South America US Wireless Telecom Tower Industry Volume (K Unit), by Ownership 2025 & 2033
- Figure 29: South America US Wireless Telecom Tower Industry Revenue Share (%), by Ownership 2025 & 2033
- Figure 30: South America US Wireless Telecom Tower Industry Volume Share (%), by Ownership 2025 & 2033
- Figure 31: South America US Wireless Telecom Tower Industry Revenue (billion), by Country 2025 & 2033
- Figure 32: South America US Wireless Telecom Tower Industry Volume (K Unit), by Country 2025 & 2033
- Figure 33: South America US Wireless Telecom Tower Industry Revenue Share (%), by Country 2025 & 2033
- Figure 34: South America US Wireless Telecom Tower Industry Volume Share (%), by Country 2025 & 2033
- Figure 35: Europe US Wireless Telecom Tower Industry Revenue (billion), by Fuel Type 2025 & 2033
- Figure 36: Europe US Wireless Telecom Tower Industry Volume (K Unit), by Fuel Type 2025 & 2033
- Figure 37: Europe US Wireless Telecom Tower Industry Revenue Share (%), by Fuel Type 2025 & 2033
- Figure 38: Europe US Wireless Telecom Tower Industry Volume Share (%), by Fuel Type 2025 & 2033
- Figure 39: Europe US Wireless Telecom Tower Industry Revenue (billion), by Installation 2025 & 2033
- Figure 40: Europe US Wireless Telecom Tower Industry Volume (K Unit), by Installation 2025 & 2033
- Figure 41: Europe US Wireless Telecom Tower Industry Revenue Share (%), by Installation 2025 & 2033
- Figure 42: Europe US Wireless Telecom Tower Industry Volume Share (%), by Installation 2025 & 2033
- Figure 43: Europe US Wireless Telecom Tower Industry Revenue (billion), by Ownership 2025 & 2033
- Figure 44: Europe US Wireless Telecom Tower Industry Volume (K Unit), by Ownership 2025 & 2033
- Figure 45: Europe US Wireless Telecom Tower Industry Revenue Share (%), by Ownership 2025 & 2033
- Figure 46: Europe US Wireless Telecom Tower Industry Volume Share (%), by Ownership 2025 & 2033
- Figure 47: Europe US Wireless Telecom Tower Industry Revenue (billion), by Country 2025 & 2033
- Figure 48: Europe US Wireless Telecom Tower Industry Volume (K Unit), by Country 2025 & 2033
- Figure 49: Europe US Wireless Telecom Tower Industry Revenue Share (%), by Country 2025 & 2033
- Figure 50: Europe US Wireless Telecom Tower Industry Volume Share (%), by Country 2025 & 2033
- Figure 51: Middle East & Africa US Wireless Telecom Tower Industry Revenue (billion), by Fuel Type 2025 & 2033
- Figure 52: Middle East & Africa US Wireless Telecom Tower Industry Volume (K Unit), by Fuel Type 2025 & 2033
- Figure 53: Middle East & Africa US Wireless Telecom Tower Industry Revenue Share (%), by Fuel Type 2025 & 2033
- Figure 54: Middle East & Africa US Wireless Telecom Tower Industry Volume Share (%), by Fuel Type 2025 & 2033
- Figure 55: Middle East & Africa US Wireless Telecom Tower Industry Revenue (billion), by Installation 2025 & 2033
- Figure 56: Middle East & Africa US Wireless Telecom Tower Industry Volume (K Unit), by Installation 2025 & 2033
- Figure 57: Middle East & Africa US Wireless Telecom Tower Industry Revenue Share (%), by Installation 2025 & 2033
- Figure 58: Middle East & Africa US Wireless Telecom Tower Industry Volume Share (%), by Installation 2025 & 2033
- Figure 59: Middle East & Africa US Wireless Telecom Tower Industry Revenue (billion), by Ownership 2025 & 2033
- Figure 60: Middle East & Africa US Wireless Telecom Tower Industry Volume (K Unit), by Ownership 2025 & 2033
- Figure 61: Middle East & Africa US Wireless Telecom Tower Industry Revenue Share (%), by Ownership 2025 & 2033
- Figure 62: Middle East & Africa US Wireless Telecom Tower Industry Volume Share (%), by Ownership 2025 & 2033
- Figure 63: Middle East & Africa US Wireless Telecom Tower Industry Revenue (billion), by Country 2025 & 2033
- Figure 64: Middle East & Africa US Wireless Telecom Tower Industry Volume (K Unit), by Country 2025 & 2033
- Figure 65: Middle East & Africa US Wireless Telecom Tower Industry Revenue Share (%), by Country 2025 & 2033
- Figure 66: Middle East & Africa US Wireless Telecom Tower Industry Volume Share (%), by Country 2025 & 2033
- Figure 67: Asia Pacific US Wireless Telecom Tower Industry Revenue (billion), by Fuel Type 2025 & 2033
- Figure 68: Asia Pacific US Wireless Telecom Tower Industry Volume (K Unit), by Fuel Type 2025 & 2033
- Figure 69: Asia Pacific US Wireless Telecom Tower Industry Revenue Share (%), by Fuel Type 2025 & 2033
- Figure 70: Asia Pacific US Wireless Telecom Tower Industry Volume Share (%), by Fuel Type 2025 & 2033
- Figure 71: Asia Pacific US Wireless Telecom Tower Industry Revenue (billion), by Installation 2025 & 2033
- Figure 72: Asia Pacific US Wireless Telecom Tower Industry Volume (K Unit), by Installation 2025 & 2033
- Figure 73: Asia Pacific US Wireless Telecom Tower Industry Revenue Share (%), by Installation 2025 & 2033
- Figure 74: Asia Pacific US Wireless Telecom Tower Industry Volume Share (%), by Installation 2025 & 2033
- Figure 75: Asia Pacific US Wireless Telecom Tower Industry Revenue (billion), by Ownership 2025 & 2033
- Figure 76: Asia Pacific US Wireless Telecom Tower Industry Volume (K Unit), by Ownership 2025 & 2033
- Figure 77: Asia Pacific US Wireless Telecom Tower Industry Revenue Share (%), by Ownership 2025 & 2033
- Figure 78: Asia Pacific US Wireless Telecom Tower Industry Volume Share (%), by Ownership 2025 & 2033
- Figure 79: Asia Pacific US Wireless Telecom Tower Industry Revenue (billion), by Country 2025 & 2033
- Figure 80: Asia Pacific US Wireless Telecom Tower Industry Volume (K Unit), by Country 2025 & 2033
- Figure 81: Asia Pacific US Wireless Telecom Tower Industry Revenue Share (%), by Country 2025 & 2033
- Figure 82: Asia Pacific US Wireless Telecom Tower Industry Volume Share (%), by Country 2025 & 2033
List of Tables
- Table 1: Global US Wireless Telecom Tower Industry Revenue billion Forecast, by Fuel Type 2020 & 2033
- Table 2: Global US Wireless Telecom Tower Industry Volume K Unit Forecast, by Fuel Type 2020 & 2033
- Table 3: Global US Wireless Telecom Tower Industry Revenue billion Forecast, by Installation 2020 & 2033
- Table 4: Global US Wireless Telecom Tower Industry Volume K Unit Forecast, by Installation 2020 & 2033
- Table 5: Global US Wireless Telecom Tower Industry Revenue billion Forecast, by Ownership 2020 & 2033
- Table 6: Global US Wireless Telecom Tower Industry Volume K Unit Forecast, by Ownership 2020 & 2033
- Table 7: Global US Wireless Telecom Tower Industry Revenue billion Forecast, by Region 2020 & 2033
- Table 8: Global US Wireless Telecom Tower Industry Volume K Unit Forecast, by Region 2020 & 2033
- Table 9: Global US Wireless Telecom Tower Industry Revenue billion Forecast, by Fuel Type 2020 & 2033
- Table 10: Global US Wireless Telecom Tower Industry Volume K Unit Forecast, by Fuel Type 2020 & 2033
- Table 11: Global US Wireless Telecom Tower Industry Revenue billion Forecast, by Installation 2020 & 2033
- Table 12: Global US Wireless Telecom Tower Industry Volume K Unit Forecast, by Installation 2020 & 2033
- Table 13: Global US Wireless Telecom Tower Industry Revenue billion Forecast, by Ownership 2020 & 2033
- Table 14: Global US Wireless Telecom Tower Industry Volume K Unit Forecast, by Ownership 2020 & 2033
- Table 15: Global US Wireless Telecom Tower Industry Revenue billion Forecast, by Country 2020 & 2033
- Table 16: Global US Wireless Telecom Tower Industry Volume K Unit Forecast, by Country 2020 & 2033
- Table 17: United States US Wireless Telecom Tower Industry Revenue (billion) Forecast, by Application 2020 & 2033
- Table 18: United States US Wireless Telecom Tower Industry Volume (K Unit) Forecast, by Application 2020 & 2033
- Table 19: Canada US Wireless Telecom Tower Industry Revenue (billion) Forecast, by Application 2020 & 2033
- Table 20: Canada US Wireless Telecom Tower Industry Volume (K Unit) Forecast, by Application 2020 & 2033
- Table 21: Mexico US Wireless Telecom Tower Industry Revenue (billion) Forecast, by Application 2020 & 2033
- Table 22: Mexico US Wireless Telecom Tower Industry Volume (K Unit) Forecast, by Application 2020 & 2033
- Table 23: Global US Wireless Telecom Tower Industry Revenue billion Forecast, by Fuel Type 2020 & 2033
- Table 24: Global US Wireless Telecom Tower Industry Volume K Unit Forecast, by Fuel Type 2020 & 2033
- Table 25: Global US Wireless Telecom Tower Industry Revenue billion Forecast, by Installation 2020 & 2033
- Table 26: Global US Wireless Telecom Tower Industry Volume K Unit Forecast, by Installation 2020 & 2033
- Table 27: Global US Wireless Telecom Tower Industry Revenue billion Forecast, by Ownership 2020 & 2033
- Table 28: Global US Wireless Telecom Tower Industry Volume K Unit Forecast, by Ownership 2020 & 2033
- Table 29: Global US Wireless Telecom Tower Industry Revenue billion Forecast, by Country 2020 & 2033
- Table 30: Global US Wireless Telecom Tower Industry Volume K Unit Forecast, by Country 2020 & 2033
- Table 31: Brazil US Wireless Telecom Tower Industry Revenue (billion) Forecast, by Application 2020 & 2033
- Table 32: Brazil US Wireless Telecom Tower Industry Volume (K Unit) Forecast, by Application 2020 & 2033
- Table 33: Argentina US Wireless Telecom Tower Industry Revenue (billion) Forecast, by Application 2020 & 2033
- Table 34: Argentina US Wireless Telecom Tower Industry Volume (K Unit) Forecast, by Application 2020 & 2033
- Table 35: Rest of South America US Wireless Telecom Tower Industry Revenue (billion) Forecast, by Application 2020 & 2033
- Table 36: Rest of South America US Wireless Telecom Tower Industry Volume (K Unit) Forecast, by Application 2020 & 2033
- Table 37: Global US Wireless Telecom Tower Industry Revenue billion Forecast, by Fuel Type 2020 & 2033
- Table 38: Global US Wireless Telecom Tower Industry Volume K Unit Forecast, by Fuel Type 2020 & 2033
- Table 39: Global US Wireless Telecom Tower Industry Revenue billion Forecast, by Installation 2020 & 2033
- Table 40: Global US Wireless Telecom Tower Industry Volume K Unit Forecast, by Installation 2020 & 2033
- Table 41: Global US Wireless Telecom Tower Industry Revenue billion Forecast, by Ownership 2020 & 2033
- Table 42: Global US Wireless Telecom Tower Industry Volume K Unit Forecast, by Ownership 2020 & 2033
- Table 43: Global US Wireless Telecom Tower Industry Revenue billion Forecast, by Country 2020 & 2033
- Table 44: Global US Wireless Telecom Tower Industry Volume K Unit Forecast, by Country 2020 & 2033
- Table 45: United Kingdom US Wireless Telecom Tower Industry Revenue (billion) Forecast, by Application 2020 & 2033
- Table 46: United Kingdom US Wireless Telecom Tower Industry Volume (K Unit) Forecast, by Application 2020 & 2033
- Table 47: Germany US Wireless Telecom Tower Industry Revenue (billion) Forecast, by Application 2020 & 2033
- Table 48: Germany US Wireless Telecom Tower Industry Volume (K Unit) Forecast, by Application 2020 & 2033
- Table 49: France US Wireless Telecom Tower Industry Revenue (billion) Forecast, by Application 2020 & 2033
- Table 50: France US Wireless Telecom Tower Industry Volume (K Unit) Forecast, by Application 2020 & 2033
- Table 51: Italy US Wireless Telecom Tower Industry Revenue (billion) Forecast, by Application 2020 & 2033
- Table 52: Italy US Wireless Telecom Tower Industry Volume (K Unit) Forecast, by Application 2020 & 2033
- Table 53: Spain US Wireless Telecom Tower Industry Revenue (billion) Forecast, by Application 2020 & 2033
- Table 54: Spain US Wireless Telecom Tower Industry Volume (K Unit) Forecast, by Application 2020 & 2033
- Table 55: Russia US Wireless Telecom Tower Industry Revenue (billion) Forecast, by Application 2020 & 2033
- Table 56: Russia US Wireless Telecom Tower Industry Volume (K Unit) Forecast, by Application 2020 & 2033
- Table 57: Benelux US Wireless Telecom Tower Industry Revenue (billion) Forecast, by Application 2020 & 2033
- Table 58: Benelux US Wireless Telecom Tower Industry Volume (K Unit) Forecast, by Application 2020 & 2033
- Table 59: Nordics US Wireless Telecom Tower Industry Revenue (billion) Forecast, by Application 2020 & 2033
- Table 60: Nordics US Wireless Telecom Tower Industry Volume (K Unit) Forecast, by Application 2020 & 2033
- Table 61: Rest of Europe US Wireless Telecom Tower Industry Revenue (billion) Forecast, by Application 2020 & 2033
- Table 62: Rest of Europe US Wireless Telecom Tower Industry Volume (K Unit) Forecast, by Application 2020 & 2033
- Table 63: Global US Wireless Telecom Tower Industry Revenue billion Forecast, by Fuel Type 2020 & 2033
- Table 64: Global US Wireless Telecom Tower Industry Volume K Unit Forecast, by Fuel Type 2020 & 2033
- Table 65: Global US Wireless Telecom Tower Industry Revenue billion Forecast, by Installation 2020 & 2033
- Table 66: Global US Wireless Telecom Tower Industry Volume K Unit Forecast, by Installation 2020 & 2033
- Table 67: Global US Wireless Telecom Tower Industry Revenue billion Forecast, by Ownership 2020 & 2033
- Table 68: Global US Wireless Telecom Tower Industry Volume K Unit Forecast, by Ownership 2020 & 2033
- Table 69: Global US Wireless Telecom Tower Industry Revenue billion Forecast, by Country 2020 & 2033
- Table 70: Global US Wireless Telecom Tower Industry Volume K Unit Forecast, by Country 2020 & 2033
- Table 71: Turkey US Wireless Telecom Tower Industry Revenue (billion) Forecast, by Application 2020 & 2033
- Table 72: Turkey US Wireless Telecom Tower Industry Volume (K Unit) Forecast, by Application 2020 & 2033
- Table 73: Israel US Wireless Telecom Tower Industry Revenue (billion) Forecast, by Application 2020 & 2033
- Table 74: Israel US Wireless Telecom Tower Industry Volume (K Unit) Forecast, by Application 2020 & 2033
- Table 75: GCC US Wireless Telecom Tower Industry Revenue (billion) Forecast, by Application 2020 & 2033
- Table 76: GCC US Wireless Telecom Tower Industry Volume (K Unit) Forecast, by Application 2020 & 2033
- Table 77: North Africa US Wireless Telecom Tower Industry Revenue (billion) Forecast, by Application 2020 & 2033
- Table 78: North Africa US Wireless Telecom Tower Industry Volume (K Unit) Forecast, by Application 2020 & 2033
- Table 79: South Africa US Wireless Telecom Tower Industry Revenue (billion) Forecast, by Application 2020 & 2033
- Table 80: South Africa US Wireless Telecom Tower Industry Volume (K Unit) Forecast, by Application 2020 & 2033
- Table 81: Rest of Middle East & Africa US Wireless Telecom Tower Industry Revenue (billion) Forecast, by Application 2020 & 2033
- Table 82: Rest of Middle East & Africa US Wireless Telecom Tower Industry Volume (K Unit) Forecast, by Application 2020 & 2033
- Table 83: Global US Wireless Telecom Tower Industry Revenue billion Forecast, by Fuel Type 2020 & 2033
- Table 84: Global US Wireless Telecom Tower Industry Volume K Unit Forecast, by Fuel Type 2020 & 2033
- Table 85: Global US Wireless Telecom Tower Industry Revenue billion Forecast, by Installation 2020 & 2033
- Table 86: Global US Wireless Telecom Tower Industry Volume K Unit Forecast, by Installation 2020 & 2033
- Table 87: Global US Wireless Telecom Tower Industry Revenue billion Forecast, by Ownership 2020 & 2033
- Table 88: Global US Wireless Telecom Tower Industry Volume K Unit Forecast, by Ownership 2020 & 2033
- Table 89: Global US Wireless Telecom Tower Industry Revenue billion Forecast, by Country 2020 & 2033
- Table 90: Global US Wireless Telecom Tower Industry Volume K Unit Forecast, by Country 2020 & 2033
- Table 91: China US Wireless Telecom Tower Industry Revenue (billion) Forecast, by Application 2020 & 2033
- Table 92: China US Wireless Telecom Tower Industry Volume (K Unit) Forecast, by Application 2020 & 2033
- Table 93: India US Wireless Telecom Tower Industry Revenue (billion) Forecast, by Application 2020 & 2033
- Table 94: India US Wireless Telecom Tower Industry Volume (K Unit) Forecast, by Application 2020 & 2033
- Table 95: Japan US Wireless Telecom Tower Industry Revenue (billion) Forecast, by Application 2020 & 2033
- Table 96: Japan US Wireless Telecom Tower Industry Volume (K Unit) Forecast, by Application 2020 & 2033
- Table 97: South Korea US Wireless Telecom Tower Industry Revenue (billion) Forecast, by Application 2020 & 2033
- Table 98: South Korea US Wireless Telecom Tower Industry Volume (K Unit) Forecast, by Application 2020 & 2033
- Table 99: ASEAN US Wireless Telecom Tower Industry Revenue (billion) Forecast, by Application 2020 & 2033
- Table 100: ASEAN US Wireless Telecom Tower Industry Volume (K Unit) Forecast, by Application 2020 & 2033
- Table 101: Oceania US Wireless Telecom Tower Industry Revenue (billion) Forecast, by Application 2020 & 2033
- Table 102: Oceania US Wireless Telecom Tower Industry Volume (K Unit) Forecast, by Application 2020 & 2033
- Table 103: Rest of Asia Pacific US Wireless Telecom Tower Industry Revenue (billion) Forecast, by Application 2020 & 2033
- Table 104: Rest of Asia Pacific US Wireless Telecom Tower Industry Volume (K Unit) Forecast, by Application 2020 & 2033
Frequently Asked Questions
1. What is the projected Compound Annual Growth Rate (CAGR) of the US Wireless Telecom Tower Industry?
The projected CAGR is approximately 4.7%.
2. Which companies are prominent players in the US Wireless Telecom Tower Industry?
Key companies in the market include SBA Communications Corporation, Melody Wireless Infrastructure, Crown Castle International Corp, AT & T Intellectual Property, Vertical Bridge, Helios Towers plc, Tillman Infrastructure LLC, United States Cellular Co, ATC IP LLC, Insite Wireless Group, BNSF Railroad.
3. What are the main segments of the US Wireless Telecom Tower Industry?
The market segments include Fuel Type, Installation, Ownership.
4. Can you provide details about the market size?
The market size is estimated to be USD 14.1 billion as of 2022.
5. What are some drivers contributing to market growth?
5G deployments are a major catalyst for growth in the cell-tower leasing environment.
6. What are the notable trends driving market growth?
Adoption of 5G to Drive the Market.
7. Are there any restraints impacting market growth?
Availability of Limited Spectrum.
8. Can you provide examples of recent developments in the market?
January 2022 - The announcement of a new 12-year collaboration between T-Mobile US, Inc. and Crown Castle International Corp. would enable T-Mobile to have more access to Crown Castle's towers and small cell sites as the company expands its national 5G network. With the help of the deal, the Un-carrier may serve customers across the United States by further extending and broadening the coverage of the company's 5G network and generating financial synergies after its merger. Additionally, the deal assists Crown Castle in developing long-term income development from small cells and towers.
9. What pricing options are available for accessing the report?
Pricing options include single-user, multi-user, and enterprise licenses priced at USD 3800, USD 4500, and USD 5800 respectively.
10. Is the market size provided in terms of value or volume?
The market size is provided in terms of value, measured in billion and volume, measured in K Unit.
11. Are there any specific market keywords associated with the report?
Yes, the market keyword associated with the report is "US Wireless Telecom Tower Industry," which aids in identifying and referencing the specific market segment covered.
12. How do I determine which pricing option suits my needs best?
The pricing options vary based on user requirements and access needs. Individual users may opt for single-user licenses, while businesses requiring broader access may choose multi-user or enterprise licenses for cost-effective access to the report.
13. Are there any additional resources or data provided in the US Wireless Telecom Tower Industry report?
While the report offers comprehensive insights, it's advisable to review the specific contents or supplementary materials provided to ascertain if additional resources or data are available.
14. How can I stay updated on further developments or reports in the US Wireless Telecom Tower Industry?
To stay informed about further developments, trends, and reports in the US Wireless Telecom Tower Industry, consider subscribing to industry newsletters, following relevant companies and organizations, or regularly checking reputable industry news sources and publications.
Methodology
Step 1 - Identification of Relevant Samples Size from Population Database


Step 2 - Approaches for Defining Global Market Size (Value, Volume* & Price*)

Note*: In applicable scenarios
Step 3 - Data Sources
Primary Research
- Web Analytics
- Survey Reports
- Research Institute
- Latest Research Reports
- Opinion Leaders
Secondary Research
- Annual Reports
- White Paper
- Latest Press Release
- Industry Association
- Paid Database
- Investor Presentations

Step 4 - Data Triangulation
Involves using different sources of information in order to increase the validity of a study
These sources are likely to be stakeholders in a program - participants, other researchers, program staff, other community members, and so on.
Then we put all data in single framework & apply various statistical tools to find out the dynamic on the market.
During the analysis stage, feedback from the stakeholder groups would be compared to determine areas of agreement as well as areas of divergence