

Key Insights
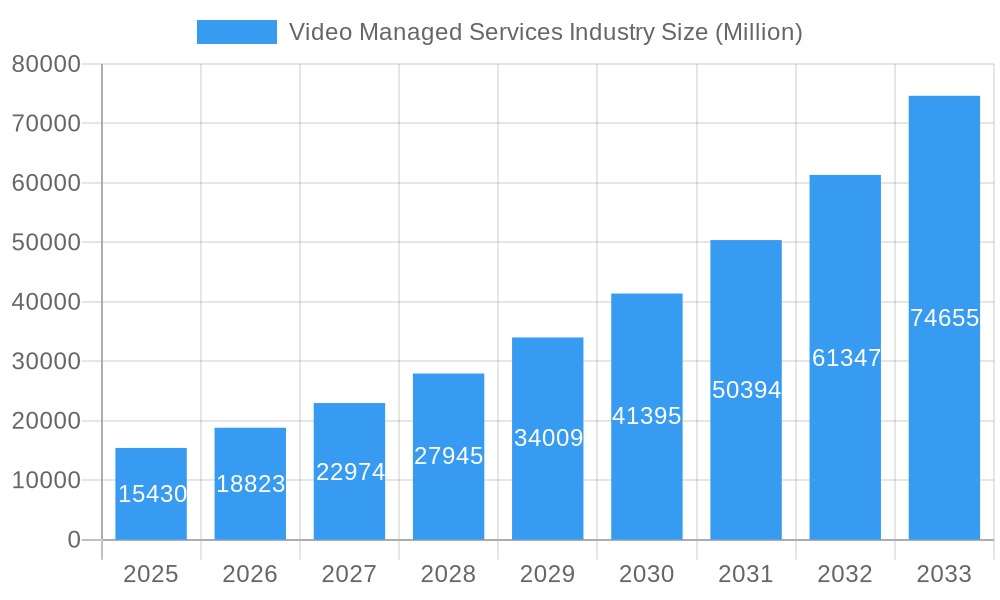
The Video Managed Services market is poised for remarkable expansion, with a current estimated market size of $15.43 billion in 2025, projected to surge forward at an impressive Compound Annual Growth Rate (CAGR) of 22.25% through 2033. This robust growth is fueled by a confluence of factors, primarily the escalating adoption of cloud-based communication solutions and the increasing demand for seamless, high-quality video conferencing and collaboration experiences across enterprises of all sizes. The continuous evolution of video technology, coupled with the growing reliance on remote and hybrid work models, underscores the critical need for reliable and expertly managed video infrastructure. Key drivers include the demand for enhanced employee productivity, improved customer engagement, and cost-efficiency derived from outsourcing complex IT operations. The market is segmented into Software and Hardware, with the software segment expected to lead due to the increasing sophistication of video platforms and integration capabilities.
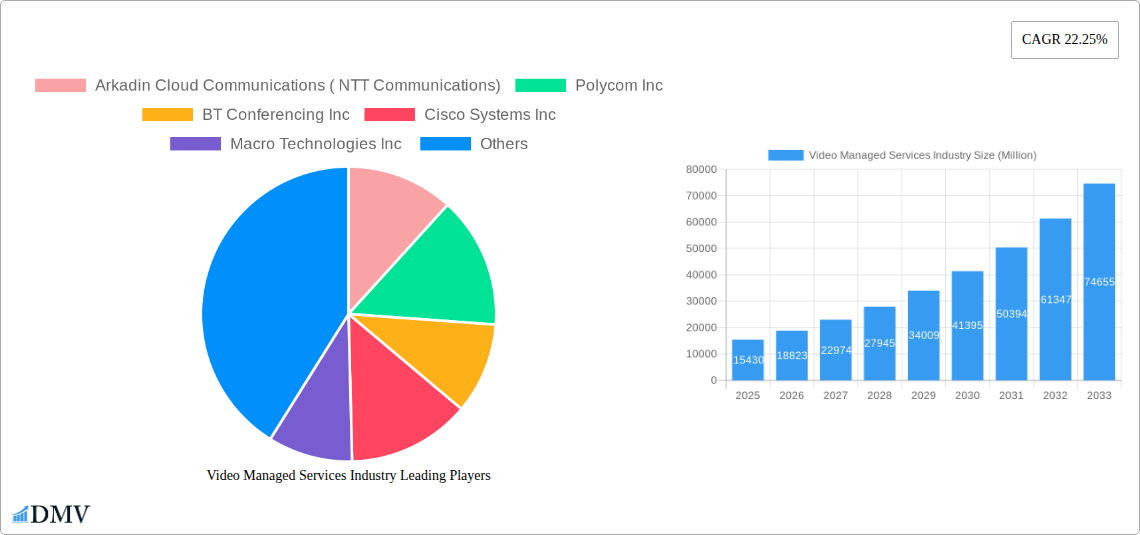
Video Managed Services Industry Market Size (In Billion)
The market's trajectory is further shaped by key trends such as the integration of Artificial Intelligence (AI) for enhanced meeting analytics and user experience, the rise of immersive collaboration technologies like virtual and augmented reality, and the increasing focus on cybersecurity within video communication platforms. Small and Medium Enterprises (SMEs) are increasingly recognizing the value proposition of managed services, leading to significant growth in this segment, mirroring the adoption patterns seen in Large Enterprises. Business-to-Business (B2B) applications currently dominate, driven by corporate communication needs, but Business-to-Consumer (B2C) applications are anticipated to gain traction with the proliferation of advanced consumer-grade video communication tools. While growth is strong, potential restraints include initial implementation costs and concerns over data privacy, although these are being mitigated by service providers offering robust security measures and flexible pricing models. Prominent players like Arkadin Cloud Communications, Polycom, and Cisco Systems are actively innovating and expanding their service portfolios to capture this dynamic market. Regional market analysis indicates North America and Europe as leading regions, with Asia Pacific demonstrating substantial growth potential.
Video Managed Services Industry Company Market Share
This in-depth report provides an unparalleled view of the Video Managed Services Industry, meticulously analyzing its current landscape and forecasting its trajectory through 2033. Delve into market dynamics, technological innovations, and the strategic imperatives shaping the video conferencing solutions, collaboration tools, and cloud video services market. Discover how leading enterprises and SMEs are leveraging these services for seamless business-to-business (B2B) and business-to-consumer (B2C) interactions, driving efficiency and connectivity. With a focus on the Software and Hardware segments, and insights into both Large Enterprise and Small & Medium Enterprise (SME) adoption, this report is your definitive guide to understanding and capitalizing on the evolving video communications market.
Video Managed Services Industry Market Composition & Trends
The Video Managed Services Industry exhibits a dynamic market composition characterized by both consolidation and fierce competition. Market share distribution sees a significant presence of established players, with companies like Cisco Systems Inc. and Polycom Inc. holding substantial portions, alongside emerging contenders and specialized service providers. Innovation catalysts are abundant, fueled by the escalating demand for enhanced remote work solutions, virtual event platforms, and digital transformation initiatives. The regulatory landscape, while generally supportive of connectivity, introduces nuances in data privacy and security that managed service providers must navigate. Substitute products, such as basic video conferencing apps, are present but often lack the comprehensive features, support, and scalability offered by managed services. End-user profiles range from global corporations seeking to optimize their intercompany communication to SMEs looking for cost-effective, reliable video infrastructure management. Mergers and acquisitions (M&A) are a significant trend, with recent deal values in the hundreds of millions reflecting strategic efforts to expand service portfolios and market reach. For instance, the integration of advanced video surveillance data management solutions, as seen with Quantum Corporation's partnership, highlights a diversification trend.
- Market Concentration: Moderate to High, with key players dominating specific segments.
- Innovation Drivers: Remote work, hybrid models, AI integration, enhanced user experience.
- Regulatory Focus: Data privacy (GDPR, CCPA), security compliance, interoperability standards.
- Substitute Offerings: Free or basic video conferencing tools, on-premise solutions.
- End-User Segmentation: Large Enterprises (e.g., global corporations, financial institutions), SMEs (e.g., startups, regional businesses), educational institutions, healthcare providers.
- M&A Activity: Steady, with strategic acquisitions to bolster capabilities in areas like cloud, AI, and security.
Video Managed Services Industry Industry Evolution
The Video Managed Services Industry has undergone a profound evolution, transforming from niche communication tools into indispensable pillars of modern business operations. The historical period from 2019 to 2024 witnessed an accelerated adoption driven by the global pandemic, pushing remote work and virtual collaboration to the forefront. This surge propelled market growth rates to unprecedented levels, with an estimated annual growth of over 15% during this period. The base year of 2025 marks a point of sustained expansion, where the industry continues its upward trajectory, projected to maintain a robust Compound Annual Growth Rate (CAGR) of approximately 12-14% through the forecast period of 2025–2033. Technological advancements have been relentless, moving beyond basic video calls to encompass sophisticated features like AI-powered transcription, intelligent meeting management, immersive virtual environments, and seamless integration with other enterprise software. Hardware innovations have focused on higher resolution, better audio quality, and user-friendly interfaces, while software solutions have prioritized cloud-native architectures, enhanced security, and broader device compatibility. Shifting consumer demands have played a pivotal role, with users expecting intuitive, reliable, and secure video communication experiences across all platforms and devices. This has pushed providers to invest heavily in user experience (UX) and customer support. The adoption of these services has moved from a “nice-to-have” to a “must-have” for businesses of all sizes, underpinning productivity and enabling new operational models. The market's resilience and adaptability, showcased by its rapid response to evolving needs, position it for continued dominance in the communication and collaboration landscape.
Leading Regions, Countries, or Segments in Video Managed Services Industry
The Video Managed Services Industry exhibits distinct regional dominance and segment leadership. North America, particularly the United States, currently leads the market owing to its strong technological infrastructure, high adoption of advanced communication solutions, and a significant concentration of large enterprises. Europe follows closely, driven by increasing investments in digital transformation and supportive regulatory frameworks. The Asia-Pacific region is emerging as a high-growth market, fueled by rapid economic development and a burgeoning SME sector adopting video conferencing solutions for expanding their reach.
Within segments, the Software component is experiencing explosive growth, encompassing a wide array of cloud-based platforms, collaboration tools, and AI-driven functionalities. This segment is projected to outpace hardware in terms of market share and growth rate through the forecast period. The Hardware segment remains crucial, with continuous innovation in cameras, displays, and integrated room systems, but its growth is more closely tied to refresh cycles and new deployments.
- Enterprise Size: Large Enterprise segment continues to be the primary revenue generator due to their extensive deployment needs and higher per-user spending. However, the Small & Medium Enterprise (SME) segment is exhibiting a higher CAGR as cost-effective, managed solutions become more accessible, enabling SMEs to leverage sophisticated communication tools previously out of reach. This segment's growth is significantly boosted by the affordability and scalability of cloud-based offerings.
- Applications: Business to Business (B2B) applications overwhelmingly dominate the market. This includes internal communication, client meetings, sales presentations, project collaboration, and remote support. The demand for seamless B2B video managed services is a direct consequence of globalization, remote work policies, and the need for efficient, real-time interaction across geographically dispersed teams and stakeholders. While Business to Consumer (B2C) applications are growing, particularly in areas like telehealth and remote learning, their current market share and revenue contribution are considerably smaller compared to the B2B sector.
- Investment Trends: Significant investments are flowing into cloud infrastructure, AI integration for enhanced meeting analytics and user experience, and security enhancements to build trust and compliance. Government initiatives promoting digital connectivity and business resilience also play a role.
- Regulatory Support: Favorable policies promoting digital infrastructure development and cybersecurity standards in leading regions encourage market expansion.
- Technological Advancements: Continuous innovation in bandwidth optimization, interoperability between different platforms, and the development of more intuitive user interfaces are key drivers of segment dominance.
Video Managed Services Industry Product Innovations
Product innovations in the Video Managed Services Industry are rapidly redefining collaboration and communication. Advances in AI are powering features like real-time translation, automated meeting summarization, and intelligent participant engagement analysis, significantly enhancing productivity. High-definition and ultra-high-definition video quality, coupled with advanced audio processing, are becoming standard, creating near-in-person experiences. The integration of augmented reality (AR) and virtual reality (VR) is paving the way for immersive virtual meeting spaces, offering unique selling propositions for companies seeking cutting-edge solutions. Performance metrics are constantly being pushed, with focus on low latency, high uptime, and seamless scalability to accommodate fluctuating user demands. This continuous evolution ensures that managed video services remain at the forefront of technological advancement.
Propelling Factors for Video Managed Services Industry Growth
The Video Managed Services Industry is propelled by several key factors, primarily driven by the ongoing digital transformation and the shift towards hybrid work models.
- Technological Advancements: The relentless pace of innovation in cloud computing, AI, and network infrastructure enables more robust, feature-rich, and accessible video managed services.
- Growing Demand for Remote Collaboration: The widespread adoption of remote and hybrid work environments necessitates reliable and sophisticated video communication tools for effective team collaboration and client engagement.
- Cost-Effectiveness and Scalability: Managed services offer enterprises a predictable cost structure and the ability to scale their video communication capabilities up or down as needed, without significant upfront capital investment.
- Enhanced User Experience: Continuous improvements in user interface design and feature sets are making video managed services more intuitive and accessible to a broader range of users.
Obstacles in the Video Managed Services Industry Market
Despite its robust growth, the Video Managed Services Industry faces several obstacles that can impede market expansion.
- Cybersecurity Concerns: The increasing sophistication of cyber threats poses a constant challenge, requiring significant investment in robust security measures to protect sensitive data transmitted through video communication platforms.
- Interoperability Issues: While improving, achieving seamless interoperability between diverse hardware and software platforms from different vendors can still be a challenge for organizations with complex IT ecosystems.
- Bandwidth Limitations in Emerging Markets: In certain regions, inadequate internet infrastructure and bandwidth limitations can hinder the widespread adoption and optimal performance of high-quality video managed services.
- High Implementation Costs for Certain Solutions: While managed services offer cost advantages, the initial setup and integration of advanced solutions, particularly for large-scale deployments, can still represent a significant investment for some businesses.
Future Opportunities in Video Managed Services Industry
The Video Managed Services Industry is poised for significant future opportunities, driven by emerging trends and evolving technological landscapes.
- Expansion into New Verticals: The increasing application of video managed services in sectors like healthcare (telemedicine), education (remote learning), and manufacturing (remote assistance, quality control) presents substantial growth potential.
- AI-Powered Personalization and Analytics: Leveraging AI to provide highly personalized user experiences and advanced meeting analytics will become a key differentiator and revenue driver.
- Metaverse and Immersive Collaboration: The development of the metaverse and its integration with business communication tools will open up new frontiers for virtual collaboration, training, and client interaction.
- Enhanced Security and Compliance Solutions: As data privacy regulations tighten globally, there will be a growing demand for managed services that offer advanced, compliant security features and robust data protection.
Major Players in the Video Managed Services Industry Ecosystem
- Arkadin Cloud Communications (NTT Communications)
- Polycom Inc
- BT Conferencing Inc
- Cisco Systems Inc
- Macro Technologies Inc
- Applied Global Technologies
- Dimension Data
- AVI-SPL Inc
- ZTE Enterprise
- AT&T Business
- Telus Communications
- Vega Global
Key Developments in Video Managed Services Industry Industry
- August 2023: Quantum Corporation, the leader in solutions for video and unstructured data, announced a partnership with Tiger Surveillance, a leading provider of video surveillance data management and protection solutions, to deliver end-to-end solutions for long-term retention and archiving of video surveillance data.
- June 2023: Check Point Software Technologies Ltd. partnered with TELUS, to launch the TELUS Cloud Security Posture Management (CSPM) service in Canada. Backed by Check Point's AI-powered threat prevention and high fidelity posture management technology, TELUS CSPM offers a comprehensive managed solution for Canadian organizations to monitor cloud security posture in real-time and detect, remediate and report on vulnerabilities.
Strategic Video Managed Services Industry Market Forecast
The strategic forecast for the Video Managed Services Industry indicates a period of sustained and robust growth, underpinned by escalating demand for integrated communication and collaboration solutions. Key growth catalysts include the persistent adoption of hybrid work models, the continuous advancement of AI in video technologies, and the expanding reach of cloud-based service delivery. The market's ability to provide scalable, secure, and cost-effective solutions will continue to attract both large enterprises and SMEs. Emerging opportunities in sectors like telehealth and immersive collaboration further solidify the positive outlook, positioning the industry for significant expansion and innovation in the coming years, with a projected market value reaching into the billions of dollars.
Video Managed Services Industry Segmentation
-
1. Type
- 1.1. Software
- 1.2. Hardware
-
2. Enterprise Size
- 2.1. Large Enterprise
- 2.2. Small & Medium Enterprise
-
3. Applications
- 3.1. Business to Business
- 3.2. Business to Consumer
Video Managed Services Industry Segmentation By Geography
- 1. North America
- 2. Europe
- 3. Asia Pacific
- 4. Rest of the World
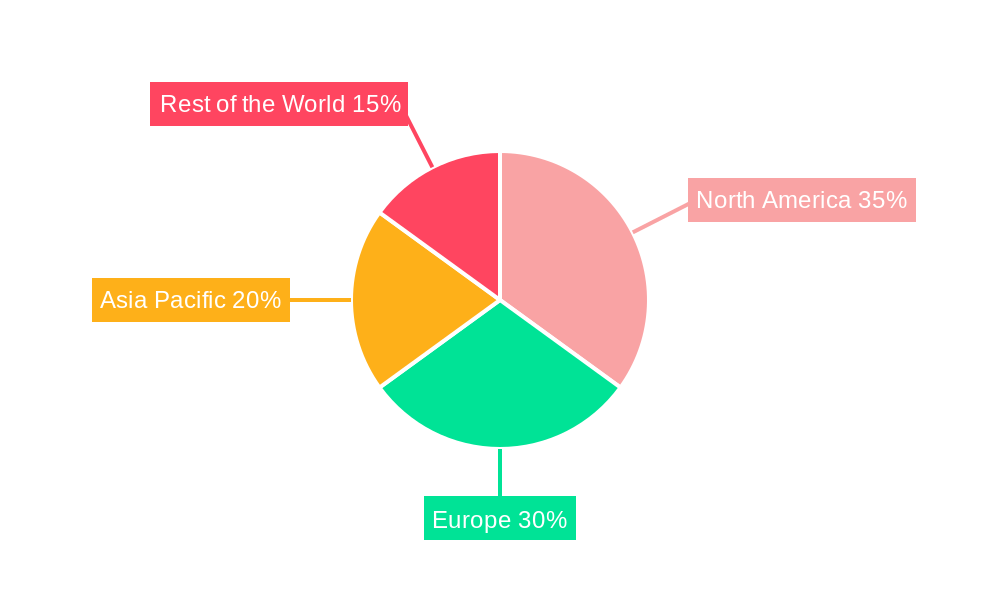
Video Managed Services Industry Regional Market Share
Geographic Coverage of Video Managed Services Industry
Video Managed Services Industry REPORT HIGHLIGHTS
| Aspects | Details |
|---|---|
| Study Period | 2020-2034 |
| Base Year | 2025 |
| Estimated Year | 2026 |
| Forecast Period | 2026-2034 |
| Historical Period | 2020-2025 |
| Growth Rate | CAGR of 22.25% from 2020-2034 |
| Segmentation |
|
Table of Contents
- 1. Introduction
- 1.1. Research Scope
- 1.2. Market Segmentation
- 1.3. Research Objective
- 1.4. Definitions and Assumptions
- 2. Executive Summary
- 2.1. Market Snapshot
- 3. Market Dynamics
- 3.1. Market Drivers
- 3.2. Market Restrains
- 3.3. Market Trends
- 3.4. Market Opportunities
- 4. Market Factor Analysis
- 4.1. Porters Five Forces
- 4.1.1. Bargaining Power of Suppliers
- 4.1.2. Bargaining Power of Buyers
- 4.1.3. Threat of New Entrants
- 4.1.4. Threat of Substitutes
- 4.1.5. Competitive Rivalry
- 4.2. PESTEL analysis
- 4.3. BCG Analysis
- 4.3.1. Stars (High Growth, High Market Share)
- 4.3.2. Cash Cows (Low Growth, High Market Share)
- 4.3.3. Question Mark (High Growth, Low Market Share)
- 4.3.4. Dogs (Low Growth, Low Market Share)
- 4.4. Ansoff Matrix Analysis
- 4.5. Supply Chain Analysis
- 4.6. Regulatory Landscape
- 4.7. Current Market Potential and Opportunity Assessment (TAM–SAM–SOM Framework)
- 4.8. DMV Analyst Note
- 4.1. Porters Five Forces
- 5. Market Analysis, Insights and Forecast 2021-2033
- 5.1. Market Analysis, Insights and Forecast - by Type
- 5.1.1. Software
- 5.1.2. Hardware
- 5.2. Market Analysis, Insights and Forecast - by Enterprise Size
- 5.2.1. Large Enterprise
- 5.2.2. Small & Medium Enterprise
- 5.3. Market Analysis, Insights and Forecast - by Applications
- 5.3.1. Business to Business
- 5.3.2. Business to Consumer
- 5.4. Market Analysis, Insights and Forecast - by Region
- 5.4.1. North America
- 5.4.2. Europe
- 5.4.3. Asia Pacific
- 5.4.4. Rest of the World
- 5.1. Market Analysis, Insights and Forecast - by Type
- 6. Global Video Managed Services Industry Analysis, Insights and Forecast, 2021-2033
- 6.1. Market Analysis, Insights and Forecast - by Type
- 6.1.1. Software
- 6.1.2. Hardware
- 6.2. Market Analysis, Insights and Forecast - by Enterprise Size
- 6.2.1. Large Enterprise
- 6.2.2. Small & Medium Enterprise
- 6.3. Market Analysis, Insights and Forecast - by Applications
- 6.3.1. Business to Business
- 6.3.2. Business to Consumer
- 6.1. Market Analysis, Insights and Forecast - by Type
- 7. North America Video Managed Services Industry Analysis, Insights and Forecast, 2020-2032
- 7.1. Market Analysis, Insights and Forecast - by Type
- 7.1.1. Software
- 7.1.2. Hardware
- 7.2. Market Analysis, Insights and Forecast - by Enterprise Size
- 7.2.1. Large Enterprise
- 7.2.2. Small & Medium Enterprise
- 7.3. Market Analysis, Insights and Forecast - by Applications
- 7.3.1. Business to Business
- 7.3.2. Business to Consumer
- 7.1. Market Analysis, Insights and Forecast - by Type
- 8. Europe Video Managed Services Industry Analysis, Insights and Forecast, 2020-2032
- 8.1. Market Analysis, Insights and Forecast - by Type
- 8.1.1. Software
- 8.1.2. Hardware
- 8.2. Market Analysis, Insights and Forecast - by Enterprise Size
- 8.2.1. Large Enterprise
- 8.2.2. Small & Medium Enterprise
- 8.3. Market Analysis, Insights and Forecast - by Applications
- 8.3.1. Business to Business
- 8.3.2. Business to Consumer
- 8.1. Market Analysis, Insights and Forecast - by Type
- 9. Asia Pacific Video Managed Services Industry Analysis, Insights and Forecast, 2020-2032
- 9.1. Market Analysis, Insights and Forecast - by Type
- 9.1.1. Software
- 9.1.2. Hardware
- 9.2. Market Analysis, Insights and Forecast - by Enterprise Size
- 9.2.1. Large Enterprise
- 9.2.2. Small & Medium Enterprise
- 9.3. Market Analysis, Insights and Forecast - by Applications
- 9.3.1. Business to Business
- 9.3.2. Business to Consumer
- 9.1. Market Analysis, Insights and Forecast - by Type
- 10. Rest of the World Video Managed Services Industry Analysis, Insights and Forecast, 2020-2032
- 10.1. Market Analysis, Insights and Forecast - by Type
- 10.1.1. Software
- 10.1.2. Hardware
- 10.2. Market Analysis, Insights and Forecast - by Enterprise Size
- 10.2.1. Large Enterprise
- 10.2.2. Small & Medium Enterprise
- 10.3. Market Analysis, Insights and Forecast - by Applications
- 10.3.1. Business to Business
- 10.3.2. Business to Consumer
- 10.1. Market Analysis, Insights and Forecast - by Type
- 11. Competitive Analysis
- 11.1. Company Profiles
- 11.1.1 Arkadin Cloud Communications ( NTT Communications)
- 11.1.1.1. Company Overview
- 11.1.1.2. Products
- 11.1.1.3. Company Financials
- 11.1.1.4. SWOT Analysis
- 11.1.2 Polycom Inc
- 11.1.2.1. Company Overview
- 11.1.2.2. Products
- 11.1.2.3. Company Financials
- 11.1.2.4. SWOT Analysis
- 11.1.3 BT Conferencing Inc
- 11.1.3.1. Company Overview
- 11.1.3.2. Products
- 11.1.3.3. Company Financials
- 11.1.3.4. SWOT Analysis
- 11.1.4 Cisco Systems Inc
- 11.1.4.1. Company Overview
- 11.1.4.2. Products
- 11.1.4.3. Company Financials
- 11.1.4.4. SWOT Analysis
- 11.1.5 Macro Technologies Inc
- 11.1.5.1. Company Overview
- 11.1.5.2. Products
- 11.1.5.3. Company Financials
- 11.1.5.4. SWOT Analysis
- 11.1.6 Applied Global Technologies
- 11.1.6.1. Company Overview
- 11.1.6.2. Products
- 11.1.6.3. Company Financials
- 11.1.6.4. SWOT Analysis
- 11.1.7 Dimension Data
- 11.1.7.1. Company Overview
- 11.1.7.2. Products
- 11.1.7.3. Company Financials
- 11.1.7.4. SWOT Analysis
- 11.1.8 AVI-SPL Inc
- 11.1.8.1. Company Overview
- 11.1.8.2. Products
- 11.1.8.3. Company Financials
- 11.1.8.4. SWOT Analysis
- 11.1.9 ZTE Enterprise
- 11.1.9.1. Company Overview
- 11.1.9.2. Products
- 11.1.9.3. Company Financials
- 11.1.9.4. SWOT Analysis
- 11.1.10 AT&T Business
- 11.1.10.1. Company Overview
- 11.1.10.2. Products
- 11.1.10.3. Company Financials
- 11.1.10.4. SWOT Analysis
- 11.1.11 Telus Communications
- 11.1.11.1. Company Overview
- 11.1.11.2. Products
- 11.1.11.3. Company Financials
- 11.1.11.4. SWOT Analysis
- 11.1.12 Vega Global
- 11.1.12.1. Company Overview
- 11.1.12.2. Products
- 11.1.12.3. Company Financials
- 11.1.12.4. SWOT Analysis
- 11.1.1 Arkadin Cloud Communications ( NTT Communications)
- 11.2. Market Entropy
- 11.2.1 Company's Key Areas Served
- 11.2.2 Recent Developments
- 11.3. Company Market Share Analysis 2025
- 11.3.1 Top 5 Companies Market Share Analysis
- 11.3.2 Top 3 Companies Market Share Analysis
- 11.4. List of Potential Customers
- 12. Research Methodology
List of Figures
- Figure 1: Global Video Managed Services Industry Revenue Breakdown (Million, %) by Region 2025 & 2033
- Figure 2: Global Video Managed Services Industry Volume Breakdown (K Unit, %) by Region 2025 & 2033
- Figure 3: North America Video Managed Services Industry Revenue (Million), by Type 2025 & 2033
- Figure 4: North America Video Managed Services Industry Volume (K Unit), by Type 2025 & 2033
- Figure 5: North America Video Managed Services Industry Revenue Share (%), by Type 2025 & 2033
- Figure 6: North America Video Managed Services Industry Volume Share (%), by Type 2025 & 2033
- Figure 7: North America Video Managed Services Industry Revenue (Million), by Enterprise Size 2025 & 2033
- Figure 8: North America Video Managed Services Industry Volume (K Unit), by Enterprise Size 2025 & 2033
- Figure 9: North America Video Managed Services Industry Revenue Share (%), by Enterprise Size 2025 & 2033
- Figure 10: North America Video Managed Services Industry Volume Share (%), by Enterprise Size 2025 & 2033
- Figure 11: North America Video Managed Services Industry Revenue (Million), by Applications 2025 & 2033
- Figure 12: North America Video Managed Services Industry Volume (K Unit), by Applications 2025 & 2033
- Figure 13: North America Video Managed Services Industry Revenue Share (%), by Applications 2025 & 2033
- Figure 14: North America Video Managed Services Industry Volume Share (%), by Applications 2025 & 2033
- Figure 15: North America Video Managed Services Industry Revenue (Million), by Country 2025 & 2033
- Figure 16: North America Video Managed Services Industry Volume (K Unit), by Country 2025 & 2033
- Figure 17: North America Video Managed Services Industry Revenue Share (%), by Country 2025 & 2033
- Figure 18: North America Video Managed Services Industry Volume Share (%), by Country 2025 & 2033
- Figure 19: Europe Video Managed Services Industry Revenue (Million), by Type 2025 & 2033
- Figure 20: Europe Video Managed Services Industry Volume (K Unit), by Type 2025 & 2033
- Figure 21: Europe Video Managed Services Industry Revenue Share (%), by Type 2025 & 2033
- Figure 22: Europe Video Managed Services Industry Volume Share (%), by Type 2025 & 2033
- Figure 23: Europe Video Managed Services Industry Revenue (Million), by Enterprise Size 2025 & 2033
- Figure 24: Europe Video Managed Services Industry Volume (K Unit), by Enterprise Size 2025 & 2033
- Figure 25: Europe Video Managed Services Industry Revenue Share (%), by Enterprise Size 2025 & 2033
- Figure 26: Europe Video Managed Services Industry Volume Share (%), by Enterprise Size 2025 & 2033
- Figure 27: Europe Video Managed Services Industry Revenue (Million), by Applications 2025 & 2033
- Figure 28: Europe Video Managed Services Industry Volume (K Unit), by Applications 2025 & 2033
- Figure 29: Europe Video Managed Services Industry Revenue Share (%), by Applications 2025 & 2033
- Figure 30: Europe Video Managed Services Industry Volume Share (%), by Applications 2025 & 2033
- Figure 31: Europe Video Managed Services Industry Revenue (Million), by Country 2025 & 2033
- Figure 32: Europe Video Managed Services Industry Volume (K Unit), by Country 2025 & 2033
- Figure 33: Europe Video Managed Services Industry Revenue Share (%), by Country 2025 & 2033
- Figure 34: Europe Video Managed Services Industry Volume Share (%), by Country 2025 & 2033
- Figure 35: Asia Pacific Video Managed Services Industry Revenue (Million), by Type 2025 & 2033
- Figure 36: Asia Pacific Video Managed Services Industry Volume (K Unit), by Type 2025 & 2033
- Figure 37: Asia Pacific Video Managed Services Industry Revenue Share (%), by Type 2025 & 2033
- Figure 38: Asia Pacific Video Managed Services Industry Volume Share (%), by Type 2025 & 2033
- Figure 39: Asia Pacific Video Managed Services Industry Revenue (Million), by Enterprise Size 2025 & 2033
- Figure 40: Asia Pacific Video Managed Services Industry Volume (K Unit), by Enterprise Size 2025 & 2033
- Figure 41: Asia Pacific Video Managed Services Industry Revenue Share (%), by Enterprise Size 2025 & 2033
- Figure 42: Asia Pacific Video Managed Services Industry Volume Share (%), by Enterprise Size 2025 & 2033
- Figure 43: Asia Pacific Video Managed Services Industry Revenue (Million), by Applications 2025 & 2033
- Figure 44: Asia Pacific Video Managed Services Industry Volume (K Unit), by Applications 2025 & 2033
- Figure 45: Asia Pacific Video Managed Services Industry Revenue Share (%), by Applications 2025 & 2033
- Figure 46: Asia Pacific Video Managed Services Industry Volume Share (%), by Applications 2025 & 2033
- Figure 47: Asia Pacific Video Managed Services Industry Revenue (Million), by Country 2025 & 2033
- Figure 48: Asia Pacific Video Managed Services Industry Volume (K Unit), by Country 2025 & 2033
- Figure 49: Asia Pacific Video Managed Services Industry Revenue Share (%), by Country 2025 & 2033
- Figure 50: Asia Pacific Video Managed Services Industry Volume Share (%), by Country 2025 & 2033
- Figure 51: Rest of the World Video Managed Services Industry Revenue (Million), by Type 2025 & 2033
- Figure 52: Rest of the World Video Managed Services Industry Volume (K Unit), by Type 2025 & 2033
- Figure 53: Rest of the World Video Managed Services Industry Revenue Share (%), by Type 2025 & 2033
- Figure 54: Rest of the World Video Managed Services Industry Volume Share (%), by Type 2025 & 2033
- Figure 55: Rest of the World Video Managed Services Industry Revenue (Million), by Enterprise Size 2025 & 2033
- Figure 56: Rest of the World Video Managed Services Industry Volume (K Unit), by Enterprise Size 2025 & 2033
- Figure 57: Rest of the World Video Managed Services Industry Revenue Share (%), by Enterprise Size 2025 & 2033
- Figure 58: Rest of the World Video Managed Services Industry Volume Share (%), by Enterprise Size 2025 & 2033
- Figure 59: Rest of the World Video Managed Services Industry Revenue (Million), by Applications 2025 & 2033
- Figure 60: Rest of the World Video Managed Services Industry Volume (K Unit), by Applications 2025 & 2033
- Figure 61: Rest of the World Video Managed Services Industry Revenue Share (%), by Applications 2025 & 2033
- Figure 62: Rest of the World Video Managed Services Industry Volume Share (%), by Applications 2025 & 2033
- Figure 63: Rest of the World Video Managed Services Industry Revenue (Million), by Country 2025 & 2033
- Figure 64: Rest of the World Video Managed Services Industry Volume (K Unit), by Country 2025 & 2033
- Figure 65: Rest of the World Video Managed Services Industry Revenue Share (%), by Country 2025 & 2033
- Figure 66: Rest of the World Video Managed Services Industry Volume Share (%), by Country 2025 & 2033
List of Tables
- Table 1: Global Video Managed Services Industry Revenue Million Forecast, by Type 2020 & 2033
- Table 2: Global Video Managed Services Industry Volume K Unit Forecast, by Type 2020 & 2033
- Table 3: Global Video Managed Services Industry Revenue Million Forecast, by Enterprise Size 2020 & 2033
- Table 4: Global Video Managed Services Industry Volume K Unit Forecast, by Enterprise Size 2020 & 2033
- Table 5: Global Video Managed Services Industry Revenue Million Forecast, by Applications 2020 & 2033
- Table 6: Global Video Managed Services Industry Volume K Unit Forecast, by Applications 2020 & 2033
- Table 7: Global Video Managed Services Industry Revenue Million Forecast, by Region 2020 & 2033
- Table 8: Global Video Managed Services Industry Volume K Unit Forecast, by Region 2020 & 2033
- Table 9: Global Video Managed Services Industry Revenue Million Forecast, by Type 2020 & 2033
- Table 10: Global Video Managed Services Industry Volume K Unit Forecast, by Type 2020 & 2033
- Table 11: Global Video Managed Services Industry Revenue Million Forecast, by Enterprise Size 2020 & 2033
- Table 12: Global Video Managed Services Industry Volume K Unit Forecast, by Enterprise Size 2020 & 2033
- Table 13: Global Video Managed Services Industry Revenue Million Forecast, by Applications 2020 & 2033
- Table 14: Global Video Managed Services Industry Volume K Unit Forecast, by Applications 2020 & 2033
- Table 15: Global Video Managed Services Industry Revenue Million Forecast, by Country 2020 & 2033
- Table 16: Global Video Managed Services Industry Volume K Unit Forecast, by Country 2020 & 2033
- Table 17: Global Video Managed Services Industry Revenue Million Forecast, by Type 2020 & 2033
- Table 18: Global Video Managed Services Industry Volume K Unit Forecast, by Type 2020 & 2033
- Table 19: Global Video Managed Services Industry Revenue Million Forecast, by Enterprise Size 2020 & 2033
- Table 20: Global Video Managed Services Industry Volume K Unit Forecast, by Enterprise Size 2020 & 2033
- Table 21: Global Video Managed Services Industry Revenue Million Forecast, by Applications 2020 & 2033
- Table 22: Global Video Managed Services Industry Volume K Unit Forecast, by Applications 2020 & 2033
- Table 23: Global Video Managed Services Industry Revenue Million Forecast, by Country 2020 & 2033
- Table 24: Global Video Managed Services Industry Volume K Unit Forecast, by Country 2020 & 2033
- Table 25: Global Video Managed Services Industry Revenue Million Forecast, by Type 2020 & 2033
- Table 26: Global Video Managed Services Industry Volume K Unit Forecast, by Type 2020 & 2033
- Table 27: Global Video Managed Services Industry Revenue Million Forecast, by Enterprise Size 2020 & 2033
- Table 28: Global Video Managed Services Industry Volume K Unit Forecast, by Enterprise Size 2020 & 2033
- Table 29: Global Video Managed Services Industry Revenue Million Forecast, by Applications 2020 & 2033
- Table 30: Global Video Managed Services Industry Volume K Unit Forecast, by Applications 2020 & 2033
- Table 31: Global Video Managed Services Industry Revenue Million Forecast, by Country 2020 & 2033
- Table 32: Global Video Managed Services Industry Volume K Unit Forecast, by Country 2020 & 2033
- Table 33: Global Video Managed Services Industry Revenue Million Forecast, by Type 2020 & 2033
- Table 34: Global Video Managed Services Industry Volume K Unit Forecast, by Type 2020 & 2033
- Table 35: Global Video Managed Services Industry Revenue Million Forecast, by Enterprise Size 2020 & 2033
- Table 36: Global Video Managed Services Industry Volume K Unit Forecast, by Enterprise Size 2020 & 2033
- Table 37: Global Video Managed Services Industry Revenue Million Forecast, by Applications 2020 & 2033
- Table 38: Global Video Managed Services Industry Volume K Unit Forecast, by Applications 2020 & 2033
- Table 39: Global Video Managed Services Industry Revenue Million Forecast, by Country 2020 & 2033
- Table 40: Global Video Managed Services Industry Volume K Unit Forecast, by Country 2020 & 2033
Frequently Asked Questions
1. What is the projected Compound Annual Growth Rate (CAGR) of the Video Managed Services Industry?
The projected CAGR is approximately 22.25%.
2. Which companies are prominent players in the Video Managed Services Industry?
Key companies in the market include Arkadin Cloud Communications ( NTT Communications), Polycom Inc, BT Conferencing Inc, Cisco Systems Inc, Macro Technologies Inc , Applied Global Technologies, Dimension Data, AVI-SPL Inc, ZTE Enterprise, AT&T Business, Telus Communications, Vega Global.
3. What are the main segments of the Video Managed Services Industry?
The market segments include Type, Enterprise Size, Applications.
4. Can you provide details about the market size?
The market size is estimated to be USD 15.43 Million as of 2022.
5. What are some drivers contributing to market growth?
Adoption of BYOD (Bring Your Own Device); Higher Productivity Rate by Reducing Unnecessary Hours.
6. What are the notable trends driving market growth?
Software Segment to Witness the Growth.
7. Are there any restraints impacting market growth?
High Initial Investments and Installation Costs.
8. Can you provide examples of recent developments in the market?
August 2023 - Quantum Corporation, the leader in solutions for video and unstructured data, announced a partnership with Tiger Surveillance, a leading provider of video surveillance data management and protection solutions, to deliver end-to-end solutions for long-term retention and archiving of video surveillance data.
9. What pricing options are available for accessing the report?
Pricing options include single-user, multi-user, and enterprise licenses priced at USD 4750, USD 5250, and USD 8750 respectively.
10. Is the market size provided in terms of value or volume?
The market size is provided in terms of value, measured in Million and volume, measured in K Unit.
11. Are there any specific market keywords associated with the report?
Yes, the market keyword associated with the report is "Video Managed Services Industry," which aids in identifying and referencing the specific market segment covered.
12. How do I determine which pricing option suits my needs best?
The pricing options vary based on user requirements and access needs. Individual users may opt for single-user licenses, while businesses requiring broader access may choose multi-user or enterprise licenses for cost-effective access to the report.
13. Are there any additional resources or data provided in the Video Managed Services Industry report?
While the report offers comprehensive insights, it's advisable to review the specific contents or supplementary materials provided to ascertain if additional resources or data are available.
14. How can I stay updated on further developments or reports in the Video Managed Services Industry?
To stay informed about further developments, trends, and reports in the Video Managed Services Industry, consider subscribing to industry newsletters, following relevant companies and organizations, or regularly checking reputable industry news sources and publications.
Methodology
Step 1 - Identification of Relevant Samples Size from Population Database


Step 2 - Approaches for Defining Global Market Size (Value, Volume* & Price*)

Note*: In applicable scenarios
Step 3 - Data Sources
Primary Research
- Web Analytics
- Survey Reports
- Research Institute
- Latest Research Reports
- Opinion Leaders
Secondary Research
- Annual Reports
- White Paper
- Latest Press Release
- Industry Association
- Paid Database
- Investor Presentations

Step 4 - Data Triangulation
Involves using different sources of information in order to increase the validity of a study
These sources are likely to be stakeholders in a program - participants, other researchers, program staff, other community members, and so on.
Then we put all data in single framework & apply various statistical tools to find out the dynamic on the market.
During the analysis stage, feedback from the stakeholder groups would be compared to determine areas of agreement as well as areas of divergence