

Key Insights
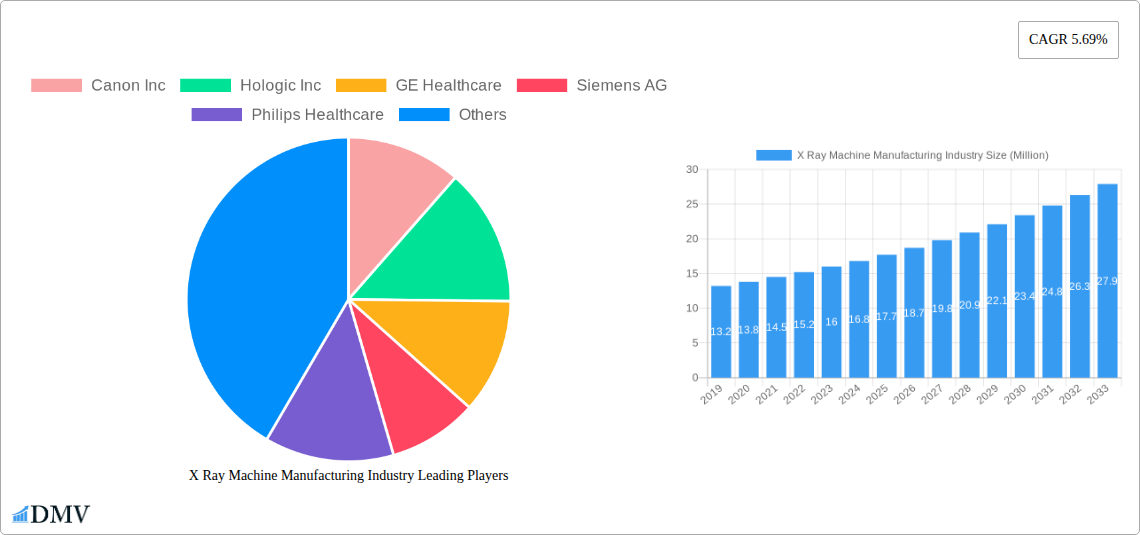
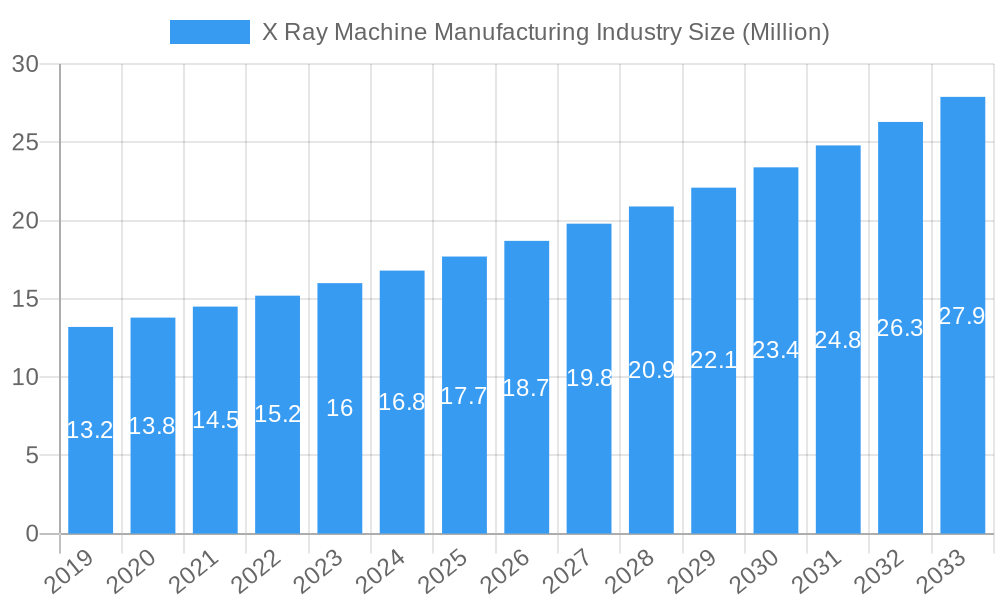
The X-Ray Machine Manufacturing Industry is poised for robust growth, projected to reach a significant market size of approximately USD 17.70 million by 2025, with a compelling Compound Annual Growth Rate (CAGR) of 5.69% expected to propel it through the forecast period ending in 2033. This expansion is primarily driven by the escalating demand for advanced diagnostic imaging solutions across critical sectors, most notably healthcare. The increasing prevalence of chronic diseases, coupled with an aging global population, necessitates more frequent and sophisticated diagnostic procedures, directly boosting the adoption of X-ray technology. Furthermore, advancements in digital radiography and the integration of artificial intelligence for image analysis are enhancing diagnostic accuracy and efficiency, further fueling market penetration. Government initiatives aimed at improving healthcare infrastructure, especially in emerging economies, and the continuous need for effective security screening in transportation and logistics sectors also contribute significantly to market expansion. The industry is characterized by a strong focus on innovation, with manufacturers investing heavily in research and development to introduce more portable, user-friendly, and high-resolution X-ray systems.
X Ray Machine Manufacturing Industry Market Size (In Million)
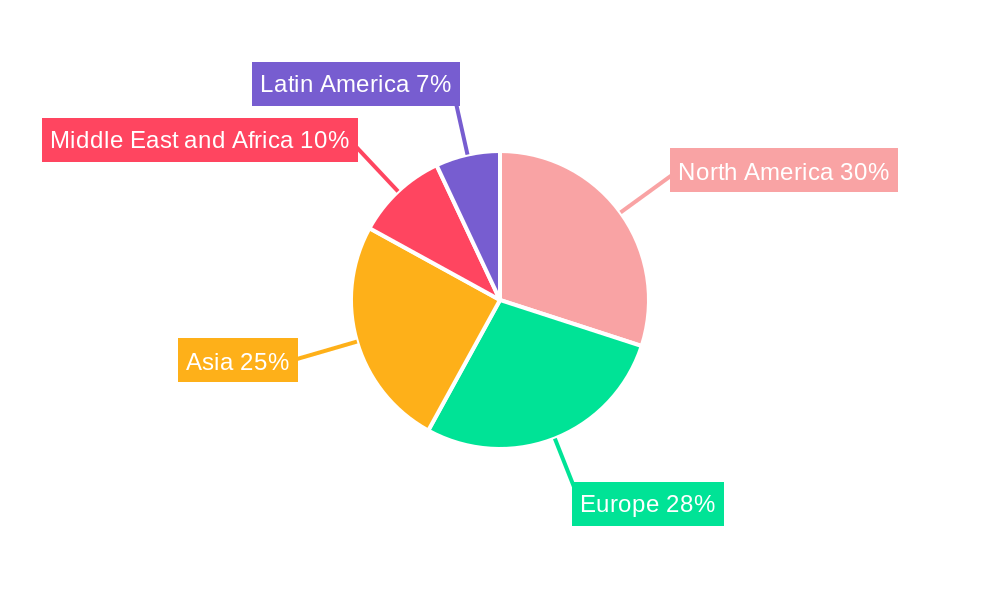
While the market presents substantial opportunities, certain restraints need to be navigated. The high initial cost of advanced X-ray equipment and the associated maintenance expenses can pose a barrier, particularly for smaller healthcare facilities or in price-sensitive markets. Stringent regulatory approvals for medical devices also add to the product development lifecycle and costs. However, the increasing adoption of portable X-ray devices is mitigating some of these cost concerns, offering more flexible and accessible diagnostic solutions. The market is segmented into various product types, including stationary and portable X-ray machines, and technologies such as analog and digital, with digital technology dominating due to its superior image quality and workflow efficiencies. Key end-user industries like healthcare, transportation and logistics, and government bodies are the primary consumers, with healthcare holding the largest share. Geographically, North America and Europe currently lead the market, but the Asia-Pacific region, driven by rapid economic development and increasing healthcare expenditure in countries like China and India, is expected to witness the fastest growth.
X Ray Machine Manufacturing Industry Company Market Share
X Ray Machine Manufacturing Industry Market Composition & Trends
This comprehensive report delves into the dynamic X Ray Machine Manufacturing Industry, analyzing its intricate market composition and evolving trends from 2019 to 2033. We meticulously evaluate market concentration, identifying key players and their respective market shares, estimated to be concentrated with the top 5 companies holding approximately 70% of the global market share. The report highlights innovation catalysts, such as advancements in digital radiography (DR) and artificial intelligence (AI) integration, which are reshaping product development. The complex regulatory landscapes across different regions are thoroughly examined, impacting product approvals and market access. We also assess the threat of substitute products and the evolving profiles of end-users, with healthcare dominating demand, representing an estimated 85% of the market. Furthermore, strategic mergers and acquisitions (M&A) activities are dissected, with recent M&A deal values estimated to be in the hundreds of millions of dollars, underscoring industry consolidation.
- Market Concentration: Top 5 players control ~70% of the market.
- Innovation Catalysts: AI integration, DR advancements, portable solutions.
- Regulatory Landscapes: Varying compliance requirements across North America, Europe, and Asia.
- Substitute Products: Ultrasound, MRI, CT scans offer alternatives for specific diagnostic needs.
- End-User Dominance: Healthcare sector accounts for ~85% of market demand.
- M&A Activity: Significant consolidation with deal values in the hundreds of millions of dollars.
X Ray Machine Manufacturing Industry Industry Evolution
The X Ray Machine Manufacturing Industry is undergoing a remarkable transformation, driven by sustained technological innovation, increasing global healthcare expenditures, and a growing demand for advanced diagnostic imaging solutions. Over the historical period of 2019–2024, the industry witnessed steady growth, with a Compound Annual Growth Rate (CAGR) of approximately 5.5%. This growth was largely fueled by the increasing prevalence of chronic diseases and the need for early detection, where X-ray technology plays a crucial role. The shift from analog to digital X-ray systems has been a defining trend, offering enhanced image quality, reduced radiation exposure, and improved workflow efficiency. Digital radiography (DR) adoption has accelerated, with its market share projected to exceed 80% by 2025. The base year, 2025, is projected to see a market size of approximately $12.5 Billion, with significant investments in upgrading existing infrastructure and developing new, more sophisticated imaging devices.
Technological advancements are at the forefront of this evolution. The integration of Artificial Intelligence (AI) in X-ray systems is revolutionizing image analysis, enabling faster and more accurate diagnoses. AI-powered software can assist radiologists in identifying subtle abnormalities, reducing interpretation time, and improving diagnostic confidence. Furthermore, the development of portable and handheld X-ray machines is expanding access to diagnostic imaging in remote areas, emergency settings, and point-of-care applications. These innovations are not only improving patient outcomes but also driving demand for next-generation X-ray equipment. Consumer demand is also shifting towards more cost-effective, user-friendly, and minimally invasive diagnostic tools, further pushing manufacturers to innovate. The forecast period of 2025–2033 anticipates a CAGR of around 6.2%, indicating a robust growth trajectory fueled by these multifaceted drivers. The industry is continuously adapting to meet the evolving needs of healthcare providers and patients, ensuring its continued relevance and expansion in the global medical device market.
Leading Regions, Countries, or Segments in X Ray Machine Manufacturing Industry
North America currently dominates the X Ray Machine Manufacturing Industry, driven by a robust healthcare infrastructure, high adoption rates of advanced medical technologies, and significant government investments in healthcare modernization. The region's dominance is further bolstered by the presence of major industry players and a strong emphasis on research and development. The United States, in particular, stands out due to its large healthcare market, a high per capita expenditure on medical imaging, and favorable reimbursement policies for diagnostic procedures.
Product Type Dominance:
- Stationary X-ray machines command the largest market share, estimated at over 75%, owing to their widespread use in hospitals, diagnostic centers, and specialized clinics where high-volume imaging is performed. Their robust design and comprehensive capabilities make them indispensable for a wide range of diagnostic applications, from general radiography to specialized procedures.
- Portable X-ray machines are experiencing rapid growth, particularly in emerging economies and emergency medical services, driven by the need for on-site diagnostics and accessibility in remote locations. Their market share is projected to expand significantly in the coming years.
Technology Dominance:
- Digital X-ray technology is the clear leader, representing over 80% of the market share. The benefits of digital radiography, including superior image quality, lower radiation doses, enhanced workflow efficiency, and easier image archiving and retrieval, have made it the preferred choice for modern healthcare facilities. The transition from analog to digital systems has been a key driver of market growth and innovation.
End-user Dominance:
- Healthcare is the overwhelmingly dominant end-user segment, accounting for an estimated 85% of the X Ray Machine Manufacturing Industry market. This includes hospitals, diagnostic imaging centers, specialized clinics, and private practices. The indispensable role of X-rays in diagnosing a vast array of medical conditions, from skeletal fractures to pulmonary diseases, cements healthcare's leading position.
- Government sector also plays a crucial role, particularly in public health initiatives, military applications, and disaster response, contributing an estimated 8% of the market.
- Transportation and Logistics, while a smaller segment (estimated at 4%), utilizes X-ray technology for security screening at airports and ports, ensuring public safety.
- Other End-users, including industrial radiography for non-destructive testing and research institutions, constitute the remaining portion of the market.
Key drivers for North America's leadership include substantial investment trends in upgrading medical imaging equipment, supportive regulatory frameworks that encourage technological adoption, and a strong focus on patient care leading to demand for advanced diagnostic tools. The region's capacity for innovation and its well-established distribution networks further solidify its position at the forefront of the X Ray Machine Manufacturing Industry.
X Ray Machine Manufacturing Industry Product Innovations
Recent product innovations in the X Ray Machine Manufacturing Industry are dramatically enhancing diagnostic capabilities and operational efficiency. A key advancement includes the development of AI-driven image processing software that significantly reduces image acquisition time and improves diagnostic accuracy, as exemplified by GE Healthcare's Intelligent Workflow Suite. Furthermore, manufacturers are focusing on creating highly portable and versatile X-ray units that can be deployed in diverse settings, from emergency rooms to remote clinics, catering to the growing demand for point-of-care diagnostics. The integration of advanced detectors, such as Fujifilm's new generation detectors, offers superior image clarity and lower radiation doses for patients. These innovations are not only improving the performance metrics of X-ray machines but also making them more accessible and user-friendly for healthcare professionals.
Propelling Factors for X Ray Machine Manufacturing Industry Growth
The X Ray Machine Manufacturing Industry is experiencing robust growth fueled by several key factors. Technologically, the relentless advancements in digital radiography (DR) and the integration of Artificial Intelligence (AI) are leading to higher precision, better image quality, and enhanced workflow efficiencies, driving demand for new equipment. Economically, increasing global healthcare expenditures, particularly in emerging economies, and the rising prevalence of chronic diseases necessitate advanced diagnostic tools. Regulatory bodies in many countries are also actively promoting the adoption of modern medical imaging technologies to improve patient care and public health outcomes. The ongoing need for diagnostic imaging in diverse settings, from hospitals to specialized clinics and even point-of-care applications, further propels market expansion.
Obstacles in the X Ray Machine Manufacturing Industry Market
Despite strong growth, the X Ray Machine Manufacturing Industry faces several obstacles. Stringent regulatory approvals and compliance requirements in different countries can be time-consuming and costly, delaying market entry for new products. The high initial investment cost of advanced digital X-ray systems can be a significant barrier for smaller healthcare facilities, especially in price-sensitive markets. Moreover, supply chain disruptions, as witnessed in recent years, can impact production timelines and component availability. Intense competition among established players and emerging manufacturers also puts pressure on pricing and profit margins, demanding continuous innovation and cost-efficiency.
Future Opportunities in X Ray Machine Manufacturing Industry
The X Ray Machine Manufacturing Industry is ripe with future opportunities. The increasing demand for portable and handheld X-ray devices presents a significant avenue for growth, particularly in remote healthcare settings and emergency response. The burgeoning adoption of AI and machine learning in medical imaging offers substantial potential for developing smarter diagnostic tools that can automate image analysis and improve diagnostic accuracy. Furthermore, the expansion of healthcare infrastructure in emerging economies, coupled with a growing middle class, will drive demand for cost-effective and advanced X-ray solutions. Industry players can also explore opportunities in niche applications, such as veterinary radiography and industrial non-destructive testing, to diversify their market reach.
Major Players in the X Ray Machine Manufacturing Industry Ecosystem
- Canon Inc
- Hologic Inc
- GE Healthcare
- Siemens AG
- Philips Healthcare
- Hindrays
- Hitachi Medical Corporation
- Vision Medicaid Equipment Private Limited
- Shimadzu Corporation
- Fujifilm Holdings Corporation
Key Developments in X Ray Machine Manufacturing Industry Industry
- November 2022: Konica Minolta Healthcare Americas, Inc., a global leader in medical diagnostic imaging and healthcare information technology, introduced groundbreaking digital radiography (DR) technologies designed to revolutionize the clinical utility of X-rays.
- August 2022: GE Healthcare unveiled its latest fixed X-ray equipment, which functions as a dedicated "personal assistant" for radiology departments. The next-generation Definium 656 HD, equipped with in-room workflows, motorization, and the Intelligent Workflow Suite, offers invaluable support to technologists by assisting with patient positioning and method selection. This not only reduces the physical demands on technologists but also enhances overall productivity, making the most of a technologist's time spent with patients. Radiologists can benefit from this innovative system as well, as it combines FlashPad detectors, sophisticated picture generation apps, and the latest AI-driven helix advanced image processing software to improve image clarity, reduce errors, and minimize variability.
Strategic X Ray Machine Manufacturing Industry Market Forecast
The strategic market forecast for the X Ray Machine Manufacturing Industry indicates a promising growth trajectory driven by an increasing global demand for advanced diagnostic imaging. The continuous evolution of digital radiography (DR) and the integration of Artificial Intelligence (AI) are poised to revolutionize diagnostic accuracy and efficiency. Emerging markets, with their expanding healthcare infrastructure and rising disposable incomes, present significant opportunities for market penetration. Furthermore, the growing emphasis on early disease detection and preventative healthcare will sustain the demand for sophisticated X-ray solutions. Industry players are expected to focus on developing portable, user-friendly, and cost-effective systems to cater to a wider range of healthcare settings, ensuring sustained market expansion and innovation.
X Ray Machine Manufacturing Industry Segmentation
-
1. Product Type
- 1.1. Stationary
- 1.2. Portable
-
2. Technology
- 2.1. Analog
- 2.2. Digital
-
3. End-user
- 3.1. Healthcare
- 3.2. Transportation and Logistics
- 3.3. Government
- 3.4. Other End-users
X Ray Machine Manufacturing Industry Segmentation By Geography
-
1. North America
- 1.1. United States
- 1.2. Canada
-
2. Europe
- 2.1. United Kingdom
- 2.2. Germany
- 2.3. France
-
3. Asia
- 3.1. China
- 3.2. Japan
- 3.3. India
- 3.4. South Korea
- 4. Latin America
- 5. Middle East and Africa
X Ray Machine Manufacturing Industry Regional Market Share
Geographic Coverage of X Ray Machine Manufacturing Industry
X Ray Machine Manufacturing Industry REPORT HIGHLIGHTS
| Aspects | Details |
|---|---|
| Study Period | 2020-2034 |
| Base Year | 2025 |
| Estimated Year | 2026 |
| Forecast Period | 2026-2034 |
| Historical Period | 2020-2025 |
| Growth Rate | CAGR of 5.69% from 2020-2034 |
| Segmentation |
|
Table of Contents
- 1. Introduction
- 1.1. Research Scope
- 1.2. Market Segmentation
- 1.3. Research Objective
- 1.4. Definitions and Assumptions
- 2. Executive Summary
- 2.1. Market Snapshot
- 3. Market Dynamics
- 3.1. Market Drivers
- 3.2. Market Restrains
- 3.3. Market Trends
- 3.4. Market Opportunities
- 4. Market Factor Analysis
- 4.1. Porters Five Forces
- 4.1.1. Bargaining Power of Suppliers
- 4.1.2. Bargaining Power of Buyers
- 4.1.3. Threat of New Entrants
- 4.1.4. Threat of Substitutes
- 4.1.5. Competitive Rivalry
- 4.2. PESTEL analysis
- 4.3. BCG Analysis
- 4.3.1. Stars (High Growth, High Market Share)
- 4.3.2. Cash Cows (Low Growth, High Market Share)
- 4.3.3. Question Mark (High Growth, Low Market Share)
- 4.3.4. Dogs (Low Growth, Low Market Share)
- 4.4. Ansoff Matrix Analysis
- 4.5. Supply Chain Analysis
- 4.6. Regulatory Landscape
- 4.7. Current Market Potential and Opportunity Assessment (TAM–SAM–SOM Framework)
- 4.8. DMV Analyst Note
- 4.1. Porters Five Forces
- 5. Market Analysis, Insights and Forecast 2021-2033
- 5.1. Market Analysis, Insights and Forecast - by Product Type
- 5.1.1. Stationary
- 5.1.2. Portable
- 5.2. Market Analysis, Insights and Forecast - by Technology
- 5.2.1. Analog
- 5.2.2. Digital
- 5.3. Market Analysis, Insights and Forecast - by End-user
- 5.3.1. Healthcare
- 5.3.2. Transportation and Logistics
- 5.3.3. Government
- 5.3.4. Other End-users
- 5.4. Market Analysis, Insights and Forecast - by Region
- 5.4.1. North America
- 5.4.2. Europe
- 5.4.3. Asia
- 5.4.4. Latin America
- 5.4.5. Middle East and Africa
- 5.1. Market Analysis, Insights and Forecast - by Product Type
- 6. Global X Ray Machine Manufacturing Industry Analysis, Insights and Forecast, 2021-2033
- 6.1. Market Analysis, Insights and Forecast - by Product Type
- 6.1.1. Stationary
- 6.1.2. Portable
- 6.2. Market Analysis, Insights and Forecast - by Technology
- 6.2.1. Analog
- 6.2.2. Digital
- 6.3. Market Analysis, Insights and Forecast - by End-user
- 6.3.1. Healthcare
- 6.3.2. Transportation and Logistics
- 6.3.3. Government
- 6.3.4. Other End-users
- 6.1. Market Analysis, Insights and Forecast - by Product Type
- 7. North America X Ray Machine Manufacturing Industry Analysis, Insights and Forecast, 2020-2032
- 7.1. Market Analysis, Insights and Forecast - by Product Type
- 7.1.1. Stationary
- 7.1.2. Portable
- 7.2. Market Analysis, Insights and Forecast - by Technology
- 7.2.1. Analog
- 7.2.2. Digital
- 7.3. Market Analysis, Insights and Forecast - by End-user
- 7.3.1. Healthcare
- 7.3.2. Transportation and Logistics
- 7.3.3. Government
- 7.3.4. Other End-users
- 7.1. Market Analysis, Insights and Forecast - by Product Type
- 8. Europe X Ray Machine Manufacturing Industry Analysis, Insights and Forecast, 2020-2032
- 8.1. Market Analysis, Insights and Forecast - by Product Type
- 8.1.1. Stationary
- 8.1.2. Portable
- 8.2. Market Analysis, Insights and Forecast - by Technology
- 8.2.1. Analog
- 8.2.2. Digital
- 8.3. Market Analysis, Insights and Forecast - by End-user
- 8.3.1. Healthcare
- 8.3.2. Transportation and Logistics
- 8.3.3. Government
- 8.3.4. Other End-users
- 8.1. Market Analysis, Insights and Forecast - by Product Type
- 9. Asia X Ray Machine Manufacturing Industry Analysis, Insights and Forecast, 2020-2032
- 9.1. Market Analysis, Insights and Forecast - by Product Type
- 9.1.1. Stationary
- 9.1.2. Portable
- 9.2. Market Analysis, Insights and Forecast - by Technology
- 9.2.1. Analog
- 9.2.2. Digital
- 9.3. Market Analysis, Insights and Forecast - by End-user
- 9.3.1. Healthcare
- 9.3.2. Transportation and Logistics
- 9.3.3. Government
- 9.3.4. Other End-users
- 9.1. Market Analysis, Insights and Forecast - by Product Type
- 10. Latin America X Ray Machine Manufacturing Industry Analysis, Insights and Forecast, 2020-2032
- 10.1. Market Analysis, Insights and Forecast - by Product Type
- 10.1.1. Stationary
- 10.1.2. Portable
- 10.2. Market Analysis, Insights and Forecast - by Technology
- 10.2.1. Analog
- 10.2.2. Digital
- 10.3. Market Analysis, Insights and Forecast - by End-user
- 10.3.1. Healthcare
- 10.3.2. Transportation and Logistics
- 10.3.3. Government
- 10.3.4. Other End-users
- 10.1. Market Analysis, Insights and Forecast - by Product Type
- 11. Middle East and Africa X Ray Machine Manufacturing Industry Analysis, Insights and Forecast, 2020-2032
- 11.1. Market Analysis, Insights and Forecast - by Product Type
- 11.1.1. Stationary
- 11.1.2. Portable
- 11.2. Market Analysis, Insights and Forecast - by Technology
- 11.2.1. Analog
- 11.2.2. Digital
- 11.3. Market Analysis, Insights and Forecast - by End-user
- 11.3.1. Healthcare
- 11.3.2. Transportation and Logistics
- 11.3.3. Government
- 11.3.4. Other End-users
- 11.1. Market Analysis, Insights and Forecast - by Product Type
- 12. Competitive Analysis
- 12.1. Company Profiles
- 12.1.1 Canon Inc
- 12.1.1.1. Company Overview
- 12.1.1.2. Products
- 12.1.1.3. Company Financials
- 12.1.1.4. SWOT Analysis
- 12.1.2 Hologic Inc
- 12.1.2.1. Company Overview
- 12.1.2.2. Products
- 12.1.2.3. Company Financials
- 12.1.2.4. SWOT Analysis
- 12.1.3 GE Healthcare
- 12.1.3.1. Company Overview
- 12.1.3.2. Products
- 12.1.3.3. Company Financials
- 12.1.3.4. SWOT Analysis
- 12.1.4 Siemens AG
- 12.1.4.1. Company Overview
- 12.1.4.2. Products
- 12.1.4.3. Company Financials
- 12.1.4.4. SWOT Analysis
- 12.1.5 Philips Healthcare
- 12.1.5.1. Company Overview
- 12.1.5.2. Products
- 12.1.5.3. Company Financials
- 12.1.5.4. SWOT Analysis
- 12.1.6 Hindrays
- 12.1.6.1. Company Overview
- 12.1.6.2. Products
- 12.1.6.3. Company Financials
- 12.1.6.4. SWOT Analysis
- 12.1.7 Hitachi Medical Corporation
- 12.1.7.1. Company Overview
- 12.1.7.2. Products
- 12.1.7.3. Company Financials
- 12.1.7.4. SWOT Analysis
- 12.1.8 Vision Medicaid Equipment Private Limited
- 12.1.8.1. Company Overview
- 12.1.8.2. Products
- 12.1.8.3. Company Financials
- 12.1.8.4. SWOT Analysis
- 12.1.9 Shimadzu Corporation
- 12.1.9.1. Company Overview
- 12.1.9.2. Products
- 12.1.9.3. Company Financials
- 12.1.9.4. SWOT Analysis
- 12.1.10 Fujifilm Holdings Corporation
- 12.1.10.1. Company Overview
- 12.1.10.2. Products
- 12.1.10.3. Company Financials
- 12.1.10.4. SWOT Analysis
- 12.1.1 Canon Inc
- 12.2. Market Entropy
- 12.2.1 Company's Key Areas Served
- 12.2.2 Recent Developments
- 12.3. Company Market Share Analysis 2025
- 12.3.1 Top 5 Companies Market Share Analysis
- 12.3.2 Top 3 Companies Market Share Analysis
- 12.4. List of Potential Customers
- 13. Research Methodology
List of Figures
- Figure 1: Global X Ray Machine Manufacturing Industry Revenue Breakdown (Million, %) by Region 2025 & 2033
- Figure 2: Global X Ray Machine Manufacturing Industry Volume Breakdown (K Unit, %) by Region 2025 & 2033
- Figure 3: North America X Ray Machine Manufacturing Industry Revenue (Million), by Product Type 2025 & 2033
- Figure 4: North America X Ray Machine Manufacturing Industry Volume (K Unit), by Product Type 2025 & 2033
- Figure 5: North America X Ray Machine Manufacturing Industry Revenue Share (%), by Product Type 2025 & 2033
- Figure 6: North America X Ray Machine Manufacturing Industry Volume Share (%), by Product Type 2025 & 2033
- Figure 7: North America X Ray Machine Manufacturing Industry Revenue (Million), by Technology 2025 & 2033
- Figure 8: North America X Ray Machine Manufacturing Industry Volume (K Unit), by Technology 2025 & 2033
- Figure 9: North America X Ray Machine Manufacturing Industry Revenue Share (%), by Technology 2025 & 2033
- Figure 10: North America X Ray Machine Manufacturing Industry Volume Share (%), by Technology 2025 & 2033
- Figure 11: North America X Ray Machine Manufacturing Industry Revenue (Million), by End-user 2025 & 2033
- Figure 12: North America X Ray Machine Manufacturing Industry Volume (K Unit), by End-user 2025 & 2033
- Figure 13: North America X Ray Machine Manufacturing Industry Revenue Share (%), by End-user 2025 & 2033
- Figure 14: North America X Ray Machine Manufacturing Industry Volume Share (%), by End-user 2025 & 2033
- Figure 15: North America X Ray Machine Manufacturing Industry Revenue (Million), by Country 2025 & 2033
- Figure 16: North America X Ray Machine Manufacturing Industry Volume (K Unit), by Country 2025 & 2033
- Figure 17: North America X Ray Machine Manufacturing Industry Revenue Share (%), by Country 2025 & 2033
- Figure 18: North America X Ray Machine Manufacturing Industry Volume Share (%), by Country 2025 & 2033
- Figure 19: Europe X Ray Machine Manufacturing Industry Revenue (Million), by Product Type 2025 & 2033
- Figure 20: Europe X Ray Machine Manufacturing Industry Volume (K Unit), by Product Type 2025 & 2033
- Figure 21: Europe X Ray Machine Manufacturing Industry Revenue Share (%), by Product Type 2025 & 2033
- Figure 22: Europe X Ray Machine Manufacturing Industry Volume Share (%), by Product Type 2025 & 2033
- Figure 23: Europe X Ray Machine Manufacturing Industry Revenue (Million), by Technology 2025 & 2033
- Figure 24: Europe X Ray Machine Manufacturing Industry Volume (K Unit), by Technology 2025 & 2033
- Figure 25: Europe X Ray Machine Manufacturing Industry Revenue Share (%), by Technology 2025 & 2033
- Figure 26: Europe X Ray Machine Manufacturing Industry Volume Share (%), by Technology 2025 & 2033
- Figure 27: Europe X Ray Machine Manufacturing Industry Revenue (Million), by End-user 2025 & 2033
- Figure 28: Europe X Ray Machine Manufacturing Industry Volume (K Unit), by End-user 2025 & 2033
- Figure 29: Europe X Ray Machine Manufacturing Industry Revenue Share (%), by End-user 2025 & 2033
- Figure 30: Europe X Ray Machine Manufacturing Industry Volume Share (%), by End-user 2025 & 2033
- Figure 31: Europe X Ray Machine Manufacturing Industry Revenue (Million), by Country 2025 & 2033
- Figure 32: Europe X Ray Machine Manufacturing Industry Volume (K Unit), by Country 2025 & 2033
- Figure 33: Europe X Ray Machine Manufacturing Industry Revenue Share (%), by Country 2025 & 2033
- Figure 34: Europe X Ray Machine Manufacturing Industry Volume Share (%), by Country 2025 & 2033
- Figure 35: Asia X Ray Machine Manufacturing Industry Revenue (Million), by Product Type 2025 & 2033
- Figure 36: Asia X Ray Machine Manufacturing Industry Volume (K Unit), by Product Type 2025 & 2033
- Figure 37: Asia X Ray Machine Manufacturing Industry Revenue Share (%), by Product Type 2025 & 2033
- Figure 38: Asia X Ray Machine Manufacturing Industry Volume Share (%), by Product Type 2025 & 2033
- Figure 39: Asia X Ray Machine Manufacturing Industry Revenue (Million), by Technology 2025 & 2033
- Figure 40: Asia X Ray Machine Manufacturing Industry Volume (K Unit), by Technology 2025 & 2033
- Figure 41: Asia X Ray Machine Manufacturing Industry Revenue Share (%), by Technology 2025 & 2033
- Figure 42: Asia X Ray Machine Manufacturing Industry Volume Share (%), by Technology 2025 & 2033
- Figure 43: Asia X Ray Machine Manufacturing Industry Revenue (Million), by End-user 2025 & 2033
- Figure 44: Asia X Ray Machine Manufacturing Industry Volume (K Unit), by End-user 2025 & 2033
- Figure 45: Asia X Ray Machine Manufacturing Industry Revenue Share (%), by End-user 2025 & 2033
- Figure 46: Asia X Ray Machine Manufacturing Industry Volume Share (%), by End-user 2025 & 2033
- Figure 47: Asia X Ray Machine Manufacturing Industry Revenue (Million), by Country 2025 & 2033
- Figure 48: Asia X Ray Machine Manufacturing Industry Volume (K Unit), by Country 2025 & 2033
- Figure 49: Asia X Ray Machine Manufacturing Industry Revenue Share (%), by Country 2025 & 2033
- Figure 50: Asia X Ray Machine Manufacturing Industry Volume Share (%), by Country 2025 & 2033
- Figure 51: Latin America X Ray Machine Manufacturing Industry Revenue (Million), by Product Type 2025 & 2033
- Figure 52: Latin America X Ray Machine Manufacturing Industry Volume (K Unit), by Product Type 2025 & 2033
- Figure 53: Latin America X Ray Machine Manufacturing Industry Revenue Share (%), by Product Type 2025 & 2033
- Figure 54: Latin America X Ray Machine Manufacturing Industry Volume Share (%), by Product Type 2025 & 2033
- Figure 55: Latin America X Ray Machine Manufacturing Industry Revenue (Million), by Technology 2025 & 2033
- Figure 56: Latin America X Ray Machine Manufacturing Industry Volume (K Unit), by Technology 2025 & 2033
- Figure 57: Latin America X Ray Machine Manufacturing Industry Revenue Share (%), by Technology 2025 & 2033
- Figure 58: Latin America X Ray Machine Manufacturing Industry Volume Share (%), by Technology 2025 & 2033
- Figure 59: Latin America X Ray Machine Manufacturing Industry Revenue (Million), by End-user 2025 & 2033
- Figure 60: Latin America X Ray Machine Manufacturing Industry Volume (K Unit), by End-user 2025 & 2033
- Figure 61: Latin America X Ray Machine Manufacturing Industry Revenue Share (%), by End-user 2025 & 2033
- Figure 62: Latin America X Ray Machine Manufacturing Industry Volume Share (%), by End-user 2025 & 2033
- Figure 63: Latin America X Ray Machine Manufacturing Industry Revenue (Million), by Country 2025 & 2033
- Figure 64: Latin America X Ray Machine Manufacturing Industry Volume (K Unit), by Country 2025 & 2033
- Figure 65: Latin America X Ray Machine Manufacturing Industry Revenue Share (%), by Country 2025 & 2033
- Figure 66: Latin America X Ray Machine Manufacturing Industry Volume Share (%), by Country 2025 & 2033
- Figure 67: Middle East and Africa X Ray Machine Manufacturing Industry Revenue (Million), by Product Type 2025 & 2033
- Figure 68: Middle East and Africa X Ray Machine Manufacturing Industry Volume (K Unit), by Product Type 2025 & 2033
- Figure 69: Middle East and Africa X Ray Machine Manufacturing Industry Revenue Share (%), by Product Type 2025 & 2033
- Figure 70: Middle East and Africa X Ray Machine Manufacturing Industry Volume Share (%), by Product Type 2025 & 2033
- Figure 71: Middle East and Africa X Ray Machine Manufacturing Industry Revenue (Million), by Technology 2025 & 2033
- Figure 72: Middle East and Africa X Ray Machine Manufacturing Industry Volume (K Unit), by Technology 2025 & 2033
- Figure 73: Middle East and Africa X Ray Machine Manufacturing Industry Revenue Share (%), by Technology 2025 & 2033
- Figure 74: Middle East and Africa X Ray Machine Manufacturing Industry Volume Share (%), by Technology 2025 & 2033
- Figure 75: Middle East and Africa X Ray Machine Manufacturing Industry Revenue (Million), by End-user 2025 & 2033
- Figure 76: Middle East and Africa X Ray Machine Manufacturing Industry Volume (K Unit), by End-user 2025 & 2033
- Figure 77: Middle East and Africa X Ray Machine Manufacturing Industry Revenue Share (%), by End-user 2025 & 2033
- Figure 78: Middle East and Africa X Ray Machine Manufacturing Industry Volume Share (%), by End-user 2025 & 2033
- Figure 79: Middle East and Africa X Ray Machine Manufacturing Industry Revenue (Million), by Country 2025 & 2033
- Figure 80: Middle East and Africa X Ray Machine Manufacturing Industry Volume (K Unit), by Country 2025 & 2033
- Figure 81: Middle East and Africa X Ray Machine Manufacturing Industry Revenue Share (%), by Country 2025 & 2033
- Figure 82: Middle East and Africa X Ray Machine Manufacturing Industry Volume Share (%), by Country 2025 & 2033
List of Tables
- Table 1: Global X Ray Machine Manufacturing Industry Revenue Million Forecast, by Product Type 2020 & 2033
- Table 2: Global X Ray Machine Manufacturing Industry Volume K Unit Forecast, by Product Type 2020 & 2033
- Table 3: Global X Ray Machine Manufacturing Industry Revenue Million Forecast, by Technology 2020 & 2033
- Table 4: Global X Ray Machine Manufacturing Industry Volume K Unit Forecast, by Technology 2020 & 2033
- Table 5: Global X Ray Machine Manufacturing Industry Revenue Million Forecast, by End-user 2020 & 2033
- Table 6: Global X Ray Machine Manufacturing Industry Volume K Unit Forecast, by End-user 2020 & 2033
- Table 7: Global X Ray Machine Manufacturing Industry Revenue Million Forecast, by Region 2020 & 2033
- Table 8: Global X Ray Machine Manufacturing Industry Volume K Unit Forecast, by Region 2020 & 2033
- Table 9: Global X Ray Machine Manufacturing Industry Revenue Million Forecast, by Product Type 2020 & 2033
- Table 10: Global X Ray Machine Manufacturing Industry Volume K Unit Forecast, by Product Type 2020 & 2033
- Table 11: Global X Ray Machine Manufacturing Industry Revenue Million Forecast, by Technology 2020 & 2033
- Table 12: Global X Ray Machine Manufacturing Industry Volume K Unit Forecast, by Technology 2020 & 2033
- Table 13: Global X Ray Machine Manufacturing Industry Revenue Million Forecast, by End-user 2020 & 2033
- Table 14: Global X Ray Machine Manufacturing Industry Volume K Unit Forecast, by End-user 2020 & 2033
- Table 15: Global X Ray Machine Manufacturing Industry Revenue Million Forecast, by Country 2020 & 2033
- Table 16: Global X Ray Machine Manufacturing Industry Volume K Unit Forecast, by Country 2020 & 2033
- Table 17: United States X Ray Machine Manufacturing Industry Revenue (Million) Forecast, by Application 2020 & 2033
- Table 18: United States X Ray Machine Manufacturing Industry Volume (K Unit) Forecast, by Application 2020 & 2033
- Table 19: Canada X Ray Machine Manufacturing Industry Revenue (Million) Forecast, by Application 2020 & 2033
- Table 20: Canada X Ray Machine Manufacturing Industry Volume (K Unit) Forecast, by Application 2020 & 2033
- Table 21: Global X Ray Machine Manufacturing Industry Revenue Million Forecast, by Product Type 2020 & 2033
- Table 22: Global X Ray Machine Manufacturing Industry Volume K Unit Forecast, by Product Type 2020 & 2033
- Table 23: Global X Ray Machine Manufacturing Industry Revenue Million Forecast, by Technology 2020 & 2033
- Table 24: Global X Ray Machine Manufacturing Industry Volume K Unit Forecast, by Technology 2020 & 2033
- Table 25: Global X Ray Machine Manufacturing Industry Revenue Million Forecast, by End-user 2020 & 2033
- Table 26: Global X Ray Machine Manufacturing Industry Volume K Unit Forecast, by End-user 2020 & 2033
- Table 27: Global X Ray Machine Manufacturing Industry Revenue Million Forecast, by Country 2020 & 2033
- Table 28: Global X Ray Machine Manufacturing Industry Volume K Unit Forecast, by Country 2020 & 2033
- Table 29: United Kingdom X Ray Machine Manufacturing Industry Revenue (Million) Forecast, by Application 2020 & 2033
- Table 30: United Kingdom X Ray Machine Manufacturing Industry Volume (K Unit) Forecast, by Application 2020 & 2033
- Table 31: Germany X Ray Machine Manufacturing Industry Revenue (Million) Forecast, by Application 2020 & 2033
- Table 32: Germany X Ray Machine Manufacturing Industry Volume (K Unit) Forecast, by Application 2020 & 2033
- Table 33: France X Ray Machine Manufacturing Industry Revenue (Million) Forecast, by Application 2020 & 2033
- Table 34: France X Ray Machine Manufacturing Industry Volume (K Unit) Forecast, by Application 2020 & 2033
- Table 35: Global X Ray Machine Manufacturing Industry Revenue Million Forecast, by Product Type 2020 & 2033
- Table 36: Global X Ray Machine Manufacturing Industry Volume K Unit Forecast, by Product Type 2020 & 2033
- Table 37: Global X Ray Machine Manufacturing Industry Revenue Million Forecast, by Technology 2020 & 2033
- Table 38: Global X Ray Machine Manufacturing Industry Volume K Unit Forecast, by Technology 2020 & 2033
- Table 39: Global X Ray Machine Manufacturing Industry Revenue Million Forecast, by End-user 2020 & 2033
- Table 40: Global X Ray Machine Manufacturing Industry Volume K Unit Forecast, by End-user 2020 & 2033
- Table 41: Global X Ray Machine Manufacturing Industry Revenue Million Forecast, by Country 2020 & 2033
- Table 42: Global X Ray Machine Manufacturing Industry Volume K Unit Forecast, by Country 2020 & 2033
- Table 43: China X Ray Machine Manufacturing Industry Revenue (Million) Forecast, by Application 2020 & 2033
- Table 44: China X Ray Machine Manufacturing Industry Volume (K Unit) Forecast, by Application 2020 & 2033
- Table 45: Japan X Ray Machine Manufacturing Industry Revenue (Million) Forecast, by Application 2020 & 2033
- Table 46: Japan X Ray Machine Manufacturing Industry Volume (K Unit) Forecast, by Application 2020 & 2033
- Table 47: India X Ray Machine Manufacturing Industry Revenue (Million) Forecast, by Application 2020 & 2033
- Table 48: India X Ray Machine Manufacturing Industry Volume (K Unit) Forecast, by Application 2020 & 2033
- Table 49: South Korea X Ray Machine Manufacturing Industry Revenue (Million) Forecast, by Application 2020 & 2033
- Table 50: South Korea X Ray Machine Manufacturing Industry Volume (K Unit) Forecast, by Application 2020 & 2033
- Table 51: Global X Ray Machine Manufacturing Industry Revenue Million Forecast, by Product Type 2020 & 2033
- Table 52: Global X Ray Machine Manufacturing Industry Volume K Unit Forecast, by Product Type 2020 & 2033
- Table 53: Global X Ray Machine Manufacturing Industry Revenue Million Forecast, by Technology 2020 & 2033
- Table 54: Global X Ray Machine Manufacturing Industry Volume K Unit Forecast, by Technology 2020 & 2033
- Table 55: Global X Ray Machine Manufacturing Industry Revenue Million Forecast, by End-user 2020 & 2033
- Table 56: Global X Ray Machine Manufacturing Industry Volume K Unit Forecast, by End-user 2020 & 2033
- Table 57: Global X Ray Machine Manufacturing Industry Revenue Million Forecast, by Country 2020 & 2033
- Table 58: Global X Ray Machine Manufacturing Industry Volume K Unit Forecast, by Country 2020 & 2033
- Table 59: Global X Ray Machine Manufacturing Industry Revenue Million Forecast, by Product Type 2020 & 2033
- Table 60: Global X Ray Machine Manufacturing Industry Volume K Unit Forecast, by Product Type 2020 & 2033
- Table 61: Global X Ray Machine Manufacturing Industry Revenue Million Forecast, by Technology 2020 & 2033
- Table 62: Global X Ray Machine Manufacturing Industry Volume K Unit Forecast, by Technology 2020 & 2033
- Table 63: Global X Ray Machine Manufacturing Industry Revenue Million Forecast, by End-user 2020 & 2033
- Table 64: Global X Ray Machine Manufacturing Industry Volume K Unit Forecast, by End-user 2020 & 2033
- Table 65: Global X Ray Machine Manufacturing Industry Revenue Million Forecast, by Country 2020 & 2033
- Table 66: Global X Ray Machine Manufacturing Industry Volume K Unit Forecast, by Country 2020 & 2033
Frequently Asked Questions
1. What is the projected Compound Annual Growth Rate (CAGR) of the X Ray Machine Manufacturing Industry?
The projected CAGR is approximately 5.69%.
2. Which companies are prominent players in the X Ray Machine Manufacturing Industry?
Key companies in the market include Canon Inc, Hologic Inc, GE Healthcare, Siemens AG, Philips Healthcare, Hindrays, Hitachi Medical Corporation, Vision Medicaid Equipment Private Limited, Shimadzu Corporation, Fujifilm Holdings Corporation.
3. What are the main segments of the X Ray Machine Manufacturing Industry?
The market segments include Product Type, Technology, End-user.
4. Can you provide details about the market size?
The market size is estimated to be USD 17.70 Million as of 2022.
5. What are some drivers contributing to market growth?
Rise in Adoption of Digital X-ray Systems; Government Regulations and Investments to Improve Infrastructure.
6. What are the notable trends driving market growth?
Healthcare Sector is Expected to Hold a Significant Market Share.
7. Are there any restraints impacting market growth?
High Cost of the Equipment.
8. Can you provide examples of recent developments in the market?
November 2022: Konica Minolta Healthcare Americas, Inc., a global leader in medical diagnostic imaging and healthcare information technology, introduced groundbreaking digital radiography (DR) technologies designed to revolutionize the clinical utility of X-rays.
9. What pricing options are available for accessing the report?
Pricing options include single-user, multi-user, and enterprise licenses priced at USD 4750, USD 5250, and USD 8750 respectively.
10. Is the market size provided in terms of value or volume?
The market size is provided in terms of value, measured in Million and volume, measured in K Unit.
11. Are there any specific market keywords associated with the report?
Yes, the market keyword associated with the report is "X Ray Machine Manufacturing Industry," which aids in identifying and referencing the specific market segment covered.
12. How do I determine which pricing option suits my needs best?
The pricing options vary based on user requirements and access needs. Individual users may opt for single-user licenses, while businesses requiring broader access may choose multi-user or enterprise licenses for cost-effective access to the report.
13. Are there any additional resources or data provided in the X Ray Machine Manufacturing Industry report?
While the report offers comprehensive insights, it's advisable to review the specific contents or supplementary materials provided to ascertain if additional resources or data are available.
14. How can I stay updated on further developments or reports in the X Ray Machine Manufacturing Industry?
To stay informed about further developments, trends, and reports in the X Ray Machine Manufacturing Industry, consider subscribing to industry newsletters, following relevant companies and organizations, or regularly checking reputable industry news sources and publications.
Methodology
Step 1 - Identification of Relevant Samples Size from Population Database


Step 2 - Approaches for Defining Global Market Size (Value, Volume* & Price*)

Note*: In applicable scenarios
Step 3 - Data Sources
Primary Research
- Web Analytics
- Survey Reports
- Research Institute
- Latest Research Reports
- Opinion Leaders
Secondary Research
- Annual Reports
- White Paper
- Latest Press Release
- Industry Association
- Paid Database
- Investor Presentations

Step 4 - Data Triangulation
Involves using different sources of information in order to increase the validity of a study
These sources are likely to be stakeholders in a program - participants, other researchers, program staff, other community members, and so on.
Then we put all data in single framework & apply various statistical tools to find out the dynamic on the market.
During the analysis stage, feedback from the stakeholder groups would be compared to determine areas of agreement as well as areas of divergence