

Key Insights
The Spark Plasma Sintering (SPS) market is projected for significant expansion, driven by its advanced material processing capabilities. The market is valued at $0.89 billion in the base year 2025 and is expected to grow at a Compound Annual Growth Rate (CAGR) of 7.5% through 2033. This robust growth is fueled by increasing demand for advanced materials with superior mechanical, thermal, and electrical properties in high-performance sectors. Key industries driving adoption include Automotive (lightweight components, EV batteries), Manufacturing (rapid prototyping, complex parts), Energy & Power (renewable energy systems, high-temperature applications), and Aerospace & Defense (exotic alloys, ceramics). Emerging applications in medical devices and electronics further enhance market potential.
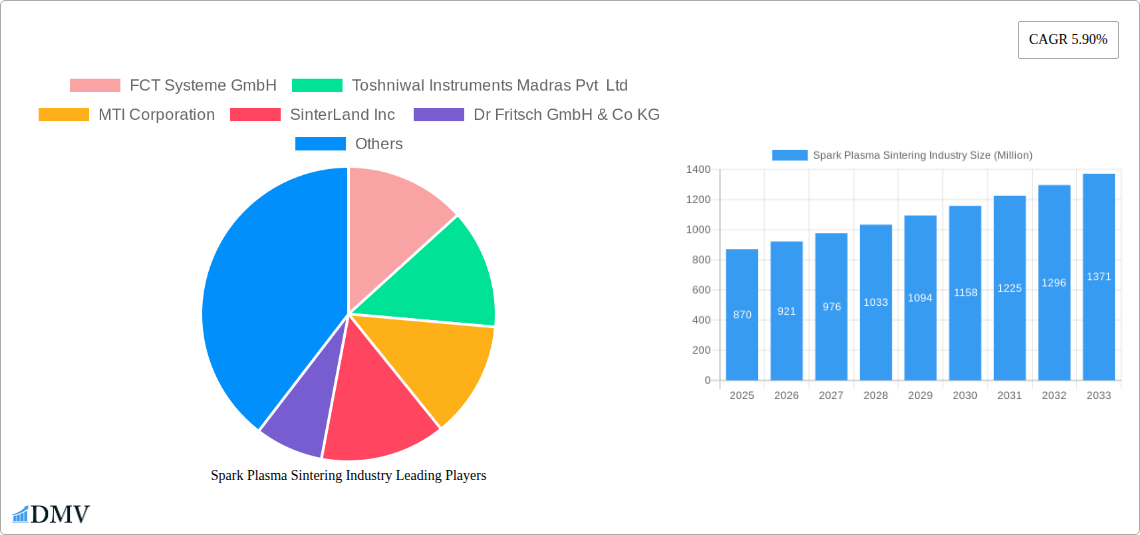
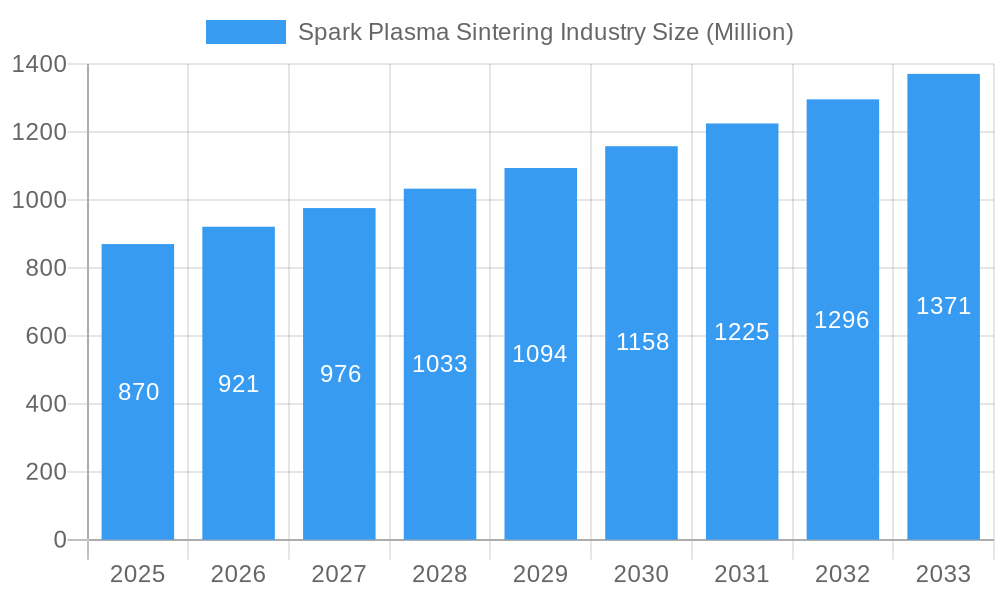
Spark Plasma Sintering Industry Market Size (In Million)
The competitive landscape includes established leaders and innovative entrants, fostering technological advancement. Prominent companies such as FCT Systeme GmbH, Thermal Technology LLC, and Dr. Fritsch GmbH & Co KG are leading the market with advanced SPS equipment. Market dynamics are influenced by material science innovations, including new powder and composite development for SPS. Initial investment costs and the need for specialized expertise present challenges. However, SPS's advantages—reduced processing time, lower temperatures, and broad material consolidation—ensure its growing indispensability in advanced manufacturing. The Asia Pacific region is anticipated to experience the most rapid growth due to industrialization and increased R&D investments.
Spark Plasma Sintering Industry Company Market Share
Spark Plasma Sintering Industry Market Composition & Trends
The global Spark Plasma Sintering (SPS) industry is experiencing robust growth, driven by an insatiable demand for advanced materials across high-tech sectors. Market concentration is moderately fragmented, with a few key players holding significant influence, while a growing number of innovators are contributing to technological advancements. Regulatory landscapes are generally supportive, particularly concerning the development of materials for aerospace and defense applications, although stringent environmental standards are also shaping production processes. Substitute products, such as conventional sintering methods, are increasingly being outperformed by SPS in terms of speed, energy efficiency, and material property enhancement. End-user profiles are diverse, spanning from the automotive sector seeking lighter and stronger components to the energy sector demanding high-performance materials for energy storage and generation. Mergers and acquisitions (M&A) are a growing trend, with recent deal values estimated in the hundreds of millions, signaling consolidation and strategic partnerships aimed at expanding market reach and technological capabilities. The market share distribution remains dynamic, with leaders constantly vying for dominance through innovation and strategic alliances. XXX
Spark Plasma Sintering Industry Industry Evolution
The Spark Plasma Sintering (SPS) industry has undergone a significant evolutionary path, transitioning from a niche research tool to a vital manufacturing technology. Over the historical period of 2019–2024, the market witnessed consistent, albeit moderate, expansion, fueled by increasing awareness of SPS's unique capabilities in rapid material consolidation and the production of dense, high-performance components. The base year of 2025 marks a pivotal point, with projected market growth anticipated to accelerate significantly throughout the forecast period of 2025–2033. This acceleration is intrinsically linked to ongoing technological advancements. Researchers and manufacturers are continuously refining SPS equipment, leading to larger chamber capacities, enhanced process control, and the ability to handle an even wider array of materials.
Crucially, shifting consumer demands play a substantial role in this evolution. Industries like automotive are actively seeking lightweight, durable materials for fuel efficiency and electric vehicle battery components, areas where SPS excels. Similarly, the aerospace sector’s need for materials that can withstand extreme temperatures and pressures, while maintaining structural integrity, makes SPS an indispensable technology. The adoption metrics for SPS are steadily rising, with a growing number of research institutions and industrial facilities investing in this advanced manufacturing process. Growth rates are projected to range from 12% to 18% annually during the forecast period, with specific segments like additive manufacturing powder production and advanced ceramic fabrication showing even higher adoption. The ability of SPS to produce complex geometries and achieve full density in materials that are otherwise difficult to consolidate, such as refractory metals and advanced composites, further solidifies its evolutionary trajectory and market relevance. The development of more compact and cost-effective SPS systems is also democratizing access to this technology, broadening its application base beyond large-scale industrial players to smaller enterprises and research labs. This continuous cycle of innovation and market adoption is propelling the SPS industry into a new era of material processing.
Leading Regions, Countries, or Segments in Spark Plasma Sintering Industry
The Spark Plasma Sintering (SPS) industry's dominance is remarkably distributed across several key regions and segments, each contributing significantly to its global trajectory. However, when considering both technological development and market adoption, North America and Europe emerge as leading regions.
- North America: This region benefits from a robust ecosystem of research institutions, government funding for advanced materials, and a strong presence of key end-user industries like aerospace and defense.
- Investment Trends: Significant investment in R&D for next-generation materials, particularly for defense applications and advanced manufacturing.
- Regulatory Support: Government initiatives and funding for materials science research, fostering innovation and adoption of cutting-edge technologies like SPS.
- End-User Demand: High demand from the aerospace and defense sectors for high-performance components, driving the adoption of SPS for critical applications.
- Europe: With a strong manufacturing base and a focus on sustainable and high-performance materials, Europe is a powerhouse in the SPS market. Countries like Germany and the UK are at the forefront.
- Technological Advancement: Leading universities and research centers are pushing the boundaries of SPS technology, developing novel applications and processing techniques.
- Industry Concentration: A significant concentration of companies specializing in advanced ceramics and specialty metals, which are prime candidates for SPS processing.
- Automotive Sector Influence: The strong European automotive industry, with its increasing focus on lightweighting and electrification, is a major driver for SPS adoption.
Among the end-user applications, Aerospace & Defense and Manufacturing are currently the most dominant segments, driven by the stringent material requirements and the need for high-performance, reliable components.
- Aerospace & Defense: This sector demands materials with exceptional mechanical properties, high-temperature resistance, and reduced weight. SPS is crucial for producing components like turbine blades, engine parts, and armor plating, where conventional methods fall short. The ability to sinter complex alloys and ceramics with superior microstructures makes SPS indispensable for meeting the rigorous standards of this industry. Investment in this segment is consistently high, reflecting the critical nature of the applications.
- Manufacturing: Broadly encompassing industries that require advanced materials for tools, dies, and specialized components. The automotive industry, in particular, is a significant consumer, utilizing SPS for producing lightweight structural parts, battery components for electric vehicles, and wear-resistant tooling. The efficiency and speed of SPS in creating dense, high-quality parts translate into cost savings and improved product performance in various manufacturing applications.
While Energy & Power is a rapidly growing segment, particularly for materials in nuclear energy and advanced battery technologies, and Automotive is increasingly adopting SPS for lightweighting and EV components, the foundational demand from Aerospace & Defense and the broader Manufacturing sector currently positions them as the leading segments in terms of market volume and technological integration.
Spark Plasma Sintering Industry Product Innovations
Spark Plasma Sintering (SPS) technology is continuously evolving with innovative product developments. Manufacturers are introducing advanced SPS systems with larger chamber sizes capable of handling larger workpieces, thereby expanding the application scope for bulk material production. Innovations include enhanced automation and AI-driven process control for improved repeatability and efficiency, along with the integration of advanced sensing technologies to monitor sintering in real-time. New machine designs are focusing on energy efficiency and reduced footprint, making SPS more accessible and cost-effective. These advancements enable the fabrication of novel materials with superior properties, such as ultra-hard ceramics, high-performance metal alloys, and functional composites for demanding applications.
Propelling Factors for Spark Plasma Sintering Industry Growth
The Spark Plasma Sintering (SPS) industry's growth is propelled by several key factors. Technologically, the inherent advantages of SPS—rapid sintering, lower processing temperatures, and the ability to achieve full density in complex materials—are driving adoption. Economically, the demand for advanced, lightweight, and high-performance materials across sectors like automotive, aerospace, and energy, where material costs are secondary to performance and reliability, significantly boosts the market. Regulatory influences, particularly in defense and aerospace, that mandate superior material specifications, further encourage the adoption of SPS for its ability to meet these stringent requirements.
Obstacles in the Spark Plasma Sintering Industry Market
Despite its promising growth, the Spark Plasma Sintering (SPS) industry faces certain obstacles. High initial capital investment for SPS equipment can be a significant barrier, especially for smaller enterprises. The complexity of operating and optimizing SPS processes requires specialized expertise, leading to a talent gap. Furthermore, while the technology itself is advanced, the supply chain for specialized precursor materials needed for some SPS applications can be constrained. Regulatory hurdles related to the disposal of certain processed materials and the need for comprehensive safety protocols can also pose challenges.
Future Opportunities in Spark Plasma Sintering Industry
The future of the Spark Plasma Sintering (SPS) industry is ripe with opportunities. The burgeoning field of additive manufacturing presents a significant opportunity, as SPS can be used to consolidate and densify additively manufactured parts, overcoming some of their inherent limitations. Emerging markets in renewable energy, particularly for advanced battery materials and fuel cell components, offer vast potential. The development of more portable and modular SPS systems could open up new on-site manufacturing possibilities. Continued research into novel material combinations and applications in areas like biomedical implants and advanced electronics will further fuel market expansion.
Major Players in the Spark Plasma Sintering Industry Ecosystem
- GeniCore
- Retech Systems, LLC
- Fuji Electronic Ind. Co.
- KAN-THT India Pvt Ltd,
- Shenyang Kejing
- Norimat
- Kompass International
- Others
Key Developments in Spark Plasma Sintering Industry Industry
- June 2022: The national spark plasma sintering (SPS) facility was established at the Department of Materials and Environmental Chemistry at Stockholm University.
- Impact: This development significantly enhances research capabilities in SPS, allowing for rapid sintering cycles in vacuum or inert atmospheres. The facility's ability to handle diverse materials, including ceramics, metals, alloys, intermetallics, composites, and porous materials, and to produce both small and large sintered components, including air-sensitive materials, is a substantial step forward for material science innovation and accessibility.
Strategic Spark Plasma Sintering Industry Market Forecast
The strategic Spark Plasma Sintering (SPS) industry market forecast indicates a period of sustained and accelerated growth. Future opportunities in emerging fields like additive manufacturing, renewable energy, and biomedical applications will serve as significant growth catalysts. The ongoing advancements in SPS technology, leading to more efficient, cost-effective, and versatile systems, will further broaden its adoption across existing and new market segments. The increasing demand for high-performance materials that offer superior strength, thermal resistance, and reduced weight will continue to drive innovation and investment. The global market is projected to expand considerably, fueled by a convergence of technological breakthroughs, evolving industry needs, and expanding research frontiers, solidifying SPS as a critical technology for advanced material processing.
Spark Plasma Sintering Industry Segmentation
- By Product Type
- Lab-Scale/Research Systems
- Pilot-Scale/Prototyping Systems
- Industrial/Production Systems
- By Material Processed
- Metals
- Cermaics
- Oxides
- Carbies
- Nitrides
- Borides
- Flourides
- Cermets
- Intermetalic Compounds
- Others
- By Process Capacity
- Small Batch
- Medium Batch
- Large Batch
- By Price Range
- Entry-Level
- Mid-Range
- High-End
- By Sales Channel
- Direct Sales
- Distributors and Wholesalers
- Online
- By End User Industry
- Aerospace & Defense
- Automotive
- Healthcare & Medical Devices
- Electronics & Semiconductor
- Energy & Power
- Others
Spark Plasma Sintering Industry Segmentation By Geography
- 1. North America
- 2. Europe
- 3. Asia Pacific
- 4. Latin America
- 5. Middle East and Africa
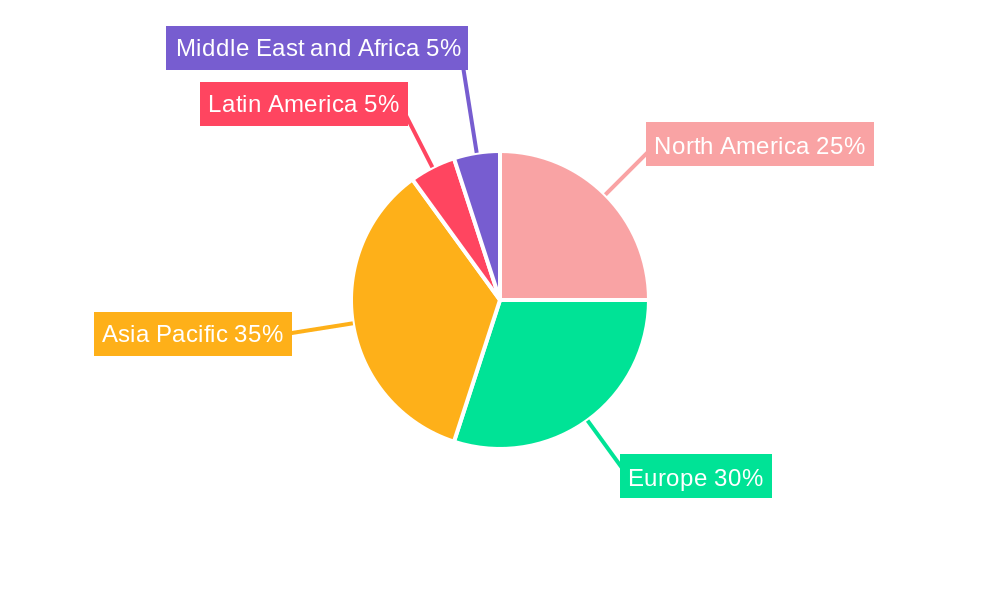
Spark Plasma Sintering Industry Regional Market Share
Geographic Coverage of Spark Plasma Sintering Industry
Spark Plasma Sintering Industry REPORT HIGHLIGHTS
| Aspects | Details |
|---|---|
| Study Period | 2020-2034 |
| Base Year | 2025 |
| Estimated Year | 2026 |
| Forecast Period | 2026-2034 |
| Historical Period | 2020-2025 |
| Growth Rate | CAGR of 7.5% from 2020-2034 |
| Segmentation |
|
Table of Contents
- 1. Introduction
- 1.1. Research Scope
- 1.2. Market Segmentation
- 1.3. Research Objective
- 1.4. Definitions and Assumptions
- 2. Executive Summary
- 2.1. Market Snapshot
- 3. Market Dynamics
- 3.1. Market Drivers
- 3.2. Market Restrains
- 3.3. Market Trends
- 3.4. Market Opportunities
- 4. Market Factor Analysis
- 4.1. Porters Five Forces
- 4.1.1. Bargaining Power of Suppliers
- 4.1.2. Bargaining Power of Buyers
- 4.1.3. Threat of New Entrants
- 4.1.4. Threat of Substitutes
- 4.1.5. Competitive Rivalry
- 4.2. PESTEL analysis
- 4.3. BCG Analysis
- 4.3.1. Stars (High Growth, High Market Share)
- 4.3.2. Cash Cows (Low Growth, High Market Share)
- 4.3.3. Question Mark (High Growth, Low Market Share)
- 4.3.4. Dogs (Low Growth, Low Market Share)
- 4.4. Ansoff Matrix Analysis
- 4.5. Supply Chain Analysis
- 4.6. Regulatory Landscape
- 4.7. Current Market Potential and Opportunity Assessment (TAM–SAM–SOM Framework)
- 4.8. DMV Analyst Note
- 4.1. Porters Five Forces
- 5. Market Analysis, Insights and Forecast 2021-2033
- 5.1. Market Analysis, Insights and Forecast - by Product Type
- 5.1.1. Lab-Scale/Research Systems
- 5.1.2. Pilot-Scale/Prototyping Systems
- 5.1.3. Industrial/Production Systems
- 5.2. Market Analysis, Insights and Forecast - by Material Processed
- 5.2.1. Metals
- 5.2.2. Cermaics
- 5.2.2.1. Oxides
- 5.2.2.2. Carbies
- 5.2.2.3. Nitrides
- 5.2.2.4. Borides
- 5.2.2.5. Flourides
- 5.2.2.6. Cermets
- 5.2.3. Intermetalic Compounds
- 5.2.4. Others
- 5.3. Market Analysis, Insights and Forecast - by Process Capacity
- 5.3.1. Small Batch
- 5.3.2. Large BatchEntry-Level
- 5.4. Market Analysis, Insights and Forecast - by Price Range
- 5.4.1. Entry-Level
- 5.4.2. Mid-Range
- 5.4.3. High-End
- 5.5. Market Analysis, Insights and Forecast - by Sales Channel
- 5.5.1. Direct Sales
- 5.5.2. Distributors and Wholesalers
- 5.5.3. Online
- 5.6. Market Analysis, Insights and Forecast - by End User Industry
- 5.6.1. Aerospace & Defense
- 5.6.2. Automotive
- 5.6.3. Healthcare & Medical Devices
- 5.6.4. Electronics & Semiconductor
- 5.6.5. Energy & Power
- 5.6.6. Others
- 5.7. Market Analysis, Insights and Forecast - by Region
- 5.7.1. North America
- 5.7.2. Europe
- 5.7.3. Asia Pacific
- 5.7.4. Latin America
- 5.7.5. Middle East and Africa
- 5.1. Market Analysis, Insights and Forecast - by Product Type
- 6. Global Spark Plasma Sintering Industry Analysis, Insights and Forecast, 2021-2033
- 6.1. Market Analysis, Insights and Forecast - by Product Type
- 6.1.1. Lab-Scale/Research Systems
- 6.1.2. Pilot-Scale/Prototyping Systems
- 6.1.3. Industrial/Production Systems
- 6.2. Market Analysis, Insights and Forecast - by Material Processed
- 6.2.1. Metals
- 6.2.2. Cermaics
- 6.2.2.1. Oxides
- 6.2.2.2. Carbies
- 6.2.2.3. Nitrides
- 6.2.2.4. Borides
- 6.2.2.5. Flourides
- 6.2.2.6. Cermets
- 6.2.3. Intermetalic Compounds
- 6.2.4. Others
- 6.3. Market Analysis, Insights and Forecast - by Process Capacity
- 6.3.1. Small Batch
- 6.3.2. Large BatchEntry-Level
- 6.4. Market Analysis, Insights and Forecast - by Price Range
- 6.4.1. Entry-Level
- 6.4.2. Mid-Range
- 6.4.3. High-End
- 6.5. Market Analysis, Insights and Forecast - by Sales Channel
- 6.5.1. Direct Sales
- 6.5.2. Distributors and Wholesalers
- 6.5.3. Online
- 6.6. Market Analysis, Insights and Forecast - by End User Industry
- 6.6.1. Aerospace & Defense
- 6.6.2. Automotive
- 6.6.3. Healthcare & Medical Devices
- 6.6.4. Electronics & Semiconductor
- 6.6.5. Energy & Power
- 6.6.6. Others
- 6.1. Market Analysis, Insights and Forecast - by Product Type
- 7. North America Spark Plasma Sintering Industry Analysis, Insights and Forecast, 2020-2032
- 7.1. Market Analysis, Insights and Forecast - by Product Type
- 7.1.1. Lab-Scale/Research Systems
- 7.1.2. Pilot-Scale/Prototyping Systems
- 7.1.3. Industrial/Production Systems
- 7.2. Market Analysis, Insights and Forecast - by Material Processed
- 7.2.1. Metals
- 7.2.2. Cermaics
- 7.2.2.1. Oxides
- 7.2.2.2. Carbies
- 7.2.2.3. Nitrides
- 7.2.2.4. Borides
- 7.2.2.5. Flourides
- 7.2.2.6. Cermets
- 7.2.3. Intermetalic Compounds
- 7.2.4. Others
- 7.3. Market Analysis, Insights and Forecast - by Process Capacity
- 7.3.1. Small Batch
- 7.3.2. Large BatchEntry-Level
- 7.4. Market Analysis, Insights and Forecast - by Price Range
- 7.4.1. Entry-Level
- 7.4.2. Mid-Range
- 7.4.3. High-End
- 7.5. Market Analysis, Insights and Forecast - by Sales Channel
- 7.5.1. Direct Sales
- 7.5.2. Distributors and Wholesalers
- 7.5.3. Online
- 7.6. Market Analysis, Insights and Forecast - by End User Industry
- 7.6.1. Aerospace & Defense
- 7.6.2. Automotive
- 7.6.3. Healthcare & Medical Devices
- 7.6.4. Electronics & Semiconductor
- 7.6.5. Energy & Power
- 7.6.6. Others
- 7.1. Market Analysis, Insights and Forecast - by Product Type
- 8. Europe Spark Plasma Sintering Industry Analysis, Insights and Forecast, 2020-2032
- 8.1. Market Analysis, Insights and Forecast - by Product Type
- 8.1.1. Lab-Scale/Research Systems
- 8.1.2. Pilot-Scale/Prototyping Systems
- 8.1.3. Industrial/Production Systems
- 8.2. Market Analysis, Insights and Forecast - by Material Processed
- 8.2.1. Metals
- 8.2.2. Cermaics
- 8.2.2.1. Oxides
- 8.2.2.2. Carbies
- 8.2.2.3. Nitrides
- 8.2.2.4. Borides
- 8.2.2.5. Flourides
- 8.2.2.6. Cermets
- 8.2.3. Intermetalic Compounds
- 8.2.4. Others
- 8.3. Market Analysis, Insights and Forecast - by Process Capacity
- 8.3.1. Small Batch
- 8.3.2. Large BatchEntry-Level
- 8.4. Market Analysis, Insights and Forecast - by Price Range
- 8.4.1. Entry-Level
- 8.4.2. Mid-Range
- 8.4.3. High-End
- 8.5. Market Analysis, Insights and Forecast - by Sales Channel
- 8.5.1. Direct Sales
- 8.5.2. Distributors and Wholesalers
- 8.5.3. Online
- 8.6. Market Analysis, Insights and Forecast - by End User Industry
- 8.6.1. Aerospace & Defense
- 8.6.2. Automotive
- 8.6.3. Healthcare & Medical Devices
- 8.6.4. Electronics & Semiconductor
- 8.6.5. Energy & Power
- 8.6.6. Others
- 8.1. Market Analysis, Insights and Forecast - by Product Type
- 9. Asia Pacific Spark Plasma Sintering Industry Analysis, Insights and Forecast, 2020-2032
- 9.1. Market Analysis, Insights and Forecast - by Product Type
- 9.1.1. Lab-Scale/Research Systems
- 9.1.2. Pilot-Scale/Prototyping Systems
- 9.1.3. Industrial/Production Systems
- 9.2. Market Analysis, Insights and Forecast - by Material Processed
- 9.2.1. Metals
- 9.2.2. Cermaics
- 9.2.2.1. Oxides
- 9.2.2.2. Carbies
- 9.2.2.3. Nitrides
- 9.2.2.4. Borides
- 9.2.2.5. Flourides
- 9.2.2.6. Cermets
- 9.2.3. Intermetalic Compounds
- 9.2.4. Others
- 9.3. Market Analysis, Insights and Forecast - by Process Capacity
- 9.3.1. Small Batch
- 9.3.2. Large BatchEntry-Level
- 9.4. Market Analysis, Insights and Forecast - by Price Range
- 9.4.1. Entry-Level
- 9.4.2. Mid-Range
- 9.4.3. High-End
- 9.5. Market Analysis, Insights and Forecast - by Sales Channel
- 9.5.1. Direct Sales
- 9.5.2. Distributors and Wholesalers
- 9.5.3. Online
- 9.6. Market Analysis, Insights and Forecast - by End User Industry
- 9.6.1. Aerospace & Defense
- 9.6.2. Automotive
- 9.6.3. Healthcare & Medical Devices
- 9.6.4. Electronics & Semiconductor
- 9.6.5. Energy & Power
- 9.6.6. Others
- 9.1. Market Analysis, Insights and Forecast - by Product Type
- 10. Latin America Spark Plasma Sintering Industry Analysis, Insights and Forecast, 2020-2032
- 10.1. Market Analysis, Insights and Forecast - by Product Type
- 10.1.1. Lab-Scale/Research Systems
- 10.1.2. Pilot-Scale/Prototyping Systems
- 10.1.3. Industrial/Production Systems
- 10.2. Market Analysis, Insights and Forecast - by Material Processed
- 10.2.1. Metals
- 10.2.2. Cermaics
- 10.2.2.1. Oxides
- 10.2.2.2. Carbies
- 10.2.2.3. Nitrides
- 10.2.2.4. Borides
- 10.2.2.5. Flourides
- 10.2.2.6. Cermets
- 10.2.3. Intermetalic Compounds
- 10.2.4. Others
- 10.3. Market Analysis, Insights and Forecast - by Process Capacity
- 10.3.1. Small Batch
- 10.3.2. Large BatchEntry-Level
- 10.4. Market Analysis, Insights and Forecast - by Price Range
- 10.4.1. Entry-Level
- 10.4.2. Mid-Range
- 10.4.3. High-End
- 10.5. Market Analysis, Insights and Forecast - by Sales Channel
- 10.5.1. Direct Sales
- 10.5.2. Distributors and Wholesalers
- 10.5.3. Online
- 10.6. Market Analysis, Insights and Forecast - by End User Industry
- 10.6.1. Aerospace & Defense
- 10.6.2. Automotive
- 10.6.3. Healthcare & Medical Devices
- 10.6.4. Electronics & Semiconductor
- 10.6.5. Energy & Power
- 10.6.6. Others
- 10.1. Market Analysis, Insights and Forecast - by Product Type
- 11. Middle East and Africa Spark Plasma Sintering Industry Analysis, Insights and Forecast, 2020-2032
- 11.1. Market Analysis, Insights and Forecast - by Product Type
- 11.1.1. Lab-Scale/Research Systems
- 11.1.2. Pilot-Scale/Prototyping Systems
- 11.1.3. Industrial/Production Systems
- 11.2. Market Analysis, Insights and Forecast - by Material Processed
- 11.2.1. Metals
- 11.2.2. Cermaics
- 11.2.2.1. Oxides
- 11.2.2.2. Carbies
- 11.2.2.3. Nitrides
- 11.2.2.4. Borides
- 11.2.2.5. Flourides
- 11.2.2.6. Cermets
- 11.2.3. Intermetalic Compounds
- 11.2.4. Others
- 11.3. Market Analysis, Insights and Forecast - by Process Capacity
- 11.3.1. Small Batch
- 11.3.2. Large BatchEntry-Level
- 11.4. Market Analysis, Insights and Forecast - by Price Range
- 11.4.1. Entry-Level
- 11.4.2. Mid-Range
- 11.4.3. High-End
- 11.5. Market Analysis, Insights and Forecast - by Sales Channel
- 11.5.1. Direct Sales
- 11.5.2. Distributors and Wholesalers
- 11.5.3. Online
- 11.6. Market Analysis, Insights and Forecast - by End User Industry
- 11.6.1. Aerospace & Defense
- 11.6.2. Automotive
- 11.6.3. Healthcare & Medical Devices
- 11.6.4. Electronics & Semiconductor
- 11.6.5. Energy & Power
- 11.6.6. Others
- 11.1. Market Analysis, Insights and Forecast - by Product Type
- 12. Competitive Analysis
- 12.1. Company Profiles
- 12.1.1 GeniCore
- 12.1.1.1. Company Overview
- 12.1.1.2. Products
- 12.1.1.3. Company Financials
- 12.1.1.4. SWOT Analysis
- 12.1.2 Retech Systems LLC
- 12.1.2.1. Company Overview
- 12.1.2.2. Products
- 12.1.2.3. Company Financials
- 12.1.2.4. SWOT Analysis
- 12.1.3 Fuji Electronic Ind. Co.
- 12.1.3.1. Company Overview
- 12.1.3.2. Products
- 12.1.3.3. Company Financials
- 12.1.3.4. SWOT Analysis
- 12.1.4 KAN-THT India Pvt Ltd
- 12.1.4.1. Company Overview
- 12.1.4.2. Products
- 12.1.4.3. Company Financials
- 12.1.4.4. SWOT Analysis
- 12.1.5 Shenyang Kejing
- 12.1.5.1. Company Overview
- 12.1.5.2. Products
- 12.1.5.3. Company Financials
- 12.1.5.4. SWOT Analysis
- 12.1.6 Norimat
- 12.1.6.1. Company Overview
- 12.1.6.2. Products
- 12.1.6.3. Company Financials
- 12.1.6.4. SWOT Analysis
- 12.1.7 Kompass International
- 12.1.7.1. Company Overview
- 12.1.7.2. Products
- 12.1.7.3. Company Financials
- 12.1.7.4. SWOT Analysis
- 12.1.8 Others
- 12.1.8.1. Company Overview
- 12.1.8.2. Products
- 12.1.8.3. Company Financials
- 12.1.8.4. SWOT Analysis
- 12.1.1 GeniCore
- 12.2. Market Entropy
- 12.2.1 Company's Key Areas Served
- 12.2.2 Recent Developments
- 12.3. Company Market Share Analysis 2025
- 12.3.1 Top 5 Companies Market Share Analysis
- 12.3.2 Top 3 Companies Market Share Analysis
- 12.4. List of Potential Customers
- 13. Research Methodology
List of Figures
- Figure 1: Global Spark Plasma Sintering Industry Revenue Breakdown (billion, %) by Region 2025 & 2033
- Figure 2: North America Spark Plasma Sintering Industry Revenue (billion), by Product Type 2025 & 2033
- Figure 3: North America Spark Plasma Sintering Industry Revenue Share (%), by Product Type 2025 & 2033
- Figure 4: North America Spark Plasma Sintering Industry Revenue (billion), by Material Processed 2025 & 2033
- Figure 5: North America Spark Plasma Sintering Industry Revenue Share (%), by Material Processed 2025 & 2033
- Figure 6: North America Spark Plasma Sintering Industry Revenue (billion), by Process Capacity 2025 & 2033
- Figure 7: North America Spark Plasma Sintering Industry Revenue Share (%), by Process Capacity 2025 & 2033
- Figure 8: North America Spark Plasma Sintering Industry Revenue (billion), by Price Range 2025 & 2033
- Figure 9: North America Spark Plasma Sintering Industry Revenue Share (%), by Price Range 2025 & 2033
- Figure 10: North America Spark Plasma Sintering Industry Revenue (billion), by Sales Channel 2025 & 2033
- Figure 11: North America Spark Plasma Sintering Industry Revenue Share (%), by Sales Channel 2025 & 2033
- Figure 12: North America Spark Plasma Sintering Industry Revenue (billion), by End User Industry 2025 & 2033
- Figure 13: North America Spark Plasma Sintering Industry Revenue Share (%), by End User Industry 2025 & 2033
- Figure 14: North America Spark Plasma Sintering Industry Revenue (billion), by Country 2025 & 2033
- Figure 15: North America Spark Plasma Sintering Industry Revenue Share (%), by Country 2025 & 2033
- Figure 16: Europe Spark Plasma Sintering Industry Revenue (billion), by Product Type 2025 & 2033
- Figure 17: Europe Spark Plasma Sintering Industry Revenue Share (%), by Product Type 2025 & 2033
- Figure 18: Europe Spark Plasma Sintering Industry Revenue (billion), by Material Processed 2025 & 2033
- Figure 19: Europe Spark Plasma Sintering Industry Revenue Share (%), by Material Processed 2025 & 2033
- Figure 20: Europe Spark Plasma Sintering Industry Revenue (billion), by Process Capacity 2025 & 2033
- Figure 21: Europe Spark Plasma Sintering Industry Revenue Share (%), by Process Capacity 2025 & 2033
- Figure 22: Europe Spark Plasma Sintering Industry Revenue (billion), by Price Range 2025 & 2033
- Figure 23: Europe Spark Plasma Sintering Industry Revenue Share (%), by Price Range 2025 & 2033
- Figure 24: Europe Spark Plasma Sintering Industry Revenue (billion), by Sales Channel 2025 & 2033
- Figure 25: Europe Spark Plasma Sintering Industry Revenue Share (%), by Sales Channel 2025 & 2033
- Figure 26: Europe Spark Plasma Sintering Industry Revenue (billion), by End User Industry 2025 & 2033
- Figure 27: Europe Spark Plasma Sintering Industry Revenue Share (%), by End User Industry 2025 & 2033
- Figure 28: Europe Spark Plasma Sintering Industry Revenue (billion), by Country 2025 & 2033
- Figure 29: Europe Spark Plasma Sintering Industry Revenue Share (%), by Country 2025 & 2033
- Figure 30: Asia Pacific Spark Plasma Sintering Industry Revenue (billion), by Product Type 2025 & 2033
- Figure 31: Asia Pacific Spark Plasma Sintering Industry Revenue Share (%), by Product Type 2025 & 2033
- Figure 32: Asia Pacific Spark Plasma Sintering Industry Revenue (billion), by Material Processed 2025 & 2033
- Figure 33: Asia Pacific Spark Plasma Sintering Industry Revenue Share (%), by Material Processed 2025 & 2033
- Figure 34: Asia Pacific Spark Plasma Sintering Industry Revenue (billion), by Process Capacity 2025 & 2033
- Figure 35: Asia Pacific Spark Plasma Sintering Industry Revenue Share (%), by Process Capacity 2025 & 2033
- Figure 36: Asia Pacific Spark Plasma Sintering Industry Revenue (billion), by Price Range 2025 & 2033
- Figure 37: Asia Pacific Spark Plasma Sintering Industry Revenue Share (%), by Price Range 2025 & 2033
- Figure 38: Asia Pacific Spark Plasma Sintering Industry Revenue (billion), by Sales Channel 2025 & 2033
- Figure 39: Asia Pacific Spark Plasma Sintering Industry Revenue Share (%), by Sales Channel 2025 & 2033
- Figure 40: Asia Pacific Spark Plasma Sintering Industry Revenue (billion), by End User Industry 2025 & 2033
- Figure 41: Asia Pacific Spark Plasma Sintering Industry Revenue Share (%), by End User Industry 2025 & 2033
- Figure 42: Asia Pacific Spark Plasma Sintering Industry Revenue (billion), by Country 2025 & 2033
- Figure 43: Asia Pacific Spark Plasma Sintering Industry Revenue Share (%), by Country 2025 & 2033
- Figure 44: Latin America Spark Plasma Sintering Industry Revenue (billion), by Product Type 2025 & 2033
- Figure 45: Latin America Spark Plasma Sintering Industry Revenue Share (%), by Product Type 2025 & 2033
- Figure 46: Latin America Spark Plasma Sintering Industry Revenue (billion), by Material Processed 2025 & 2033
- Figure 47: Latin America Spark Plasma Sintering Industry Revenue Share (%), by Material Processed 2025 & 2033
- Figure 48: Latin America Spark Plasma Sintering Industry Revenue (billion), by Process Capacity 2025 & 2033
- Figure 49: Latin America Spark Plasma Sintering Industry Revenue Share (%), by Process Capacity 2025 & 2033
- Figure 50: Latin America Spark Plasma Sintering Industry Revenue (billion), by Price Range 2025 & 2033
- Figure 51: Latin America Spark Plasma Sintering Industry Revenue Share (%), by Price Range 2025 & 2033
- Figure 52: Latin America Spark Plasma Sintering Industry Revenue (billion), by Sales Channel 2025 & 2033
- Figure 53: Latin America Spark Plasma Sintering Industry Revenue Share (%), by Sales Channel 2025 & 2033
- Figure 54: Latin America Spark Plasma Sintering Industry Revenue (billion), by End User Industry 2025 & 2033
- Figure 55: Latin America Spark Plasma Sintering Industry Revenue Share (%), by End User Industry 2025 & 2033
- Figure 56: Latin America Spark Plasma Sintering Industry Revenue (billion), by Country 2025 & 2033
- Figure 57: Latin America Spark Plasma Sintering Industry Revenue Share (%), by Country 2025 & 2033
- Figure 58: Middle East and Africa Spark Plasma Sintering Industry Revenue (billion), by Product Type 2025 & 2033
- Figure 59: Middle East and Africa Spark Plasma Sintering Industry Revenue Share (%), by Product Type 2025 & 2033
- Figure 60: Middle East and Africa Spark Plasma Sintering Industry Revenue (billion), by Material Processed 2025 & 2033
- Figure 61: Middle East and Africa Spark Plasma Sintering Industry Revenue Share (%), by Material Processed 2025 & 2033
- Figure 62: Middle East and Africa Spark Plasma Sintering Industry Revenue (billion), by Process Capacity 2025 & 2033
- Figure 63: Middle East and Africa Spark Plasma Sintering Industry Revenue Share (%), by Process Capacity 2025 & 2033
- Figure 64: Middle East and Africa Spark Plasma Sintering Industry Revenue (billion), by Price Range 2025 & 2033
- Figure 65: Middle East and Africa Spark Plasma Sintering Industry Revenue Share (%), by Price Range 2025 & 2033
- Figure 66: Middle East and Africa Spark Plasma Sintering Industry Revenue (billion), by Sales Channel 2025 & 2033
- Figure 67: Middle East and Africa Spark Plasma Sintering Industry Revenue Share (%), by Sales Channel 2025 & 2033
- Figure 68: Middle East and Africa Spark Plasma Sintering Industry Revenue (billion), by End User Industry 2025 & 2033
- Figure 69: Middle East and Africa Spark Plasma Sintering Industry Revenue Share (%), by End User Industry 2025 & 2033
- Figure 70: Middle East and Africa Spark Plasma Sintering Industry Revenue (billion), by Country 2025 & 2033
- Figure 71: Middle East and Africa Spark Plasma Sintering Industry Revenue Share (%), by Country 2025 & 2033
List of Tables
- Table 1: Global Spark Plasma Sintering Industry Revenue billion Forecast, by Product Type 2020 & 2033
- Table 2: Global Spark Plasma Sintering Industry Revenue billion Forecast, by Material Processed 2020 & 2033
- Table 3: Global Spark Plasma Sintering Industry Revenue billion Forecast, by Process Capacity 2020 & 2033
- Table 4: Global Spark Plasma Sintering Industry Revenue billion Forecast, by Price Range 2020 & 2033
- Table 5: Global Spark Plasma Sintering Industry Revenue billion Forecast, by Sales Channel 2020 & 2033
- Table 6: Global Spark Plasma Sintering Industry Revenue billion Forecast, by End User Industry 2020 & 2033
- Table 7: Global Spark Plasma Sintering Industry Revenue billion Forecast, by Region 2020 & 2033
- Table 8: Global Spark Plasma Sintering Industry Revenue billion Forecast, by Product Type 2020 & 2033
- Table 9: Global Spark Plasma Sintering Industry Revenue billion Forecast, by Material Processed 2020 & 2033
- Table 10: Global Spark Plasma Sintering Industry Revenue billion Forecast, by Process Capacity 2020 & 2033
- Table 11: Global Spark Plasma Sintering Industry Revenue billion Forecast, by Price Range 2020 & 2033
- Table 12: Global Spark Plasma Sintering Industry Revenue billion Forecast, by Sales Channel 2020 & 2033
- Table 13: Global Spark Plasma Sintering Industry Revenue billion Forecast, by End User Industry 2020 & 2033
- Table 14: Global Spark Plasma Sintering Industry Revenue billion Forecast, by Country 2020 & 2033
- Table 15: Global Spark Plasma Sintering Industry Revenue billion Forecast, by Product Type 2020 & 2033
- Table 16: Global Spark Plasma Sintering Industry Revenue billion Forecast, by Material Processed 2020 & 2033
- Table 17: Global Spark Plasma Sintering Industry Revenue billion Forecast, by Process Capacity 2020 & 2033
- Table 18: Global Spark Plasma Sintering Industry Revenue billion Forecast, by Price Range 2020 & 2033
- Table 19: Global Spark Plasma Sintering Industry Revenue billion Forecast, by Sales Channel 2020 & 2033
- Table 20: Global Spark Plasma Sintering Industry Revenue billion Forecast, by End User Industry 2020 & 2033
- Table 21: Global Spark Plasma Sintering Industry Revenue billion Forecast, by Country 2020 & 2033
- Table 22: Global Spark Plasma Sintering Industry Revenue billion Forecast, by Product Type 2020 & 2033
- Table 23: Global Spark Plasma Sintering Industry Revenue billion Forecast, by Material Processed 2020 & 2033
- Table 24: Global Spark Plasma Sintering Industry Revenue billion Forecast, by Process Capacity 2020 & 2033
- Table 25: Global Spark Plasma Sintering Industry Revenue billion Forecast, by Price Range 2020 & 2033
- Table 26: Global Spark Plasma Sintering Industry Revenue billion Forecast, by Sales Channel 2020 & 2033
- Table 27: Global Spark Plasma Sintering Industry Revenue billion Forecast, by End User Industry 2020 & 2033
- Table 28: Global Spark Plasma Sintering Industry Revenue billion Forecast, by Country 2020 & 2033
- Table 29: Global Spark Plasma Sintering Industry Revenue billion Forecast, by Product Type 2020 & 2033
- Table 30: Global Spark Plasma Sintering Industry Revenue billion Forecast, by Material Processed 2020 & 2033
- Table 31: Global Spark Plasma Sintering Industry Revenue billion Forecast, by Process Capacity 2020 & 2033
- Table 32: Global Spark Plasma Sintering Industry Revenue billion Forecast, by Price Range 2020 & 2033
- Table 33: Global Spark Plasma Sintering Industry Revenue billion Forecast, by Sales Channel 2020 & 2033
- Table 34: Global Spark Plasma Sintering Industry Revenue billion Forecast, by End User Industry 2020 & 2033
- Table 35: Global Spark Plasma Sintering Industry Revenue billion Forecast, by Country 2020 & 2033
- Table 36: Global Spark Plasma Sintering Industry Revenue billion Forecast, by Product Type 2020 & 2033
- Table 37: Global Spark Plasma Sintering Industry Revenue billion Forecast, by Material Processed 2020 & 2033
- Table 38: Global Spark Plasma Sintering Industry Revenue billion Forecast, by Process Capacity 2020 & 2033
- Table 39: Global Spark Plasma Sintering Industry Revenue billion Forecast, by Price Range 2020 & 2033
- Table 40: Global Spark Plasma Sintering Industry Revenue billion Forecast, by Sales Channel 2020 & 2033
- Table 41: Global Spark Plasma Sintering Industry Revenue billion Forecast, by End User Industry 2020 & 2033
- Table 42: Global Spark Plasma Sintering Industry Revenue billion Forecast, by Country 2020 & 2033
Frequently Asked Questions
1. What is the projected Compound Annual Growth Rate (CAGR) of the Spark Plasma Sintering Industry?
The projected CAGR is approximately 7.5%.
2. Which companies are prominent players in the Spark Plasma Sintering Industry?
Key companies in the market include GeniCore, Retech Systems, LLC, Fuji Electronic Ind. Co., KAN-THT India Pvt Ltd,, Shenyang Kejing, Norimat, Kompass International, Others.
3. What are the main segments of the Spark Plasma Sintering Industry?
The market segments include Product Type, Material Processed, Process Capacity, Price Range, Sales Channel, End User Industry.
4. Can you provide details about the market size?
The market size is estimated to be USD 0.89 billion as of 2022.
5. What are some drivers contributing to market growth?
Increase in Defense Budgets Across Geographies.
6. What are the notable trends driving market growth?
The Automotive Segment is Expected to Drive the Market's Growth.
7. Are there any restraints impacting market growth?
Highly Consolidated Market.
8. Can you provide examples of recent developments in the market?
June 2022 - The national spark plasma sintering (SPS) facility was established at the Department of Materials and Environmental Chemistry at Stockholm University. The facility has two SPS machines, SPS825 and SPS530ET, integrated with the glove box. The SPS facility can subject the materials to rapid sintering cycles in a vacuum or inert atmosphere. The materials include\ ceramics, metals and alloys, intermetallics, composites, and porous materials. The SPS facility can produce sintered materials of both small and large dimensions and handle air-sensitive materials.
9. What pricing options are available for accessing the report?
Pricing options include single-user, multi-user, and enterprise licenses priced at USD 4750, USD 5250, and USD 8750 respectively.
10. Is the market size provided in terms of value or volume?
The market size is provided in terms of value, measured in billion.
11. Are there any specific market keywords associated with the report?
Yes, the market keyword associated with the report is "Spark Plasma Sintering Industry," which aids in identifying and referencing the specific market segment covered.
12. How do I determine which pricing option suits my needs best?
The pricing options vary based on user requirements and access needs. Individual users may opt for single-user licenses, while businesses requiring broader access may choose multi-user or enterprise licenses for cost-effective access to the report.
13. Are there any additional resources or data provided in the Spark Plasma Sintering Industry report?
While the report offers comprehensive insights, it's advisable to review the specific contents or supplementary materials provided to ascertain if additional resources or data are available.
14. How can I stay updated on further developments or reports in the Spark Plasma Sintering Industry?
To stay informed about further developments, trends, and reports in the Spark Plasma Sintering Industry, consider subscribing to industry newsletters, following relevant companies and organizations, or regularly checking reputable industry news sources and publications.
Methodology
Step 1 - Identification of Relevant Samples Size from Population Database


Step 2 - Approaches for Defining Global Market Size (Value, Volume* & Price*)

Note*: In applicable scenarios
Step 3 - Data Sources
Primary Research
- Web Analytics
- Survey Reports
- Research Institute
- Latest Research Reports
- Opinion Leaders
Secondary Research
- Annual Reports
- White Paper
- Latest Press Release
- Industry Association
- Paid Database
- Investor Presentations

Step 4 - Data Triangulation
Involves using different sources of information in order to increase the validity of a study
These sources are likely to be stakeholders in a program - participants, other researchers, program staff, other community members, and so on.
Then we put all data in single framework & apply various statistical tools to find out the dynamic on the market.
During the analysis stage, feedback from the stakeholder groups would be compared to determine areas of agreement as well as areas of divergence