

Key Insights
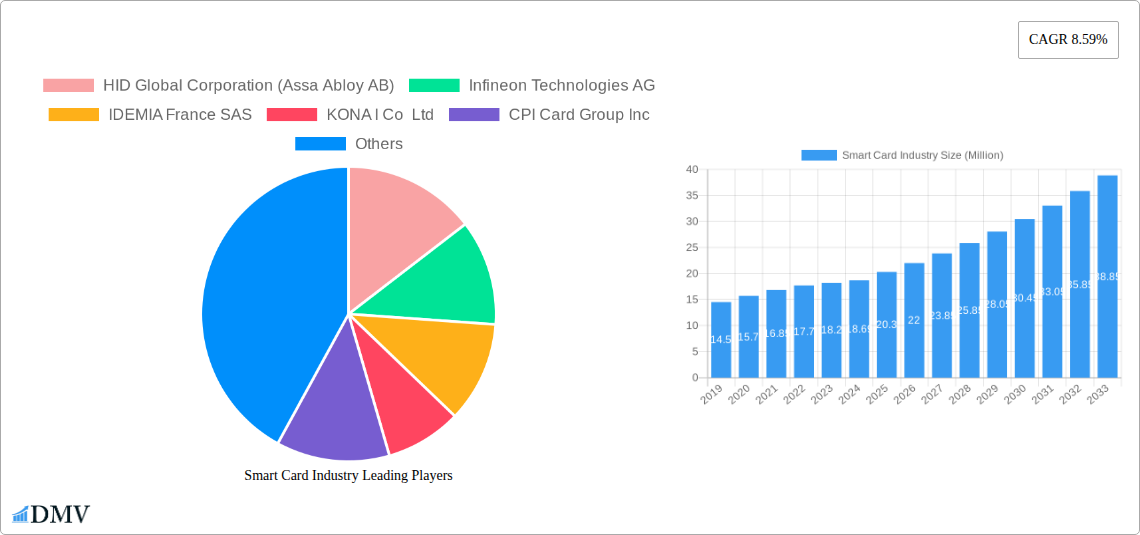
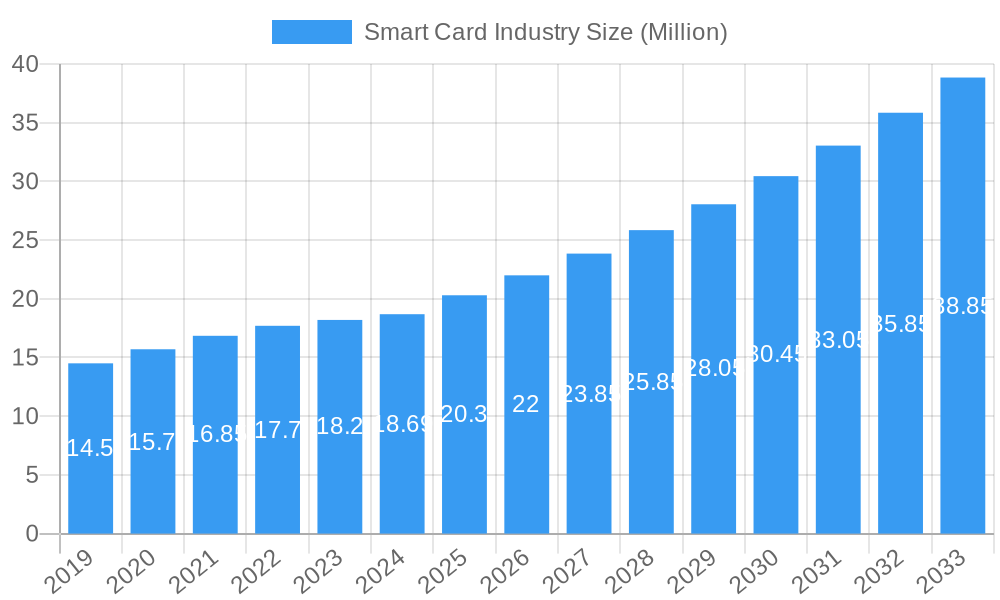
The global Smart Card Industry is poised for significant expansion, with a current market size estimated at USD 18.69 billion. This robust growth is projected to continue at a Compound Annual Growth Rate (CAGR) of 8.59% from 2025 to 2033. The industry is propelled by a confluence of factors, including the escalating demand for enhanced security and authentication solutions across various sectors, and the widespread adoption of digital payment systems. The increasing proliferation of IoT devices and the ongoing digital transformation initiatives are also critical drivers, necessitating secure identification and transaction capabilities that smart cards provide. Furthermore, government mandates for secure identification, particularly in areas like e-passports and national ID programs, are contributing substantially to market growth. The BFSI sector remains a dominant end-user, leveraging smart cards for secure banking, credit, and debit transactions. The IT & Telecommunication sector is also a key consumer, utilizing smart cards for network access and device authentication. The Transportation industry is increasingly adopting smart cards for ticketing and access control, further fueling market expansion.
Smart Card Industry Market Size (In Million)
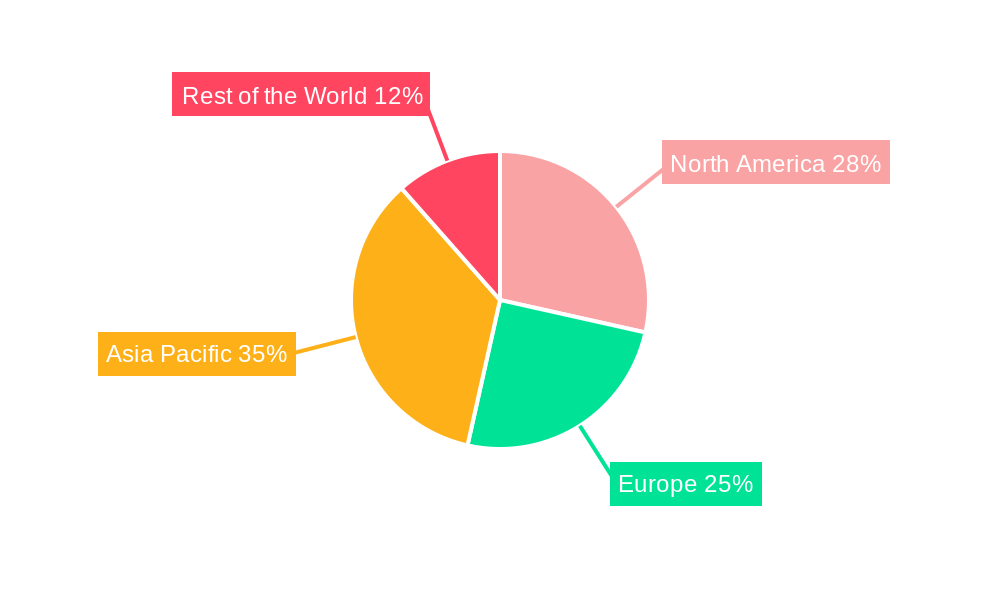
The industry is witnessing a dynamic shift with the increasing preference for Contact-Less smart card technology, driven by convenience and speed in transactions and access. This trend is expected to outpace the growth of traditional Contact-based cards. However, established contact-based solutions will continue to hold a significant market share due to their entrenched use in legacy systems and specific security requirements. Emerging markets in Asia Pacific, particularly China and India, are expected to exhibit the highest growth rates due to rapid digitalization, a burgeoning middle class, and increasing government investment in secure identification infrastructure. Conversely, North America and Europe, while mature markets, will continue to be major contributors, driven by technological advancements and a strong focus on data security and privacy. The competitive landscape is characterized by the presence of established players and emerging innovators, all vying for market share through product differentiation, strategic partnerships, and technological advancements in areas like embedded security and biometrics integration.
Smart Card Industry Company Market Share
Smart Card Industry Market Composition & Trends
This comprehensive report offers an in-depth analysis of the global Smart Card Industry, meticulously examining its current composition and future trajectory. The market is characterized by a diverse range of players, with key entities like HID Global Corporation (Assa Abloy AB), Infineon Technologies AG, and IDEMIA France SAS holding significant market share. Innovation remains a primary catalyst, driven by the increasing demand for secure and convenient transaction solutions across various verticals. Regulatory landscapes are evolving, with governments worldwide implementing stringent security standards for identity management and payment systems, further bolstering market growth. Substitute products, such as QR codes and mobile payment solutions, present a competitive challenge, but the inherent security and reliability of smart cards continue to ensure their dominance in critical applications. End-user profiles are expanding, encompassing the BFSI, IT & Telecommunication, Government, and Transportation sectors, each with unique requirements and adoption patterns. Mergers and acquisitions (M&A) activities are shaping the industry's competitive dynamics, with significant deal values indicating consolidation and strategic expansion. The report details M&A deal values, projected market share distribution, and key innovation trends influencing market concentration.
Smart Card Industry Industry Evolution
The Smart Card Industry has undergone a remarkable evolution, transforming from a niche security solution to a ubiquitous technology embedded in our daily lives. Over the Study Period (2019–2033), the industry has witnessed consistent market growth, driven by escalating demand for secure identification, contactless payments, and access control systems. Technological advancements have been pivotal, with the transition from contact-based to contact-less smart cards accelerating adoption due to their enhanced convenience and speed. The Base Year (2025) signifies a crucial inflection point, with the Estimated Year (2025) and Forecast Period (2025–2033) projecting sustained, robust growth. Historical data from 2019–2024 highlights a Compound Annual Growth Rate (CAGR) of approximately 8-10%, fueled by the digitalization of economies and the increasing need for robust data security. Shifting consumer demands for seamless and secure interactions have pushed the industry towards more sophisticated applications, including embedded secure elements in mobile devices and IoT devices. The adoption of dual-interface cards, offering both contact and contact-less functionalities, has further broadened their appeal. The ongoing research and development into advanced materials and miniaturization are enabling the integration of smart card technology into an ever-wider array of form factors, from wearable devices to advanced transportation systems. The report delves into specific adoption metrics, illustrating the increasing penetration of smart cards across various end-user verticals, and provides a detailed breakdown of the market growth trajectories.
Leading Regions, Countries, or Segments in Smart Card Industry
The Smart Card Industry exhibits distinct regional dominance and segment leadership, with Asia Pacific emerging as a powerhouse. This leadership is driven by several interconnected factors, including rapid economic development, a vast and growing population embracing digital technologies, and significant government initiatives to enhance security and efficiency across sectors. The BFSI segment stands out as a primary driver of demand within this region and globally. This is attributable to the escalating adoption of contactless payment cards, EMV chip cards for enhanced transaction security, and the burgeoning digital banking landscape.
Key drivers for Asia Pacific's dominance include:
- Massive Untapped Market Potential: Countries like India and China, with their large populations, represent significant growth opportunities for smart card adoption in payment, identification, and transit systems.
- Government-led Digitalization Initiatives: Governments are actively promoting digital transformation, mandating the use of smart cards for national ID programs, secure e-governance services, and public transportation.
- Favorable Regulatory Environment: Supportive policies and regulations encouraging the adoption of secure payment and identification technologies facilitate market expansion.
- Technological Advancements and Local Manufacturing: The presence of leading smart card manufacturers and a robust ecosystem for technology development contribute to cost-effectiveness and localized solutions.
Within the Smart Card Industry, the Contact-Less segment demonstrates superior growth and wider adoption compared to its contact-based counterpart. This preference is largely due to the inherent convenience, speed, and enhanced user experience offered by contactless technology, particularly in high-frequency transaction environments like retail payments and public transportation. The ability to simply tap and go has revolutionized consumer interaction with payment and access systems.
- BFSI: The financial sector's embrace of contactless EMV payment cards, enabling faster checkouts at point-of-sale terminals, is a significant contributor to the contact-less segment's dominance.
- Transportation: The implementation of National Common Mobility Cards (NCMC) and other contactless transit solutions, allowing seamless travel across different modes of transport, further fuels this segment.
- Government: The use of contactless smart cards for secure access control in government facilities and for national identification purposes is also a key growth area.
- IT & Telecommunication: Contactless smart cards are increasingly used for secure network access and loyalty programs.
The Transportation vertical is also experiencing a surge in smart card integration, driven by the need for efficient passenger management and fare collection systems. The GoSmart National Common Mobility Card (NCMC) launch in India exemplifies this trend, highlighting the potential for interoperable smart card solutions to streamline mobility and enhance traveler experience.
Smart Card Industry Product Innovations
Product innovation in the Smart Card Industry is primarily focused on enhancing security features, improving performance, and expanding application capabilities. Leading manufacturers are developing advanced embedded secure elements (eSEs) that offer multi-application support and robust cryptographic capabilities. Innovations include larger memory capacities, faster processing speeds, and the integration of biometric authentication features directly into the card for elevated security. Furthermore, there's a growing emphasis on developing eco-friendly smart card materials and manufacturing processes, aligning with global sustainability initiatives. The development of ultra-thin and flexible smart cards is opening up new possibilities for integration into various form factors beyond traditional plastic cards, enhancing user convenience and enabling new use cases in the Internet of Things (IoT) ecosystem.
Propelling Factors for Smart Card Industry Growth
The Smart Card Industry's growth is propelled by several key factors. Firstly, the ever-increasing demand for enhanced security and fraud prevention in digital transactions, particularly in the BFSI sector, drives the adoption of EMV chip technology. Secondly, government mandates for secure national identification programs and e-governance services are creating substantial market opportunities. Thirdly, the pervasive adoption of contactless payment systems and the need for seamless transit solutions in urban areas are fueling the demand for contact-less smart cards. Technological advancements, such as the integration of IoT capabilities and the development of more sophisticated secure elements, are further expanding the application scope of smart cards. Finally, the growing awareness among consumers and businesses about the benefits of secure and convenient digital interactions plays a crucial role in market expansion.
Obstacles in the Smart Card Industry Market
Despite its robust growth, the Smart Card Industry faces several obstacles. The increasing prevalence of mobile payment solutions and digital wallets poses a competitive threat, as consumers opt for the convenience of using their smartphones for transactions. Regulatory hurdles and varying data privacy laws across different regions can complicate global product deployment and certification processes. Supply chain disruptions, particularly those impacting the availability of raw materials like semiconductors, can lead to production delays and increased costs. Furthermore, the initial cost of implementing smart card infrastructure for some organizations can be a significant barrier to adoption. The ongoing evolution of cyber threats necessitates continuous investment in advanced security features, which can also impact profitability.
Future Opportunities in Smart Card Industry
The Smart Card Industry is poised for significant future opportunities. The burgeoning Internet of Things (IoT) ecosystem presents a vast untapped market, with smart cards offering secure authentication and data protection for connected devices. The continued expansion of contactless payment and transit systems globally, especially in emerging economies, will drive demand. Furthermore, advancements in biometric integration directly onto smart cards will enhance security and convenience for applications like access control and identity verification. The development of advanced, sustainable materials for smart cards also presents an opportunity to cater to environmentally conscious markets. The integration of smart cards with blockchain technology for enhanced data integrity and security is another promising avenue for future growth.
Major Players in the Smart Card Industry Ecosystem
- HID Global Corporation (Assa Abloy AB)
- Infineon Technologies AG
- IDEMIA France SAS
- KONA I Co Ltd
- CPI Card Group Inc
- Samsung Electronics Co Ltd
- Gemalto NV (Thales Group)
- Watchdata Technologies
- Secura Key
- Fingerprint Cards AB
- Alioth LLC
- CardLogix Corporation
- Giesecke & Devrient GmbH (MC Familiengesellschaft mbH)
- Bundesdruckerei GmbH
- IntelCav
Key Developments in Smart Card Industry Industry
- April 2023: The GoSmart National Common Mobility Card (NCMC) was launched for passengers using the Kanpur metro in India. This interchangeable transport card offers nationwide interoperability for retail, parking, metro, bus, and other transportation services, significantly enhancing traveler convenience and saving time.
- January 2023: dzcard, a leading secured smart card solution and digital security provider, inaugurated a new innovation center dedicated to next-generation card technologies with a focus on sustainability in Bangkok, Thailand. This lab serves as a platform for co-creating and evaluating sustainable products with clients and partners.
Strategic Smart Card Industry Market Forecast
The strategic forecast for the Smart Card Industry indicates a period of sustained and accelerated growth, fueled by increasing global demand for secure and convenient digital solutions. Key growth catalysts include the ongoing digital transformation across all sectors, the mandated adoption of secure identification and payment systems by governments, and the expanding use of contactless technologies in daily transactions. The rise of the Internet of Things (IoT) presents a significant untapped market for smart card applications, offering enhanced security and authentication for connected devices. Continued innovation in embedded secure elements, biometric integration, and sustainable materials will further drive market expansion. The Asia Pacific region is expected to remain a dominant force, with strong growth anticipated in emerging economies. The industry's ability to adapt to evolving cybersecurity threats and integrate with emerging technologies will be crucial for realizing its full market potential.
Smart Card Industry Segmentation
-
1. Type
- 1.1. Contact-based
- 1.2. Contact-Less
-
2. End-user Vertical
- 2.1. BFSI
- 2.2. IT & Telecommunication
- 2.3. Government
- 2.4. Transportation
- 2.5. Other
Smart Card Industry Segmentation By Geography
-
1. North America
- 1.1. United States
- 1.2. Canada
-
2. Europe
- 2.1. United Kingdom
- 2.2. Germany
- 2.3. France
- 2.4. Rest of Europe
-
3. Asia Pacific
- 3.1. China
- 3.2. Japan
- 3.3. India
- 3.4. Rest of Asia Pacific
- 4. Rest of the World
Smart Card Industry Regional Market Share
Geographic Coverage of Smart Card Industry
Smart Card Industry REPORT HIGHLIGHTS
| Aspects | Details |
|---|---|
| Study Period | 2020-2034 |
| Base Year | 2025 |
| Estimated Year | 2026 |
| Forecast Period | 2026-2034 |
| Historical Period | 2020-2025 |
| Growth Rate | CAGR of 8.59% from 2020-2034 |
| Segmentation |
|
Table of Contents
- 1. Introduction
- 1.1. Research Scope
- 1.2. Market Segmentation
- 1.3. Research Objective
- 1.4. Definitions and Assumptions
- 2. Executive Summary
- 2.1. Market Snapshot
- 3. Market Dynamics
- 3.1. Market Drivers
- 3.2. Market Restrains
- 3.3. Market Trends
- 3.4. Market Opportunities
- 4. Market Factor Analysis
- 4.1. Porters Five Forces
- 4.1.1. Bargaining Power of Suppliers
- 4.1.2. Bargaining Power of Buyers
- 4.1.3. Threat of New Entrants
- 4.1.4. Threat of Substitutes
- 4.1.5. Competitive Rivalry
- 4.2. PESTEL analysis
- 4.3. BCG Analysis
- 4.3.1. Stars (High Growth, High Market Share)
- 4.3.2. Cash Cows (Low Growth, High Market Share)
- 4.3.3. Question Mark (High Growth, Low Market Share)
- 4.3.4. Dogs (Low Growth, Low Market Share)
- 4.4. Ansoff Matrix Analysis
- 4.5. Supply Chain Analysis
- 4.6. Regulatory Landscape
- 4.7. Current Market Potential and Opportunity Assessment (TAM–SAM–SOM Framework)
- 4.8. DMV Analyst Note
- 4.1. Porters Five Forces
- 5. Market Analysis, Insights and Forecast 2021-2033
- 5.1. Market Analysis, Insights and Forecast - by Type
- 5.1.1. Contact-based
- 5.1.2. Contact-Less
- 5.2. Market Analysis, Insights and Forecast - by End-user Vertical
- 5.2.1. BFSI
- 5.2.2. IT & Telecommunication
- 5.2.3. Government
- 5.2.4. Transportation
- 5.2.5. Other
- 5.3. Market Analysis, Insights and Forecast - by Region
- 5.3.1. North America
- 5.3.2. Europe
- 5.3.3. Asia Pacific
- 5.3.4. Rest of the World
- 5.1. Market Analysis, Insights and Forecast - by Type
- 6. Global Smart Card Industry Analysis, Insights and Forecast, 2021-2033
- 6.1. Market Analysis, Insights and Forecast - by Type
- 6.1.1. Contact-based
- 6.1.2. Contact-Less
- 6.2. Market Analysis, Insights and Forecast - by End-user Vertical
- 6.2.1. BFSI
- 6.2.2. IT & Telecommunication
- 6.2.3. Government
- 6.2.4. Transportation
- 6.2.5. Other
- 6.1. Market Analysis, Insights and Forecast - by Type
- 7. North America Smart Card Industry Analysis, Insights and Forecast, 2020-2032
- 7.1. Market Analysis, Insights and Forecast - by Type
- 7.1.1. Contact-based
- 7.1.2. Contact-Less
- 7.2. Market Analysis, Insights and Forecast - by End-user Vertical
- 7.2.1. BFSI
- 7.2.2. IT & Telecommunication
- 7.2.3. Government
- 7.2.4. Transportation
- 7.2.5. Other
- 7.1. Market Analysis, Insights and Forecast - by Type
- 8. Europe Smart Card Industry Analysis, Insights and Forecast, 2020-2032
- 8.1. Market Analysis, Insights and Forecast - by Type
- 8.1.1. Contact-based
- 8.1.2. Contact-Less
- 8.2. Market Analysis, Insights and Forecast - by End-user Vertical
- 8.2.1. BFSI
- 8.2.2. IT & Telecommunication
- 8.2.3. Government
- 8.2.4. Transportation
- 8.2.5. Other
- 8.1. Market Analysis, Insights and Forecast - by Type
- 9. Asia Pacific Smart Card Industry Analysis, Insights and Forecast, 2020-2032
- 9.1. Market Analysis, Insights and Forecast - by Type
- 9.1.1. Contact-based
- 9.1.2. Contact-Less
- 9.2. Market Analysis, Insights and Forecast - by End-user Vertical
- 9.2.1. BFSI
- 9.2.2. IT & Telecommunication
- 9.2.3. Government
- 9.2.4. Transportation
- 9.2.5. Other
- 9.1. Market Analysis, Insights and Forecast - by Type
- 10. Rest of the World Smart Card Industry Analysis, Insights and Forecast, 2020-2032
- 10.1. Market Analysis, Insights and Forecast - by Type
- 10.1.1. Contact-based
- 10.1.2. Contact-Less
- 10.2. Market Analysis, Insights and Forecast - by End-user Vertical
- 10.2.1. BFSI
- 10.2.2. IT & Telecommunication
- 10.2.3. Government
- 10.2.4. Transportation
- 10.2.5. Other
- 10.1. Market Analysis, Insights and Forecast - by Type
- 11. Competitive Analysis
- 11.1. Company Profiles
- 11.1.1 HID Global Corporation (Assa Abloy AB)
- 11.1.1.1. Company Overview
- 11.1.1.2. Products
- 11.1.1.3. Company Financials
- 11.1.1.4. SWOT Analysis
- 11.1.2 Infineon Technologies AG
- 11.1.2.1. Company Overview
- 11.1.2.2. Products
- 11.1.2.3. Company Financials
- 11.1.2.4. SWOT Analysis
- 11.1.3 IDEMIA France SAS
- 11.1.3.1. Company Overview
- 11.1.3.2. Products
- 11.1.3.3. Company Financials
- 11.1.3.4. SWOT Analysis
- 11.1.4 KONA I Co Ltd
- 11.1.4.1. Company Overview
- 11.1.4.2. Products
- 11.1.4.3. Company Financials
- 11.1.4.4. SWOT Analysis
- 11.1.5 CPI Card Group Inc
- 11.1.5.1. Company Overview
- 11.1.5.2. Products
- 11.1.5.3. Company Financials
- 11.1.5.4. SWOT Analysis
- 11.1.6 Samsung Electronics Co Ltd
- 11.1.6.1. Company Overview
- 11.1.6.2. Products
- 11.1.6.3. Company Financials
- 11.1.6.4. SWOT Analysis
- 11.1.7 Gemalto NV (Thales Group)
- 11.1.7.1. Company Overview
- 11.1.7.2. Products
- 11.1.7.3. Company Financials
- 11.1.7.4. SWOT Analysis
- 11.1.8 Watchdata Technologies
- 11.1.8.1. Company Overview
- 11.1.8.2. Products
- 11.1.8.3. Company Financials
- 11.1.8.4. SWOT Analysis
- 11.1.9 Secura Key
- 11.1.9.1. Company Overview
- 11.1.9.2. Products
- 11.1.9.3. Company Financials
- 11.1.9.4. SWOT Analysis
- 11.1.10 Fingerprint Cards AB
- 11.1.10.1. Company Overview
- 11.1.10.2. Products
- 11.1.10.3. Company Financials
- 11.1.10.4. SWOT Analysis
- 11.1.11 Alioth LLC
- 11.1.11.1. Company Overview
- 11.1.11.2. Products
- 11.1.11.3. Company Financials
- 11.1.11.4. SWOT Analysis
- 11.1.12 CardLogix Corporation
- 11.1.12.1. Company Overview
- 11.1.12.2. Products
- 11.1.12.3. Company Financials
- 11.1.12.4. SWOT Analysis
- 11.1.13 Giesecke & Devrient GmbH (MC Familiengesellschaft mbH)
- 11.1.13.1. Company Overview
- 11.1.13.2. Products
- 11.1.13.3. Company Financials
- 11.1.13.4. SWOT Analysis
- 11.1.14 Bundesdruckerei GmbH
- 11.1.14.1. Company Overview
- 11.1.14.2. Products
- 11.1.14.3. Company Financials
- 11.1.14.4. SWOT Analysis
- 11.1.15 IntelCav
- 11.1.15.1. Company Overview
- 11.1.15.2. Products
- 11.1.15.3. Company Financials
- 11.1.15.4. SWOT Analysis
- 11.1.1 HID Global Corporation (Assa Abloy AB)
- 11.2. Market Entropy
- 11.2.1 Company's Key Areas Served
- 11.2.2 Recent Developments
- 11.3. Company Market Share Analysis 2025
- 11.3.1 Top 5 Companies Market Share Analysis
- 11.3.2 Top 3 Companies Market Share Analysis
- 11.4. List of Potential Customers
- 12. Research Methodology
List of Figures
- Figure 1: Global Smart Card Industry Revenue Breakdown (Million, %) by Region 2025 & 2033
- Figure 2: Global Smart Card Industry Volume Breakdown (K Unit, %) by Region 2025 & 2033
- Figure 3: North America Smart Card Industry Revenue (Million), by Type 2025 & 2033
- Figure 4: North America Smart Card Industry Volume (K Unit), by Type 2025 & 2033
- Figure 5: North America Smart Card Industry Revenue Share (%), by Type 2025 & 2033
- Figure 6: North America Smart Card Industry Volume Share (%), by Type 2025 & 2033
- Figure 7: North America Smart Card Industry Revenue (Million), by End-user Vertical 2025 & 2033
- Figure 8: North America Smart Card Industry Volume (K Unit), by End-user Vertical 2025 & 2033
- Figure 9: North America Smart Card Industry Revenue Share (%), by End-user Vertical 2025 & 2033
- Figure 10: North America Smart Card Industry Volume Share (%), by End-user Vertical 2025 & 2033
- Figure 11: North America Smart Card Industry Revenue (Million), by Country 2025 & 2033
- Figure 12: North America Smart Card Industry Volume (K Unit), by Country 2025 & 2033
- Figure 13: North America Smart Card Industry Revenue Share (%), by Country 2025 & 2033
- Figure 14: North America Smart Card Industry Volume Share (%), by Country 2025 & 2033
- Figure 15: Europe Smart Card Industry Revenue (Million), by Type 2025 & 2033
- Figure 16: Europe Smart Card Industry Volume (K Unit), by Type 2025 & 2033
- Figure 17: Europe Smart Card Industry Revenue Share (%), by Type 2025 & 2033
- Figure 18: Europe Smart Card Industry Volume Share (%), by Type 2025 & 2033
- Figure 19: Europe Smart Card Industry Revenue (Million), by End-user Vertical 2025 & 2033
- Figure 20: Europe Smart Card Industry Volume (K Unit), by End-user Vertical 2025 & 2033
- Figure 21: Europe Smart Card Industry Revenue Share (%), by End-user Vertical 2025 & 2033
- Figure 22: Europe Smart Card Industry Volume Share (%), by End-user Vertical 2025 & 2033
- Figure 23: Europe Smart Card Industry Revenue (Million), by Country 2025 & 2033
- Figure 24: Europe Smart Card Industry Volume (K Unit), by Country 2025 & 2033
- Figure 25: Europe Smart Card Industry Revenue Share (%), by Country 2025 & 2033
- Figure 26: Europe Smart Card Industry Volume Share (%), by Country 2025 & 2033
- Figure 27: Asia Pacific Smart Card Industry Revenue (Million), by Type 2025 & 2033
- Figure 28: Asia Pacific Smart Card Industry Volume (K Unit), by Type 2025 & 2033
- Figure 29: Asia Pacific Smart Card Industry Revenue Share (%), by Type 2025 & 2033
- Figure 30: Asia Pacific Smart Card Industry Volume Share (%), by Type 2025 & 2033
- Figure 31: Asia Pacific Smart Card Industry Revenue (Million), by End-user Vertical 2025 & 2033
- Figure 32: Asia Pacific Smart Card Industry Volume (K Unit), by End-user Vertical 2025 & 2033
- Figure 33: Asia Pacific Smart Card Industry Revenue Share (%), by End-user Vertical 2025 & 2033
- Figure 34: Asia Pacific Smart Card Industry Volume Share (%), by End-user Vertical 2025 & 2033
- Figure 35: Asia Pacific Smart Card Industry Revenue (Million), by Country 2025 & 2033
- Figure 36: Asia Pacific Smart Card Industry Volume (K Unit), by Country 2025 & 2033
- Figure 37: Asia Pacific Smart Card Industry Revenue Share (%), by Country 2025 & 2033
- Figure 38: Asia Pacific Smart Card Industry Volume Share (%), by Country 2025 & 2033
- Figure 39: Rest of the World Smart Card Industry Revenue (Million), by Type 2025 & 2033
- Figure 40: Rest of the World Smart Card Industry Volume (K Unit), by Type 2025 & 2033
- Figure 41: Rest of the World Smart Card Industry Revenue Share (%), by Type 2025 & 2033
- Figure 42: Rest of the World Smart Card Industry Volume Share (%), by Type 2025 & 2033
- Figure 43: Rest of the World Smart Card Industry Revenue (Million), by End-user Vertical 2025 & 2033
- Figure 44: Rest of the World Smart Card Industry Volume (K Unit), by End-user Vertical 2025 & 2033
- Figure 45: Rest of the World Smart Card Industry Revenue Share (%), by End-user Vertical 2025 & 2033
- Figure 46: Rest of the World Smart Card Industry Volume Share (%), by End-user Vertical 2025 & 2033
- Figure 47: Rest of the World Smart Card Industry Revenue (Million), by Country 2025 & 2033
- Figure 48: Rest of the World Smart Card Industry Volume (K Unit), by Country 2025 & 2033
- Figure 49: Rest of the World Smart Card Industry Revenue Share (%), by Country 2025 & 2033
- Figure 50: Rest of the World Smart Card Industry Volume Share (%), by Country 2025 & 2033
List of Tables
- Table 1: Global Smart Card Industry Revenue Million Forecast, by Type 2020 & 2033
- Table 2: Global Smart Card Industry Volume K Unit Forecast, by Type 2020 & 2033
- Table 3: Global Smart Card Industry Revenue Million Forecast, by End-user Vertical 2020 & 2033
- Table 4: Global Smart Card Industry Volume K Unit Forecast, by End-user Vertical 2020 & 2033
- Table 5: Global Smart Card Industry Revenue Million Forecast, by Region 2020 & 2033
- Table 6: Global Smart Card Industry Volume K Unit Forecast, by Region 2020 & 2033
- Table 7: Global Smart Card Industry Revenue Million Forecast, by Type 2020 & 2033
- Table 8: Global Smart Card Industry Volume K Unit Forecast, by Type 2020 & 2033
- Table 9: Global Smart Card Industry Revenue Million Forecast, by End-user Vertical 2020 & 2033
- Table 10: Global Smart Card Industry Volume K Unit Forecast, by End-user Vertical 2020 & 2033
- Table 11: Global Smart Card Industry Revenue Million Forecast, by Country 2020 & 2033
- Table 12: Global Smart Card Industry Volume K Unit Forecast, by Country 2020 & 2033
- Table 13: United States Smart Card Industry Revenue (Million) Forecast, by Application 2020 & 2033
- Table 14: United States Smart Card Industry Volume (K Unit) Forecast, by Application 2020 & 2033
- Table 15: Canada Smart Card Industry Revenue (Million) Forecast, by Application 2020 & 2033
- Table 16: Canada Smart Card Industry Volume (K Unit) Forecast, by Application 2020 & 2033
- Table 17: Global Smart Card Industry Revenue Million Forecast, by Type 2020 & 2033
- Table 18: Global Smart Card Industry Volume K Unit Forecast, by Type 2020 & 2033
- Table 19: Global Smart Card Industry Revenue Million Forecast, by End-user Vertical 2020 & 2033
- Table 20: Global Smart Card Industry Volume K Unit Forecast, by End-user Vertical 2020 & 2033
- Table 21: Global Smart Card Industry Revenue Million Forecast, by Country 2020 & 2033
- Table 22: Global Smart Card Industry Volume K Unit Forecast, by Country 2020 & 2033
- Table 23: United Kingdom Smart Card Industry Revenue (Million) Forecast, by Application 2020 & 2033
- Table 24: United Kingdom Smart Card Industry Volume (K Unit) Forecast, by Application 2020 & 2033
- Table 25: Germany Smart Card Industry Revenue (Million) Forecast, by Application 2020 & 2033
- Table 26: Germany Smart Card Industry Volume (K Unit) Forecast, by Application 2020 & 2033
- Table 27: France Smart Card Industry Revenue (Million) Forecast, by Application 2020 & 2033
- Table 28: France Smart Card Industry Volume (K Unit) Forecast, by Application 2020 & 2033
- Table 29: Rest of Europe Smart Card Industry Revenue (Million) Forecast, by Application 2020 & 2033
- Table 30: Rest of Europe Smart Card Industry Volume (K Unit) Forecast, by Application 2020 & 2033
- Table 31: Global Smart Card Industry Revenue Million Forecast, by Type 2020 & 2033
- Table 32: Global Smart Card Industry Volume K Unit Forecast, by Type 2020 & 2033
- Table 33: Global Smart Card Industry Revenue Million Forecast, by End-user Vertical 2020 & 2033
- Table 34: Global Smart Card Industry Volume K Unit Forecast, by End-user Vertical 2020 & 2033
- Table 35: Global Smart Card Industry Revenue Million Forecast, by Country 2020 & 2033
- Table 36: Global Smart Card Industry Volume K Unit Forecast, by Country 2020 & 2033
- Table 37: China Smart Card Industry Revenue (Million) Forecast, by Application 2020 & 2033
- Table 38: China Smart Card Industry Volume (K Unit) Forecast, by Application 2020 & 2033
- Table 39: Japan Smart Card Industry Revenue (Million) Forecast, by Application 2020 & 2033
- Table 40: Japan Smart Card Industry Volume (K Unit) Forecast, by Application 2020 & 2033
- Table 41: India Smart Card Industry Revenue (Million) Forecast, by Application 2020 & 2033
- Table 42: India Smart Card Industry Volume (K Unit) Forecast, by Application 2020 & 2033
- Table 43: Rest of Asia Pacific Smart Card Industry Revenue (Million) Forecast, by Application 2020 & 2033
- Table 44: Rest of Asia Pacific Smart Card Industry Volume (K Unit) Forecast, by Application 2020 & 2033
- Table 45: Global Smart Card Industry Revenue Million Forecast, by Type 2020 & 2033
- Table 46: Global Smart Card Industry Volume K Unit Forecast, by Type 2020 & 2033
- Table 47: Global Smart Card Industry Revenue Million Forecast, by End-user Vertical 2020 & 2033
- Table 48: Global Smart Card Industry Volume K Unit Forecast, by End-user Vertical 2020 & 2033
- Table 49: Global Smart Card Industry Revenue Million Forecast, by Country 2020 & 2033
- Table 50: Global Smart Card Industry Volume K Unit Forecast, by Country 2020 & 2033
Frequently Asked Questions
1. What is the projected Compound Annual Growth Rate (CAGR) of the Smart Card Industry?
The projected CAGR is approximately 8.59%.
2. Which companies are prominent players in the Smart Card Industry?
Key companies in the market include HID Global Corporation (Assa Abloy AB), Infineon Technologies AG, IDEMIA France SAS, KONA I Co Ltd, CPI Card Group Inc, Samsung Electronics Co Ltd, Gemalto NV (Thales Group), Watchdata Technologies, Secura Key, Fingerprint Cards AB, Alioth LLC, CardLogix Corporation, Giesecke & Devrient GmbH (MC Familiengesellschaft mbH), Bundesdruckerei GmbH, IntelCav.
3. What are the main segments of the Smart Card Industry?
The market segments include Type, End-user Vertical.
4. Can you provide details about the market size?
The market size is estimated to be USD 18.69 Million as of 2022.
5. What are some drivers contributing to market growth?
Growing Deployment in Personal Identification and Access Control Applications; Extensive Use in Travel Identity and Transportation; Growing Demand for Contactless Payments.
6. What are the notable trends driving market growth?
Growing Deployment in Personal Identification and Access Control Applications to Drive the Market Growth.
7. Are there any restraints impacting market growth?
Privacy and Security Issues and Standardization concerns.
8. Can you provide examples of recent developments in the market?
April 2023: The GoSmart National Common Mobility Card was launched for passengers using the Kanpur metro in India. The NCMC card was initially introduced in Uttar Pradesh by the Kanpur Metro. The primary advantage of this card is that it is an interchangeable transport card, meaning that it may be used for other NCMC-compliant retail, parking, metro, bus, and other transportation services throughout the nation. Travelers can easily traverse the entire nation with the NCMC card. Along with facilitating smooth mobility, this also helps travelers save time and energy.
9. What pricing options are available for accessing the report?
Pricing options include single-user, multi-user, and enterprise licenses priced at USD 4750, USD 5250, and USD 8750 respectively.
10. Is the market size provided in terms of value or volume?
The market size is provided in terms of value, measured in Million and volume, measured in K Unit.
11. Are there any specific market keywords associated with the report?
Yes, the market keyword associated with the report is "Smart Card Industry," which aids in identifying and referencing the specific market segment covered.
12. How do I determine which pricing option suits my needs best?
The pricing options vary based on user requirements and access needs. Individual users may opt for single-user licenses, while businesses requiring broader access may choose multi-user or enterprise licenses for cost-effective access to the report.
13. Are there any additional resources or data provided in the Smart Card Industry report?
While the report offers comprehensive insights, it's advisable to review the specific contents or supplementary materials provided to ascertain if additional resources or data are available.
14. How can I stay updated on further developments or reports in the Smart Card Industry?
To stay informed about further developments, trends, and reports in the Smart Card Industry, consider subscribing to industry newsletters, following relevant companies and organizations, or regularly checking reputable industry news sources and publications.
Methodology
Step 1 - Identification of Relevant Samples Size from Population Database


Step 2 - Approaches for Defining Global Market Size (Value, Volume* & Price*)

Note*: In applicable scenarios
Step 3 - Data Sources
Primary Research
- Web Analytics
- Survey Reports
- Research Institute
- Latest Research Reports
- Opinion Leaders
Secondary Research
- Annual Reports
- White Paper
- Latest Press Release
- Industry Association
- Paid Database
- Investor Presentations

Step 4 - Data Triangulation
Involves using different sources of information in order to increase the validity of a study
These sources are likely to be stakeholders in a program - participants, other researchers, program staff, other community members, and so on.
Then we put all data in single framework & apply various statistical tools to find out the dynamic on the market.
During the analysis stage, feedback from the stakeholder groups would be compared to determine areas of agreement as well as areas of divergence