

Key Insights
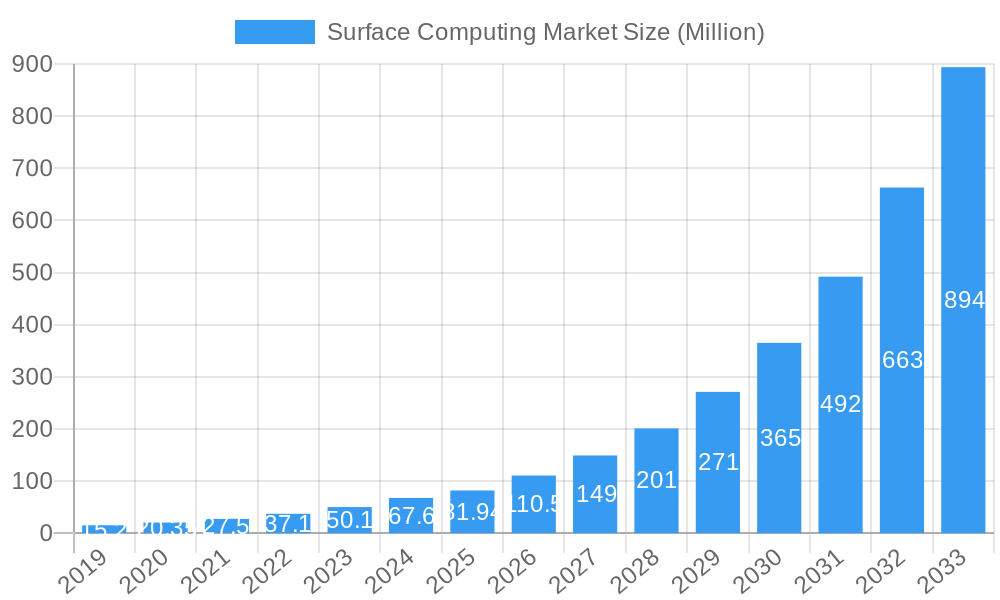
The global Surface Computing Market is poised for explosive growth, projected to reach an impressive $81.94 million by 2025, driven by a phenomenal Compound Annual Growth Rate (CAGR) of 35.23%. This remarkable trajectory is fueled by a confluence of technological advancements and evolving consumer and enterprise demands. Key drivers include the increasing integration of touch and interactive technologies across diverse applications, from retail point-of-sale systems to sophisticated healthcare diagnostic tools. The demand for immersive and intuitive user experiences, facilitated by advancements in flat and curved display technologies, is a significant catalyst. Furthermore, the growing adoption of surface computing in commercial spaces for interactive advertising and in educational institutions for collaborative learning environments underscores its versatility and expanding market penetration. The market's robust growth is further amplified by continuous innovation in components such as advanced processors, high-resolution screens, and sophisticated sensors, all contributing to more powerful and versatile surface computing solutions.
Surface Computing Market Market Size (In Million)
The market's potential is further illuminated by the dynamic segmentation across touch interfaces and vision capabilities. Multi-touch and multi-user functionalities are becoming standard, fostering collaborative and engaging interactions. The growing sophistication of 3D vision capabilities within surface computing is opening new frontiers in entertainment and specialized commercial applications. While the market benefits from these strong growth drivers, potential restraints such as the initial cost of implementation for certain advanced solutions and the need for ongoing software development to leverage full capabilities could pose challenges. However, the overarching trend towards digitalization and the pursuit of enhanced user interaction across virtually every industry segment strongly indicate a future where surface computing is not just a niche technology but an integral part of our digital landscape. Key players like Samsung Electronic Co Ltd, LG Electronics Inc, Microsoft Corporation, and Apple Inc are at the forefront of this innovation, shaping the market's future with their continuous investment in research and development.
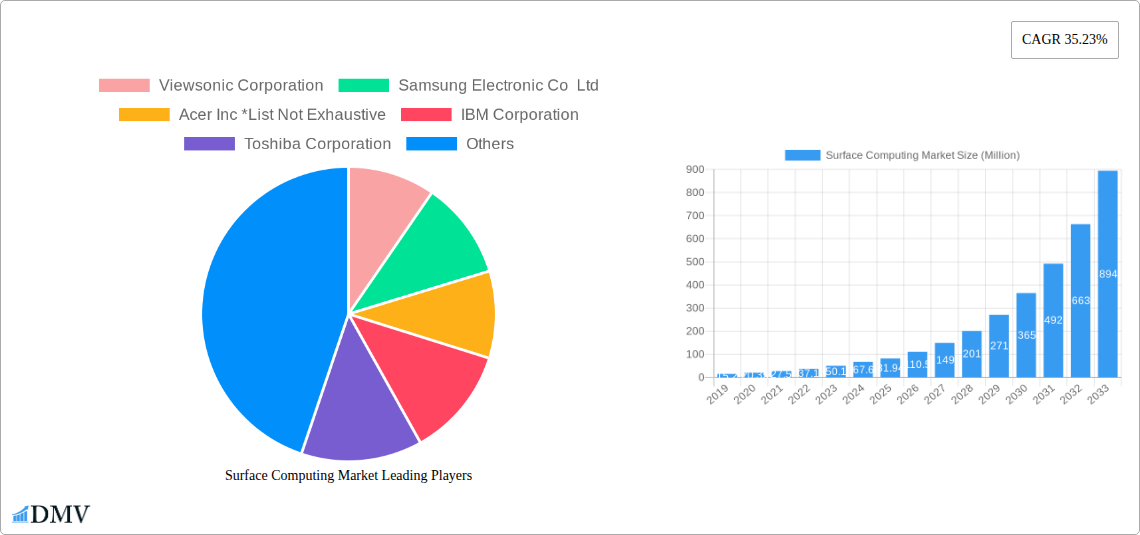
Surface Computing Market Company Market Share
Dive deep into the dynamic Surface Computing Market with our definitive report, meticulously crafted for stakeholders seeking unparalleled insights and strategic advantage. This analysis provides an in-depth examination of market composition, industry evolution, regional dominance, product innovations, growth drivers, obstacles, and future opportunities, spanning the crucial period from 2019 to 2033. Our comprehensive approach leverages cutting-edge AI, advanced analytics, and expert market intelligence to deliver actionable data. This report meticulously covers the Base Year (2025), Estimated Year (2025), and the Forecast Period (2025–2033), building upon extensive Historical Data (2019–2024).
Surface Computing Market Market Composition & Trends
The Surface Computing Market exhibits a moderate concentration, driven by significant investments in AI integration and advanced display technologies. Innovation catalysts are primarily fueled by ongoing research and development in multi-touch interfaces, 3D vision capabilities, and the seamless integration of hardware and software components. The regulatory landscape, while evolving, generally supports technological advancement, particularly in sectors like healthcare and education. Substitute products, though present, are increasingly challenged by the superior user experience and versatility offered by sophisticated surface computing solutions. End-user profiles are diverse, ranging from individuals seeking enhanced entertainment and productivity to businesses revolutionizing retail, hospitality, and commercial operations through interactive displays and AI-powered interfaces. Merger and acquisition (M&A) activities are expected to accelerate as major players consolidate their market positions and acquire innovative technologies. For instance, recent M&A deals within the broader AI and computing hardware sectors have seen valuations in the hundreds of millions, indicating a high appetite for strategic consolidation. The market share distribution is dynamic, with key players continuously vying for dominance through technological differentiation and aggressive market penetration strategies.
Surface Computing Market Industry Evolution
The Surface Computing Market has witnessed a transformative evolution, marked by exponential growth trajectories and profound technological advancements that have fundamentally reshaped user interaction and application possibilities. From its nascent stages, the market has been propelled by an insatiable demand for more intuitive, immersive, and collaborative computing experiences. Early iterations focused on basic touch functionalities, primarily within the flat display segment, catering to niche applications. However, the period between 2019 and 2024 saw an accelerated shift towards multi-touch capabilities, sophisticated sensor integration, and the advent of 3D vision, broadening the appeal across a wider array of industries.
The integration of AI, as evidenced by recent industry developments, represents a pivotal inflection point. This has not only enhanced the performance and speed of AI tools but has also fostered a new generation of AI PCs and tablets designed for demanding workloads. The Surface Laptop 6, for example, embodies this evolution, offering elite performance and unlocking the full potential of AI-driven applications like Microsoft Copilot. This signifies a move beyond mere input devices to intelligent platforms that actively enhance productivity and user engagement.
Consumer demand has mirrored these technological leaps, with a growing preference for seamless, gesture-based interactions, personalized experiences, and applications that leverage the unique capabilities of surface computing. The adoption metrics for multi-user and 3D interactive systems have shown robust year-over-year growth, indicating a clear market readiness for more advanced solutions. Furthermore, the increasing affordability of key components, such as advanced processors and high-resolution screens, has democratized access to surface computing technology, driving adoption in sectors previously considered out of reach, such as education and small-scale retail. The overall market growth rate, projected to exceed 15% annually over the forecast period, underscores the sustained momentum and the vast untapped potential of this evolving industry.
Leading Regions, Countries, or Segments in Surface Computing Market
North America currently leads the Surface Computing Market, driven by a confluence of factors including robust technological innovation, significant investment in AI-driven solutions, and a strong consumer appetite for cutting-edge devices. The region's dominance is further amplified by its extensive adoption across key application sectors, particularly in commercial settings, entertainment, and the rapidly expanding education technology landscape. The presence of major technology giants with significant R&D capabilities, such as Microsoft and Apple, acts as a powerful catalyst for both product development and market penetration.
Within the market segments, the Flat Display type holds a commanding share, attributed to its versatility, cost-effectiveness, and widespread integration across various devices and applications. This segment benefits from continuous advancements in screen resolution, touch sensitivity, and durability.
In terms of Touch technology, Multi-touch remains the most dominant, enabling sophisticated gesture controls and interactive experiences that are essential for modern applications. However, the increasing demand for collaborative environments is driving significant growth in the Multi-user touch segment, particularly in enterprise and educational settings.
From a Vision perspective, Two Dimensional interaction continues to be the prevalent standard due to its broad applicability. Nevertheless, the Three Dimensional vision segment is experiencing rapid expansion, fueled by advancements in AR/VR integration and immersive content creation, signaling a strong future growth potential.
Analyzing the Components segment, Screens and Processors are the foundational pillars, witnessing continuous innovation to deliver higher performance and better visual fidelity. Sensors and Software are increasingly critical for enabling advanced functionalities like gesture recognition and AI integration, driving their market importance.
The Application segment sees Commercial and Entertainment sectors as major growth engines. The retail industry is rapidly adopting interactive displays for customer engagement and inventory management. The healthcare sector is increasingly leveraging surface computing for improved diagnostics, patient interaction, and medical training. The Advertisement sector is also seeing a surge in interactive digital signage solutions powered by surface computing.
- Key Drivers in North America:
- High R&D spending by major technology firms.
- Early adoption of AI and advanced computing technologies.
- Strong presence of leading application sectors like commercial and entertainment.
- Favorable government initiatives supporting digital transformation.
- Dominance Factors for Flat Displays:
- Cost-effectiveness and scalability.
- Wide range of form factors and integration possibilities.
- Maturity of manufacturing processes.
- Growth Drivers for Multi-touch and Multi-user:
- Demand for enhanced user collaboration and engagement.
- Increasing use in interactive kiosks, education tools, and enterprise solutions.
- Emerging Trends for 3D Vision:
- Integration with AR/VR technologies.
- Advancements in gesture recognition and spatial computing.
- Component Innovations:
- Development of more energy-efficient and powerful processors.
- Introduction of advanced sensor arrays for richer data capture.
- Sophisticated software algorithms for AI-driven interactions.
- Application Segment Expansion:
- Transformative use in retail analytics and personalized customer experiences.
- Revolutionizing patient care and medical diagnostics in healthcare.
- Creating immersive advertising campaigns and interactive brand experiences.
Surface Computing Market Product Innovations
Surface computing is witnessing a wave of innovative product advancements, focusing on enhanced interactivity and intelligence. The integration of AI chips directly into PCs and tablets, as recently highlighted by Microsoft, allows for faster on-device AI processing, revolutionizing user experiences by enabling AI tools and chatbots to run significantly quicker without relying solely on internet connectivity. This technological leap enhances performance metrics by reducing latency and improving responsiveness across applications. Furthermore, innovations in sensor technology are enabling more sophisticated gesture recognition and environmental awareness, paving the way for truly context-aware computing. The development of more robust and thinner display technologies is also a key area of innovation, contributing to sleeker device designs and broader application possibilities in areas like interactive retail displays and advanced automotive interfaces. These advancements collectively push the boundaries of user interaction, making surface computing more intuitive, powerful, and pervasive.
Propelling Factors for Surface Computing Market Growth
The Surface Computing Market is propelled by several key factors, primarily technological advancements, evolving consumer demands, and strategic industry investments. The relentless pace of innovation in display technology, particularly for flat and curved displays, coupled with the miniaturization and increased power of processors and sensors, provides a robust foundation for new product development. The growing consumer preference for intuitive, touch-based interfaces and immersive experiences in entertainment, education, and commercial applications significantly fuels market expansion. Furthermore, the increasing adoption of AI technologies, which enhances the intelligence and responsiveness of surface computing devices, is a critical growth catalyst. Investments from major technology companies in developing next-generation AI PCs and integrated AI solutions are actively shaping the market's trajectory, pushing the boundaries of what is possible and creating new avenues for growth.
Obstacles in the Surface Computing Market Market
Despite its promising growth, the Surface Computing Market faces several obstacles. High initial development and manufacturing costs for advanced components, such as high-resolution 3D displays and sophisticated sensor arrays, can limit widespread adoption, particularly in price-sensitive markets. The complexity of integrating diverse software and hardware components to ensure seamless user experience remains a significant challenge, often requiring extensive optimization and testing. Additionally, concerns regarding data privacy and security associated with interactive and sensor-equipped devices can create user hesitancy. Emerging regulatory frameworks concerning data handling and digital accessibility may also pose compliance challenges for manufacturers and developers. Supply chain disruptions for critical components can impact production volumes and timelines, potentially hindering market expansion.
Future Opportunities in Surface Computing Market
The future of the Surface Computing Market is brimming with opportunities. The burgeoning Internet of Things (IoT) ecosystem presents a vast landscape for integrating surface computing interfaces into everyday objects and environments, creating smart homes, connected cities, and intelligent industrial settings. The continued advancement of augmented reality (AR) and virtual reality (VR) technologies offers significant potential for more immersive and interactive 3D surface computing experiences, particularly in gaming, training, and design. The growing demand for personalized and adaptive learning tools in education opens up avenues for interactive surface-based educational platforms. Furthermore, the expansion of healthcare applications, from remote patient monitoring to surgical simulation, provides substantial growth potential. The development of more energy-efficient and durable components will also enable wider deployment in mobile and outdoor applications.
Major Players in the Surface Computing Market Ecosystem
- Viewsonic Corporation
- Samsung Electronic Co Ltd
- Acer Inc
- IBM Corporation
- Toshiba Corporation
- LG Electronics Inc
- Fujitsu Ltd
- Planar Systems Inc
- Microsoft Corporation
- Dell Inc
- 3M Co
- Qualcomm Technologies Inc
- Hewlett-Packard Ltd
- Lenovo Group Ltd
- Apple Inc
- Panasonic Corporation
- Intel Corporation
- Sony Corporation
Key Developments in Surface Computing Market Industry
- May 2024: Microsoft announced new computers with the company’s artificial intelligence tech built directly into them, boosting the race among tech giants to push out AI tools to the public and adding computer chips that are tailored to run AI technology to the company’s PCs and tablets will make AI tools and features run faster than if the technology runs through an internet connection, as most chatbots.
- March 2024: Microsoft announced the release of two new AI-powered PCs, advances in its management portal, and the commercial availability of its Microsoft Adaptive Accessories and Surface Laptop 6 elevates business with an elite level of performance, power, and sleek design. Built for demanding workloads, Surface Laptop 6 unleashes a new era of productivity. With Surface Laptop 6, employees get the benefits of an AI PC that accelerates Microsoft Copilot experiences.
Strategic Surface Computing Market Market Forecast
The strategic forecast for the Surface Computing Market indicates robust growth, driven by the accelerating integration of AI and advanced display technologies. The increasing demand for immersive and interactive user experiences across sectors like entertainment, retail, and education will continue to be a primary growth catalyst. The continuous development of more powerful processors, sophisticated sensors, and intuitive software will unlock new application frontiers, particularly in areas like the Internet of Things (IoT) and augmented/virtual reality. Strategic investments in R&D by key industry players, coupled with the growing market acceptance of AI-powered devices, are expected to fuel significant market expansion. The market’s trajectory suggests a future where surface computing becomes increasingly ubiquitous, seamlessly integrated into our daily lives and professional environments.
Surface Computing Market Segmentation
-
1. Type
- 1.1. Flat Display
- 1.2. Curved Display
-
1.3. Components
- 1.3.1. Screen
- 1.3.2. Camera
- 1.3.3. Sensor
- 1.3.4. Processor
- 1.3.5. Software
- 1.3.6. Projector
- 1.3.7. Other Components
-
2. Touch
- 2.1. Single Touch
- 2.2. Multi-touch
- 2.3. Multi-user
- 2.4. Other Touches
-
3. Vision
- 3.1. Two Dimensional
- 3.2. Three Dimensional
-
4. Application
- 4.1. Entertainment
- 4.2. Retail
- 4.3. Hospitality
- 4.4. Healthcare
- 4.5. Commercial
- 4.6. Advertisement
- 4.7. Automotive
- 4.8. Education
- 4.9. Other Applications
Surface Computing Market Segmentation By Geography
-
1. North America
- 1.1. United States
- 1.2. Canada
-
2. Europe
- 2.1. United Kingdom
- 2.2. Germany
- 2.3. France
-
3. Asia
- 3.1. China
- 3.2. Japan
- 3.3. India
- 3.4. Australia and New Zealand
-
4. Latin America
- 4.1. Mexico
- 4.2. Brazil
- 4.3. Argentina
-
5. Middle East and Africa
- 5.1. Saudi Arabia
- 5.2. United Arab Emirates
- 5.3. South Africa
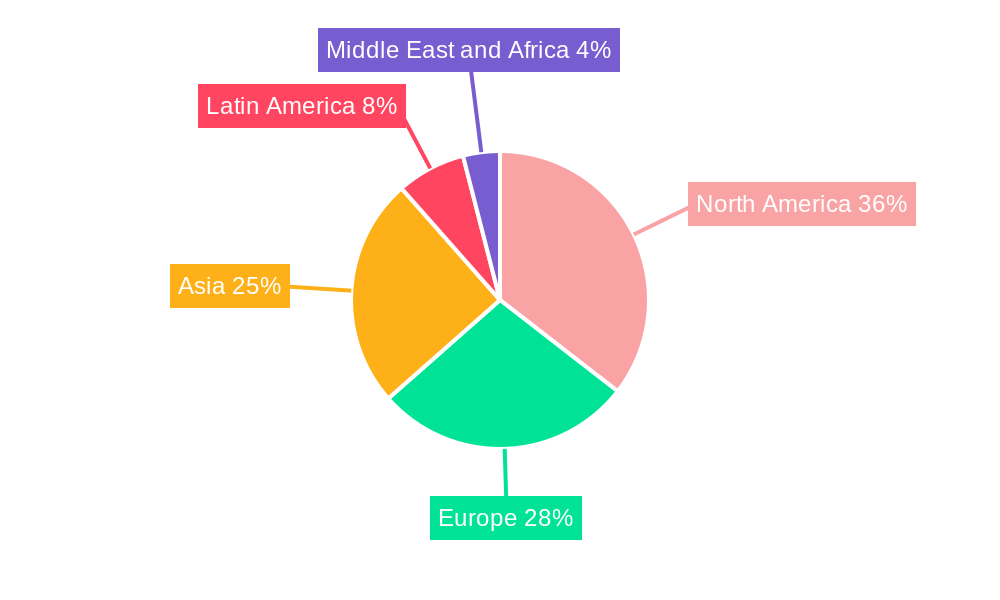
Surface Computing Market Regional Market Share
Geographic Coverage of Surface Computing Market
Surface Computing Market REPORT HIGHLIGHTS
| Aspects | Details |
|---|---|
| Study Period | 2020-2034 |
| Base Year | 2025 |
| Estimated Year | 2026 |
| Forecast Period | 2026-2034 |
| Historical Period | 2020-2025 |
| Growth Rate | CAGR of 35.23% from 2020-2034 |
| Segmentation |
|
Table of Contents
- 1. Introduction
- 1.1. Research Scope
- 1.2. Market Segmentation
- 1.3. Research Objective
- 1.4. Definitions and Assumptions
- 2. Executive Summary
- 2.1. Market Snapshot
- 3. Market Dynamics
- 3.1. Market Drivers
- 3.2. Market Restrains
- 3.3. Market Trends
- 3.4. Market Opportunities
- 4. Market Factor Analysis
- 4.1. Porters Five Forces
- 4.1.1. Bargaining Power of Suppliers
- 4.1.2. Bargaining Power of Buyers
- 4.1.3. Threat of New Entrants
- 4.1.4. Threat of Substitutes
- 4.1.5. Competitive Rivalry
- 4.2. PESTEL analysis
- 4.3. BCG Analysis
- 4.3.1. Stars (High Growth, High Market Share)
- 4.3.2. Cash Cows (Low Growth, High Market Share)
- 4.3.3. Question Mark (High Growth, Low Market Share)
- 4.3.4. Dogs (Low Growth, Low Market Share)
- 4.4. Ansoff Matrix Analysis
- 4.5. Supply Chain Analysis
- 4.6. Regulatory Landscape
- 4.7. Current Market Potential and Opportunity Assessment (TAM–SAM–SOM Framework)
- 4.8. DMV Analyst Note
- 4.1. Porters Five Forces
- 5. Market Analysis, Insights and Forecast 2021-2033
- 5.1. Market Analysis, Insights and Forecast - by Type
- 5.1.1. Flat Display
- 5.1.2. Curved Display
- 5.1.3. Components
- 5.1.3.1. Screen
- 5.1.3.2. Camera
- 5.1.3.3. Sensor
- 5.1.3.4. Processor
- 5.1.3.5. Software
- 5.1.3.6. Projector
- 5.1.3.7. Other Components
- 5.2. Market Analysis, Insights and Forecast - by Touch
- 5.2.1. Single Touch
- 5.2.2. Multi-touch
- 5.2.3. Multi-user
- 5.2.4. Other Touches
- 5.3. Market Analysis, Insights and Forecast - by Vision
- 5.3.1. Two Dimensional
- 5.3.2. Three Dimensional
- 5.4. Market Analysis, Insights and Forecast - by Application
- 5.4.1. Entertainment
- 5.4.2. Retail
- 5.4.3. Hospitality
- 5.4.4. Healthcare
- 5.4.5. Commercial
- 5.4.6. Advertisement
- 5.4.7. Automotive
- 5.4.8. Education
- 5.4.9. Other Applications
- 5.5. Market Analysis, Insights and Forecast - by Region
- 5.5.1. North America
- 5.5.2. Europe
- 5.5.3. Asia
- 5.5.4. Latin America
- 5.5.5. Middle East and Africa
- 5.1. Market Analysis, Insights and Forecast - by Type
- 6. Global Surface Computing Market Analysis, Insights and Forecast, 2021-2033
- 6.1. Market Analysis, Insights and Forecast - by Type
- 6.1.1. Flat Display
- 6.1.2. Curved Display
- 6.1.3. Components
- 6.1.3.1. Screen
- 6.1.3.2. Camera
- 6.1.3.3. Sensor
- 6.1.3.4. Processor
- 6.1.3.5. Software
- 6.1.3.6. Projector
- 6.1.3.7. Other Components
- 6.2. Market Analysis, Insights and Forecast - by Touch
- 6.2.1. Single Touch
- 6.2.2. Multi-touch
- 6.2.3. Multi-user
- 6.2.4. Other Touches
- 6.3. Market Analysis, Insights and Forecast - by Vision
- 6.3.1. Two Dimensional
- 6.3.2. Three Dimensional
- 6.4. Market Analysis, Insights and Forecast - by Application
- 6.4.1. Entertainment
- 6.4.2. Retail
- 6.4.3. Hospitality
- 6.4.4. Healthcare
- 6.4.5. Commercial
- 6.4.6. Advertisement
- 6.4.7. Automotive
- 6.4.8. Education
- 6.4.9. Other Applications
- 6.1. Market Analysis, Insights and Forecast - by Type
- 7. North America Surface Computing Market Analysis, Insights and Forecast, 2020-2032
- 7.1. Market Analysis, Insights and Forecast - by Type
- 7.1.1. Flat Display
- 7.1.2. Curved Display
- 7.1.3. Components
- 7.1.3.1. Screen
- 7.1.3.2. Camera
- 7.1.3.3. Sensor
- 7.1.3.4. Processor
- 7.1.3.5. Software
- 7.1.3.6. Projector
- 7.1.3.7. Other Components
- 7.2. Market Analysis, Insights and Forecast - by Touch
- 7.2.1. Single Touch
- 7.2.2. Multi-touch
- 7.2.3. Multi-user
- 7.2.4. Other Touches
- 7.3. Market Analysis, Insights and Forecast - by Vision
- 7.3.1. Two Dimensional
- 7.3.2. Three Dimensional
- 7.4. Market Analysis, Insights and Forecast - by Application
- 7.4.1. Entertainment
- 7.4.2. Retail
- 7.4.3. Hospitality
- 7.4.4. Healthcare
- 7.4.5. Commercial
- 7.4.6. Advertisement
- 7.4.7. Automotive
- 7.4.8. Education
- 7.4.9. Other Applications
- 7.1. Market Analysis, Insights and Forecast - by Type
- 8. Europe Surface Computing Market Analysis, Insights and Forecast, 2020-2032
- 8.1. Market Analysis, Insights and Forecast - by Type
- 8.1.1. Flat Display
- 8.1.2. Curved Display
- 8.1.3. Components
- 8.1.3.1. Screen
- 8.1.3.2. Camera
- 8.1.3.3. Sensor
- 8.1.3.4. Processor
- 8.1.3.5. Software
- 8.1.3.6. Projector
- 8.1.3.7. Other Components
- 8.2. Market Analysis, Insights and Forecast - by Touch
- 8.2.1. Single Touch
- 8.2.2. Multi-touch
- 8.2.3. Multi-user
- 8.2.4. Other Touches
- 8.3. Market Analysis, Insights and Forecast - by Vision
- 8.3.1. Two Dimensional
- 8.3.2. Three Dimensional
- 8.4. Market Analysis, Insights and Forecast - by Application
- 8.4.1. Entertainment
- 8.4.2. Retail
- 8.4.3. Hospitality
- 8.4.4. Healthcare
- 8.4.5. Commercial
- 8.4.6. Advertisement
- 8.4.7. Automotive
- 8.4.8. Education
- 8.4.9. Other Applications
- 8.1. Market Analysis, Insights and Forecast - by Type
- 9. Asia Surface Computing Market Analysis, Insights and Forecast, 2020-2032
- 9.1. Market Analysis, Insights and Forecast - by Type
- 9.1.1. Flat Display
- 9.1.2. Curved Display
- 9.1.3. Components
- 9.1.3.1. Screen
- 9.1.3.2. Camera
- 9.1.3.3. Sensor
- 9.1.3.4. Processor
- 9.1.3.5. Software
- 9.1.3.6. Projector
- 9.1.3.7. Other Components
- 9.2. Market Analysis, Insights and Forecast - by Touch
- 9.2.1. Single Touch
- 9.2.2. Multi-touch
- 9.2.3. Multi-user
- 9.2.4. Other Touches
- 9.3. Market Analysis, Insights and Forecast - by Vision
- 9.3.1. Two Dimensional
- 9.3.2. Three Dimensional
- 9.4. Market Analysis, Insights and Forecast - by Application
- 9.4.1. Entertainment
- 9.4.2. Retail
- 9.4.3. Hospitality
- 9.4.4. Healthcare
- 9.4.5. Commercial
- 9.4.6. Advertisement
- 9.4.7. Automotive
- 9.4.8. Education
- 9.4.9. Other Applications
- 9.1. Market Analysis, Insights and Forecast - by Type
- 10. Latin America Surface Computing Market Analysis, Insights and Forecast, 2020-2032
- 10.1. Market Analysis, Insights and Forecast - by Type
- 10.1.1. Flat Display
- 10.1.2. Curved Display
- 10.1.3. Components
- 10.1.3.1. Screen
- 10.1.3.2. Camera
- 10.1.3.3. Sensor
- 10.1.3.4. Processor
- 10.1.3.5. Software
- 10.1.3.6. Projector
- 10.1.3.7. Other Components
- 10.2. Market Analysis, Insights and Forecast - by Touch
- 10.2.1. Single Touch
- 10.2.2. Multi-touch
- 10.2.3. Multi-user
- 10.2.4. Other Touches
- 10.3. Market Analysis, Insights and Forecast - by Vision
- 10.3.1. Two Dimensional
- 10.3.2. Three Dimensional
- 10.4. Market Analysis, Insights and Forecast - by Application
- 10.4.1. Entertainment
- 10.4.2. Retail
- 10.4.3. Hospitality
- 10.4.4. Healthcare
- 10.4.5. Commercial
- 10.4.6. Advertisement
- 10.4.7. Automotive
- 10.4.8. Education
- 10.4.9. Other Applications
- 10.1. Market Analysis, Insights and Forecast - by Type
- 11. Middle East and Africa Surface Computing Market Analysis, Insights and Forecast, 2020-2032
- 11.1. Market Analysis, Insights and Forecast - by Type
- 11.1.1. Flat Display
- 11.1.2. Curved Display
- 11.1.3. Components
- 11.1.3.1. Screen
- 11.1.3.2. Camera
- 11.1.3.3. Sensor
- 11.1.3.4. Processor
- 11.1.3.5. Software
- 11.1.3.6. Projector
- 11.1.3.7. Other Components
- 11.2. Market Analysis, Insights and Forecast - by Touch
- 11.2.1. Single Touch
- 11.2.2. Multi-touch
- 11.2.3. Multi-user
- 11.2.4. Other Touches
- 11.3. Market Analysis, Insights and Forecast - by Vision
- 11.3.1. Two Dimensional
- 11.3.2. Three Dimensional
- 11.4. Market Analysis, Insights and Forecast - by Application
- 11.4.1. Entertainment
- 11.4.2. Retail
- 11.4.3. Hospitality
- 11.4.4. Healthcare
- 11.4.5. Commercial
- 11.4.6. Advertisement
- 11.4.7. Automotive
- 11.4.8. Education
- 11.4.9. Other Applications
- 11.1. Market Analysis, Insights and Forecast - by Type
- 12. Competitive Analysis
- 12.1. Company Profiles
- 12.1.1 Viewsonic Corporation
- 12.1.1.1. Company Overview
- 12.1.1.2. Products
- 12.1.1.3. Company Financials
- 12.1.1.4. SWOT Analysis
- 12.1.2 Samsung Electronic Co Ltd
- 12.1.2.1. Company Overview
- 12.1.2.2. Products
- 12.1.2.3. Company Financials
- 12.1.2.4. SWOT Analysis
- 12.1.3 Acer Inc *List Not Exhaustive
- 12.1.3.1. Company Overview
- 12.1.3.2. Products
- 12.1.3.3. Company Financials
- 12.1.3.4. SWOT Analysis
- 12.1.4 IBM Corporation
- 12.1.4.1. Company Overview
- 12.1.4.2. Products
- 12.1.4.3. Company Financials
- 12.1.4.4. SWOT Analysis
- 12.1.5 Toshiba Corporation
- 12.1.5.1. Company Overview
- 12.1.5.2. Products
- 12.1.5.3. Company Financials
- 12.1.5.4. SWOT Analysis
- 12.1.6 LG Electronics Inc
- 12.1.6.1. Company Overview
- 12.1.6.2. Products
- 12.1.6.3. Company Financials
- 12.1.6.4. SWOT Analysis
- 12.1.7 Fujitsu Ltd
- 12.1.7.1. Company Overview
- 12.1.7.2. Products
- 12.1.7.3. Company Financials
- 12.1.7.4. SWOT Analysis
- 12.1.8 Planar Systems Inc
- 12.1.8.1. Company Overview
- 12.1.8.2. Products
- 12.1.8.3. Company Financials
- 12.1.8.4. SWOT Analysis
- 12.1.9 Microsoft Corporation
- 12.1.9.1. Company Overview
- 12.1.9.2. Products
- 12.1.9.3. Company Financials
- 12.1.9.4. SWOT Analysis
- 12.1.10 Dell Inc
- 12.1.10.1. Company Overview
- 12.1.10.2. Products
- 12.1.10.3. Company Financials
- 12.1.10.4. SWOT Analysis
- 12.1.11 3M Co
- 12.1.11.1. Company Overview
- 12.1.11.2. Products
- 12.1.11.3. Company Financials
- 12.1.11.4. SWOT Analysis
- 12.1.12 Qualcomm Technologies Inc
- 12.1.12.1. Company Overview
- 12.1.12.2. Products
- 12.1.12.3. Company Financials
- 12.1.12.4. SWOT Analysis
- 12.1.13 Hewlett-Packard Ltd
- 12.1.13.1. Company Overview
- 12.1.13.2. Products
- 12.1.13.3. Company Financials
- 12.1.13.4. SWOT Analysis
- 12.1.14 Lenovo Group Ltd
- 12.1.14.1. Company Overview
- 12.1.14.2. Products
- 12.1.14.3. Company Financials
- 12.1.14.4. SWOT Analysis
- 12.1.15 Apple Inc
- 12.1.15.1. Company Overview
- 12.1.15.2. Products
- 12.1.15.3. Company Financials
- 12.1.15.4. SWOT Analysis
- 12.1.16 Panasonic Corporation
- 12.1.16.1. Company Overview
- 12.1.16.2. Products
- 12.1.16.3. Company Financials
- 12.1.16.4. SWOT Analysis
- 12.1.17 Intel Corporation
- 12.1.17.1. Company Overview
- 12.1.17.2. Products
- 12.1.17.3. Company Financials
- 12.1.17.4. SWOT Analysis
- 12.1.18 Sony Corporation
- 12.1.18.1. Company Overview
- 12.1.18.2. Products
- 12.1.18.3. Company Financials
- 12.1.18.4. SWOT Analysis
- 12.1.1 Viewsonic Corporation
- 12.2. Market Entropy
- 12.2.1 Company's Key Areas Served
- 12.2.2 Recent Developments
- 12.3. Company Market Share Analysis 2025
- 12.3.1 Top 5 Companies Market Share Analysis
- 12.3.2 Top 3 Companies Market Share Analysis
- 12.4. List of Potential Customers
- 13. Research Methodology
List of Figures
- Figure 1: Global Surface Computing Market Revenue Breakdown (Million, %) by Region 2025 & 2033
- Figure 2: North America Surface Computing Market Revenue (Million), by Type 2025 & 2033
- Figure 3: North America Surface Computing Market Revenue Share (%), by Type 2025 & 2033
- Figure 4: North America Surface Computing Market Revenue (Million), by Touch 2025 & 2033
- Figure 5: North America Surface Computing Market Revenue Share (%), by Touch 2025 & 2033
- Figure 6: North America Surface Computing Market Revenue (Million), by Vision 2025 & 2033
- Figure 7: North America Surface Computing Market Revenue Share (%), by Vision 2025 & 2033
- Figure 8: North America Surface Computing Market Revenue (Million), by Application 2025 & 2033
- Figure 9: North America Surface Computing Market Revenue Share (%), by Application 2025 & 2033
- Figure 10: North America Surface Computing Market Revenue (Million), by Country 2025 & 2033
- Figure 11: North America Surface Computing Market Revenue Share (%), by Country 2025 & 2033
- Figure 12: Europe Surface Computing Market Revenue (Million), by Type 2025 & 2033
- Figure 13: Europe Surface Computing Market Revenue Share (%), by Type 2025 & 2033
- Figure 14: Europe Surface Computing Market Revenue (Million), by Touch 2025 & 2033
- Figure 15: Europe Surface Computing Market Revenue Share (%), by Touch 2025 & 2033
- Figure 16: Europe Surface Computing Market Revenue (Million), by Vision 2025 & 2033
- Figure 17: Europe Surface Computing Market Revenue Share (%), by Vision 2025 & 2033
- Figure 18: Europe Surface Computing Market Revenue (Million), by Application 2025 & 2033
- Figure 19: Europe Surface Computing Market Revenue Share (%), by Application 2025 & 2033
- Figure 20: Europe Surface Computing Market Revenue (Million), by Country 2025 & 2033
- Figure 21: Europe Surface Computing Market Revenue Share (%), by Country 2025 & 2033
- Figure 22: Asia Surface Computing Market Revenue (Million), by Type 2025 & 2033
- Figure 23: Asia Surface Computing Market Revenue Share (%), by Type 2025 & 2033
- Figure 24: Asia Surface Computing Market Revenue (Million), by Touch 2025 & 2033
- Figure 25: Asia Surface Computing Market Revenue Share (%), by Touch 2025 & 2033
- Figure 26: Asia Surface Computing Market Revenue (Million), by Vision 2025 & 2033
- Figure 27: Asia Surface Computing Market Revenue Share (%), by Vision 2025 & 2033
- Figure 28: Asia Surface Computing Market Revenue (Million), by Application 2025 & 2033
- Figure 29: Asia Surface Computing Market Revenue Share (%), by Application 2025 & 2033
- Figure 30: Asia Surface Computing Market Revenue (Million), by Country 2025 & 2033
- Figure 31: Asia Surface Computing Market Revenue Share (%), by Country 2025 & 2033
- Figure 32: Latin America Surface Computing Market Revenue (Million), by Type 2025 & 2033
- Figure 33: Latin America Surface Computing Market Revenue Share (%), by Type 2025 & 2033
- Figure 34: Latin America Surface Computing Market Revenue (Million), by Touch 2025 & 2033
- Figure 35: Latin America Surface Computing Market Revenue Share (%), by Touch 2025 & 2033
- Figure 36: Latin America Surface Computing Market Revenue (Million), by Vision 2025 & 2033
- Figure 37: Latin America Surface Computing Market Revenue Share (%), by Vision 2025 & 2033
- Figure 38: Latin America Surface Computing Market Revenue (Million), by Application 2025 & 2033
- Figure 39: Latin America Surface Computing Market Revenue Share (%), by Application 2025 & 2033
- Figure 40: Latin America Surface Computing Market Revenue (Million), by Country 2025 & 2033
- Figure 41: Latin America Surface Computing Market Revenue Share (%), by Country 2025 & 2033
- Figure 42: Middle East and Africa Surface Computing Market Revenue (Million), by Type 2025 & 2033
- Figure 43: Middle East and Africa Surface Computing Market Revenue Share (%), by Type 2025 & 2033
- Figure 44: Middle East and Africa Surface Computing Market Revenue (Million), by Touch 2025 & 2033
- Figure 45: Middle East and Africa Surface Computing Market Revenue Share (%), by Touch 2025 & 2033
- Figure 46: Middle East and Africa Surface Computing Market Revenue (Million), by Vision 2025 & 2033
- Figure 47: Middle East and Africa Surface Computing Market Revenue Share (%), by Vision 2025 & 2033
- Figure 48: Middle East and Africa Surface Computing Market Revenue (Million), by Application 2025 & 2033
- Figure 49: Middle East and Africa Surface Computing Market Revenue Share (%), by Application 2025 & 2033
- Figure 50: Middle East and Africa Surface Computing Market Revenue (Million), by Country 2025 & 2033
- Figure 51: Middle East and Africa Surface Computing Market Revenue Share (%), by Country 2025 & 2033
List of Tables
- Table 1: Global Surface Computing Market Revenue Million Forecast, by Type 2020 & 2033
- Table 2: Global Surface Computing Market Revenue Million Forecast, by Touch 2020 & 2033
- Table 3: Global Surface Computing Market Revenue Million Forecast, by Vision 2020 & 2033
- Table 4: Global Surface Computing Market Revenue Million Forecast, by Application 2020 & 2033
- Table 5: Global Surface Computing Market Revenue Million Forecast, by Region 2020 & 2033
- Table 6: Global Surface Computing Market Revenue Million Forecast, by Type 2020 & 2033
- Table 7: Global Surface Computing Market Revenue Million Forecast, by Touch 2020 & 2033
- Table 8: Global Surface Computing Market Revenue Million Forecast, by Vision 2020 & 2033
- Table 9: Global Surface Computing Market Revenue Million Forecast, by Application 2020 & 2033
- Table 10: Global Surface Computing Market Revenue Million Forecast, by Country 2020 & 2033
- Table 11: United States Surface Computing Market Revenue (Million) Forecast, by Application 2020 & 2033
- Table 12: Canada Surface Computing Market Revenue (Million) Forecast, by Application 2020 & 2033
- Table 13: Global Surface Computing Market Revenue Million Forecast, by Type 2020 & 2033
- Table 14: Global Surface Computing Market Revenue Million Forecast, by Touch 2020 & 2033
- Table 15: Global Surface Computing Market Revenue Million Forecast, by Vision 2020 & 2033
- Table 16: Global Surface Computing Market Revenue Million Forecast, by Application 2020 & 2033
- Table 17: Global Surface Computing Market Revenue Million Forecast, by Country 2020 & 2033
- Table 18: United Kingdom Surface Computing Market Revenue (Million) Forecast, by Application 2020 & 2033
- Table 19: Germany Surface Computing Market Revenue (Million) Forecast, by Application 2020 & 2033
- Table 20: France Surface Computing Market Revenue (Million) Forecast, by Application 2020 & 2033
- Table 21: Global Surface Computing Market Revenue Million Forecast, by Type 2020 & 2033
- Table 22: Global Surface Computing Market Revenue Million Forecast, by Touch 2020 & 2033
- Table 23: Global Surface Computing Market Revenue Million Forecast, by Vision 2020 & 2033
- Table 24: Global Surface Computing Market Revenue Million Forecast, by Application 2020 & 2033
- Table 25: Global Surface Computing Market Revenue Million Forecast, by Country 2020 & 2033
- Table 26: China Surface Computing Market Revenue (Million) Forecast, by Application 2020 & 2033
- Table 27: Japan Surface Computing Market Revenue (Million) Forecast, by Application 2020 & 2033
- Table 28: India Surface Computing Market Revenue (Million) Forecast, by Application 2020 & 2033
- Table 29: Australia and New Zealand Surface Computing Market Revenue (Million) Forecast, by Application 2020 & 2033
- Table 30: Global Surface Computing Market Revenue Million Forecast, by Type 2020 & 2033
- Table 31: Global Surface Computing Market Revenue Million Forecast, by Touch 2020 & 2033
- Table 32: Global Surface Computing Market Revenue Million Forecast, by Vision 2020 & 2033
- Table 33: Global Surface Computing Market Revenue Million Forecast, by Application 2020 & 2033
- Table 34: Global Surface Computing Market Revenue Million Forecast, by Country 2020 & 2033
- Table 35: Mexico Surface Computing Market Revenue (Million) Forecast, by Application 2020 & 2033
- Table 36: Brazil Surface Computing Market Revenue (Million) Forecast, by Application 2020 & 2033
- Table 37: Argentina Surface Computing Market Revenue (Million) Forecast, by Application 2020 & 2033
- Table 38: Global Surface Computing Market Revenue Million Forecast, by Type 2020 & 2033
- Table 39: Global Surface Computing Market Revenue Million Forecast, by Touch 2020 & 2033
- Table 40: Global Surface Computing Market Revenue Million Forecast, by Vision 2020 & 2033
- Table 41: Global Surface Computing Market Revenue Million Forecast, by Application 2020 & 2033
- Table 42: Global Surface Computing Market Revenue Million Forecast, by Country 2020 & 2033
- Table 43: Saudi Arabia Surface Computing Market Revenue (Million) Forecast, by Application 2020 & 2033
- Table 44: United Arab Emirates Surface Computing Market Revenue (Million) Forecast, by Application 2020 & 2033
- Table 45: South Africa Surface Computing Market Revenue (Million) Forecast, by Application 2020 & 2033
Frequently Asked Questions
1. What is the projected Compound Annual Growth Rate (CAGR) of the Surface Computing Market?
The projected CAGR is approximately 35.23%.
2. Which companies are prominent players in the Surface Computing Market?
Key companies in the market include Viewsonic Corporation, Samsung Electronic Co Ltd, Acer Inc *List Not Exhaustive, IBM Corporation, Toshiba Corporation, LG Electronics Inc, Fujitsu Ltd, Planar Systems Inc, Microsoft Corporation, Dell Inc, 3M Co, Qualcomm Technologies Inc, Hewlett-Packard Ltd, Lenovo Group Ltd, Apple Inc, Panasonic Corporation, Intel Corporation, Sony Corporation.
3. What are the main segments of the Surface Computing Market?
The market segments include Type, Touch, Vision, Application.
4. Can you provide details about the market size?
The market size is estimated to be USD 81.94 Million as of 2022.
5. What are some drivers contributing to market growth?
More Advanced and User-friendly Interface - Natural User Interface (NUI); Increasing Business Revenue Due to Adoption of Multi-user Tabletops.
6. What are the notable trends driving market growth?
The Retail Sector is Expected to Hold a Significant Market Share.
7. Are there any restraints impacting market growth?
Limited Availability of Features; High Cost of Surface Computers.
8. Can you provide examples of recent developments in the market?
May 2024 - Microsoft announced new computers with the company’s artificial intelligence tech built directly into them, boosting the race among tech giants to push out AI tools to the public and adding computer chips that are tailored to run AI technology to the company’s PCs and tablets will make AI tools and features run faster than if the technology runs through an internet connection, as most chatbots.
9. What pricing options are available for accessing the report?
Pricing options include single-user, multi-user, and enterprise licenses priced at USD 4750, USD 5250, and USD 8750 respectively.
10. Is the market size provided in terms of value or volume?
The market size is provided in terms of value, measured in Million.
11. Are there any specific market keywords associated with the report?
Yes, the market keyword associated with the report is "Surface Computing Market," which aids in identifying and referencing the specific market segment covered.
12. How do I determine which pricing option suits my needs best?
The pricing options vary based on user requirements and access needs. Individual users may opt for single-user licenses, while businesses requiring broader access may choose multi-user or enterprise licenses for cost-effective access to the report.
13. Are there any additional resources or data provided in the Surface Computing Market report?
While the report offers comprehensive insights, it's advisable to review the specific contents or supplementary materials provided to ascertain if additional resources or data are available.
14. How can I stay updated on further developments or reports in the Surface Computing Market?
To stay informed about further developments, trends, and reports in the Surface Computing Market, consider subscribing to industry newsletters, following relevant companies and organizations, or regularly checking reputable industry news sources and publications.
Methodology
Step 1 - Identification of Relevant Samples Size from Population Database


Step 2 - Approaches for Defining Global Market Size (Value, Volume* & Price*)

Note*: In applicable scenarios
Step 3 - Data Sources
Primary Research
- Web Analytics
- Survey Reports
- Research Institute
- Latest Research Reports
- Opinion Leaders
Secondary Research
- Annual Reports
- White Paper
- Latest Press Release
- Industry Association
- Paid Database
- Investor Presentations

Step 4 - Data Triangulation
Involves using different sources of information in order to increase the validity of a study
These sources are likely to be stakeholders in a program - participants, other researchers, program staff, other community members, and so on.
Then we put all data in single framework & apply various statistical tools to find out the dynamic on the market.
During the analysis stage, feedback from the stakeholder groups would be compared to determine areas of agreement as well as areas of divergence