

Key Insights
The US Non-Destructive Testing (NDT) Equipment Market is projected to reach an estimated USD 11.04 billion by 2025, with a Compound Annual Growth Rate (CAGR) of 11.57% through 2033. This significant growth is driven by increasing demand for infrastructure development and maintenance across key sectors. Aging infrastructure and stringent safety regulations in aerospace, defense, and oil & gas necessitate reliable inspection, boosting NDT equipment adoption. Enhanced quality control and defect detection in manufacturing, particularly in automotive and construction, also contribute significantly. Technological advancements, including AI and automation, are improving NDT system accuracy and efficiency, further driving market appeal. Investments in renewable energy projects, requiring rigorous inspection of associated infrastructure, also fuel market expansion.
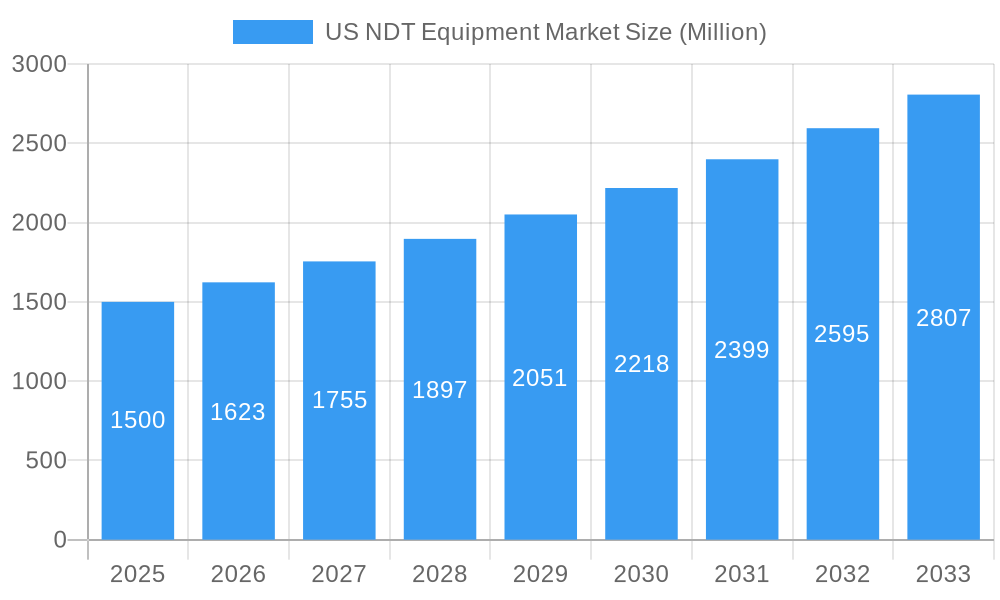
US NDT Equipment Market Market Size (In Billion)
The US NDT equipment market is dynamic, shaped by technological innovation and evolving industry demands. While the outlook is positive, high initial investment costs for advanced NDT equipment may pose a challenge for smaller businesses, though long-term benefits often justify the expense. Geopolitical uncertainties and supply chain disruptions could cause temporary market fluctuations. However, the fundamental need for safety assurance and asset integrity management ensures sustained demand. Radiography Testing, Ultrasonic Testing, and Eddy Current equipment are expected to see widespread adoption due to their proven defect detection capabilities. The Oil & Gas, Aerospace, and Defense sectors will likely remain dominant end-users, driven by critical safety requirements. Emerging applications in construction, especially for advanced materials and smart buildings, present further growth opportunities.
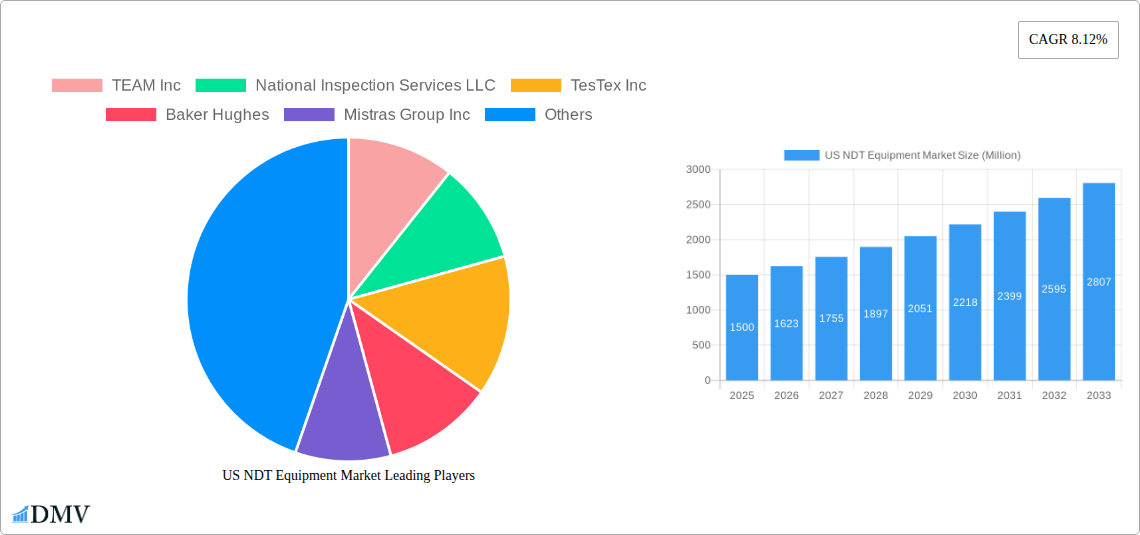
US NDT Equipment Market Company Market Share
US Non-Destructive Testing (NDT) Equipment Market: In-depth Analysis and Future Outlook (2019–2033)
Unlock critical insights into the burgeoning US Non-Destructive Testing (NDT) Equipment Market. This comprehensive report delivers an unparalleled analysis of market dynamics, technological innovations, and strategic imperatives shaping the industry from 2019 to 2033. With a base year of 2025 and a robust forecast period extending to 2033, delve into the growth trajectories of key segments, understand the competitive landscape, and identify emerging opportunities within this vital sector. This report is your definitive guide to navigating the complexities and capitalizing on the potential of the US NDT Equipment Market.
US NDT Equipment Market Market Composition & Trends
The US Non-Destructive Testing (NDT) Equipment Market is characterized by a moderate concentration, with established players like TEAM Inc, Baker Hughes, and Mistras Group Inc holding significant market share. Innovation remains a key catalyst, driven by continuous advancements in radiography testing, ultrasonic testing, and eddy current equipment, catering to increasingly sophisticated inspection demands. Regulatory landscapes, particularly stringent safety standards in the aerospace and defence, oil and gas, and power and energy sectors, act as both drivers and constraints, influencing equipment adoption and technological development. Substitute products, while present in certain niche applications, are largely outpaced by the reliability and comprehensive data provided by advanced NDT solutions. End-user profiles are diverse, ranging from large-scale industrial operators requiring robust, high-throughput systems to specialized service providers seeking portable and versatile inspection tools. Mergers and acquisitions (M&A) activities have been strategic, aimed at consolidating market presence and expanding service portfolios. For instance, a notable M&A deal in the past involved a market leader acquiring a specialized NDT service provider for an estimated xx Million, aiming to enhance their integrated service offerings. The market share distribution currently sees Radiography Testing Equipment and Ultrasonic Testing Equipment leading, collectively accounting for approximately 55% of the market revenue.
US NDT Equipment Market Industry Evolution
The US Non-Destructive Testing (NDT) Equipment Market has undergone a significant evolution driven by a confluence of technological innovation, stringent regulatory mandates, and escalating demand for asset integrity management across critical industries. Historically, the market witnessed a steady but incremental adoption of NDT technologies. However, the period between 2019 and 2024 has seen an accelerated growth trajectory, with an estimated Compound Annual Growth Rate (CAGR) of xx% during this historical period. This surge is primarily attributable to the increasing need for proactive maintenance and safety assurance in sectors like oil and gas, where aging infrastructure and stringent environmental regulations necessitate thorough inspections.
Technological advancements have been a primary engine of this evolution. The development of digital radiography, phased array ultrasonic testing (PAUT), and advanced eddy current techniques has revolutionized inspection capabilities, offering higher resolution, faster data acquisition, and more comprehensive defect characterization. For example, the adoption rate of phased array ultrasonic testing equipment has grown by an estimated xx% annually over the past five years due to its ability to inspect complex geometries and provide real-time imaging. Furthermore, the integration of Artificial Intelligence (AI) and Machine Learning (ML) into NDT data analysis is beginning to transform the industry, enabling automated defect recognition and predictive maintenance insights. This trend is projected to significantly boost the market in the forecast period.
Shifting consumer demands are also playing a pivotal role. End-users are increasingly prioritizing NDT solutions that offer not only accurate defect detection but also efficiency, cost-effectiveness, and enhanced safety for inspection personnel. The growing emphasis on minimizing downtime in industrial operations fuels the demand for rapid and non-disruptive inspection methods. Consequently, portable and automated NDT equipment is gaining traction. The market's response has been the development of lightweight, user-friendly devices equipped with advanced software for data management and reporting. The construction industry, for instance, is increasingly adopting NDT for quality control of welds and structural integrity, contributing to a xx% increase in demand for portable ultrasonic testing equipment in recent years. The overall market size, estimated at xx Million in 2019, is projected to reach xx Million by 2033, reflecting a sustained and robust growth trend.
Leading Regions, Countries, or Segments in US NDT Equipment Market
The US Non-Destructive Testing (NDT) Equipment Market exhibits a clear dominance within specific segments and geographical regions, primarily driven by the critical nature of the industries they serve and the underlying technological advancements.
Technology: Radiography Testing Equipment Dominance
- Key Drivers: Stringent safety regulations in nuclear power, aerospace, and oil & gas industries; ability to inspect complex geometries and internal defects; continuous innovation in digital radiography for enhanced image quality and reduced exposure times.
- Dominance Factors: Radiography Testing Equipment, particularly computed radiography (CR) and digital radiography (DR), continues to be a cornerstone of the US NDT market. Its capability to penetrate materials and detect internal flaws like cracks, voids, and inclusions makes it indispensable for critical applications. The demand is amplified by the ongoing need for inspection of welds, castings, and forgings in sectors where failure can have catastrophic consequences. The estimated market share for Radiography Testing Equipment stands at approximately 30% of the total NDT equipment market value. Advancements in portable X-ray sources and digital detectors have further enhanced its applicability in field inspections.
Technology: Ultrasonic Testing Equipment's Growing Influence
- Key Drivers: Versatility in material testing, high sensitivity to surface and near-surface defects, advancements in phased array and guided wave technologies, increasing adoption in infrastructure monitoring.
- Dominance Factors: Ultrasonic Testing Equipment is a close contender and a rapidly growing segment, estimated at around 25% market share. Its ability to detect a wide range of defects, from surface cracks to internal flaws, across various materials like metals, composites, and plastics makes it highly versatile. The advent of Phased Array Ultrasonic Testing (PAUT) has significantly boosted its capabilities, allowing for faster scanning and inspection of complex geometries, particularly in the oil & gas, power generation, and aerospace sectors. The market is witnessing a substantial shift towards digital ultrasonic equipment for improved accuracy and data management.
End-user Industry: Oil and Gas Sector's Sustained Demand
- Key Drivers: Aging infrastructure requiring continuous integrity monitoring, strict safety and environmental regulations, increasing offshore exploration and production activities, demand for pipeline integrity management.
- Dominance Factors: The Oil and Gas industry remains the largest end-user segment for NDT equipment in the US, accounting for an estimated 35% of the total market revenue. The vast network of pipelines, refineries, offshore platforms, and processing facilities requires constant inspection and maintenance to prevent leaks, ensure operational safety, and comply with environmental regulations. NDT equipment, including ultrasonic, radiographic, and magnetic particle testing devices, is critical for assessing the integrity of welds, detecting corrosion, and identifying material defects. The ongoing global energy transition, while shifting focus, still necessitates the robust maintenance of existing infrastructure, underpinning sustained demand for NDT solutions.
End-user Industry: Aerospace and Defence's Precision Requirements
- Key Drivers: High safety standards, demand for lightweight and high-performance materials, complex component manufacturing, strict regulatory oversight for aircraft safety.
- Dominance Factors: The Aerospace and Defence sector, representing approximately 20% of the market, demands highly precise and reliable NDT methods. The use of advanced composite materials, intricate engine components, and airframe structures necessitates specialized NDT techniques like eddy current testing, ultrasonic testing, and advanced radiography to detect subsurface flaws and delaminations. The stringent safety requirements and the high cost of potential failures in this industry drive continuous investment in advanced NDT equipment and technologies.
The "Other End-user Industries" segment, comprising construction, automotive, and general manufacturing, collectively represents the remaining market share, with each demonstrating specific growth trends tied to infrastructure development, vehicle safety, and industrial production efficiency. The growth in construction is particularly notable, fueled by infrastructure repair and new development projects.
US NDT Equipment Market Product Innovations
The US NDT Equipment Market is consistently witnessing groundbreaking product innovations aimed at enhancing inspection accuracy, efficiency, and user experience. Recent advancements include the development of portable digital radiography systems with improved image resolution and reduced radiation exposure, and sophisticated phased array ultrasonic units capable of inspecting complex weld geometries with unparalleled speed. Eddy current equipment is seeing innovations in multi-frequency capabilities for detecting smaller surface defects and subsurface anomalies in non-ferrous materials. Furthermore, the integration of AI-powered software for automated data analysis and defect identification is transforming the market, enabling predictive maintenance and reducing human error. These advancements are crucial for meeting the evolving demands for asset integrity and safety across diverse industries.
Propelling Factors for US NDT Equipment Market Growth
Several key factors are propelling the growth of the US Non-Destructive Testing (NDT) Equipment Market. Firstly, stringent safety regulations across industries like oil & gas, aerospace, and power generation mandate rigorous inspection protocols, driving demand for advanced NDT equipment. Secondly, aging infrastructure in critical sectors necessitates proactive maintenance and integrity assessment, boosting the need for reliable NDT solutions. Thirdly, technological advancements, including the development of digital radiography, phased array ultrasonics, and AI-driven analytics, are enhancing inspection capabilities and efficiency. Finally, the increasing emphasis on asset lifecycle management and predictive maintenance by industries seeking to optimize operational costs and prevent costly failures is a significant growth driver. The growing adoption of NDT in emerging sectors like renewable energy infrastructure further fuels market expansion.
Obstacles in the US NDT Equipment Market Market
Despite robust growth prospects, the US NDT Equipment Market faces certain obstacles. High initial investment costs for advanced NDT equipment can be a barrier for small and medium-sized enterprises (SMEs). A shortage of skilled NDT technicians trained to operate and interpret data from sophisticated equipment poses a challenge to widespread adoption and efficient utilization. Cybersecurity concerns associated with connected NDT devices and cloud-based data management systems are also emerging as a restraint. Furthermore, evolving regulatory landscapes can sometimes lead to uncertainty and require continuous adaptation of equipment and inspection methodologies, impacting market stability. Finally, supply chain disruptions for critical components can lead to production delays and increased costs, affecting the availability and pricing of NDT equipment.
Future Opportunities in US NDT Equipment Market
The US NDT Equipment Market is ripe with future opportunities. The increasing focus on renewable energy infrastructure (wind turbines, solar farms) presents a significant avenue for NDT services and equipment. The growing adoption of smart technologies and the Industrial Internet of Things (IIoT) will drive demand for integrated NDT solutions capable of real-time data acquisition and remote monitoring. Opportunities also lie in the development of more compact, automated, and drone-based NDT systems for inspecting hard-to-reach areas. The expansion of NDT applications in advanced manufacturing and composite materials for industries like automotive and aerospace offers substantial growth potential. Furthermore, the increasing demand for predictive maintenance solutions powered by AI and machine learning will create a niche for advanced analytical NDT services.
Major Players in the US NDT Equipment Market Ecosystem
- TEAM Inc
- National Inspection Services LLC
- TesTex Inc
- Baker Hughes
- Mistras Group Inc
- NDT Global LLC
- Applied Technical Services
- Triumph Group
- Innerspec Technologies Inc
- NVI Nondestructive & Visual Inspection
Key Developments in US NDT Equipment Market Industry
- September 2022: Applied Technical Services announced a collaboration with C&W Meter Service, LLC, where the companies will continue to work alongside their pipeline, refinery, marketing terminal, airport refueling, and power/utility clients with no interruption to service. C&W Meter Service's access to resources through this new partnership would expand its capabilities and service area.
- March 2022: Baker Hughes announced a collaboration on industrial asset management (IAM) solutions with C3 AI, Accenture, and Microsoft for customers in the industrial and energy industries. The partnership will be concentrated on developing and implementing Baker Hughes IAM solutions that use digital technology to enhance the safety, effectiveness, and emissions profile of industrial machinery, field equipment, and other physical assets.
Strategic US NDT Equipment Market Market Forecast
The strategic forecast for the US NDT Equipment Market indicates a promising trajectory driven by sustained demand for asset integrity and safety. The continuous evolution of technologies like phased array ultrasonics and digital radiography, coupled with the burgeoning integration of AI and IoT, will be critical growth catalysts. The increasing emphasis on predictive maintenance and the expansion of NDT applications into renewable energy and advanced manufacturing sectors are expected to unlock significant market potential. The forecast predicts a consistent upward trend, with the market size projected to reach xx Million by 2033, reflecting an anticipated CAGR of xx% from the base year 2025. Strategic investments in research and development, along with a focus on addressing the skilled workforce gap, will be pivotal for stakeholders to capitalize on the expanding opportunities within this dynamic market.
US NDT Equipment Market Segmentation
-
1. Technology
- 1.1. Radiography Testing Equipment
- 1.2. Ultrasonic Testing Equipment
- 1.3. Magnetic Particle Testing Equipment
- 1.4. Liquid Penetrant Testing Equipment
- 1.5. Visual Inspection Equipment
- 1.6. Eddy Current Equipment
- 1.7. Other Technologies
-
2. End-user Industry
- 2.1. Oil and Gas
- 2.2. Power and Energy
- 2.3. Aerospace and Defence
- 2.4. Automotive and Transportation
- 2.5. Construction
- 2.6. Other End-user Industries
US NDT Equipment Market Segmentation By Geography
-
1. North America
- 1.1. United States
- 1.2. Canada
- 1.3. Mexico
-
2. South America
- 2.1. Brazil
- 2.2. Argentina
- 2.3. Rest of South America
-
3. Europe
- 3.1. United Kingdom
- 3.2. Germany
- 3.3. France
- 3.4. Italy
- 3.5. Spain
- 3.6. Russia
- 3.7. Benelux
- 3.8. Nordics
- 3.9. Rest of Europe
-
4. Middle East & Africa
- 4.1. Turkey
- 4.2. Israel
- 4.3. GCC
- 4.4. North Africa
- 4.5. South Africa
- 4.6. Rest of Middle East & Africa
-
5. Asia Pacific
- 5.1. China
- 5.2. India
- 5.3. Japan
- 5.4. South Korea
- 5.5. ASEAN
- 5.6. Oceania
- 5.7. Rest of Asia Pacific
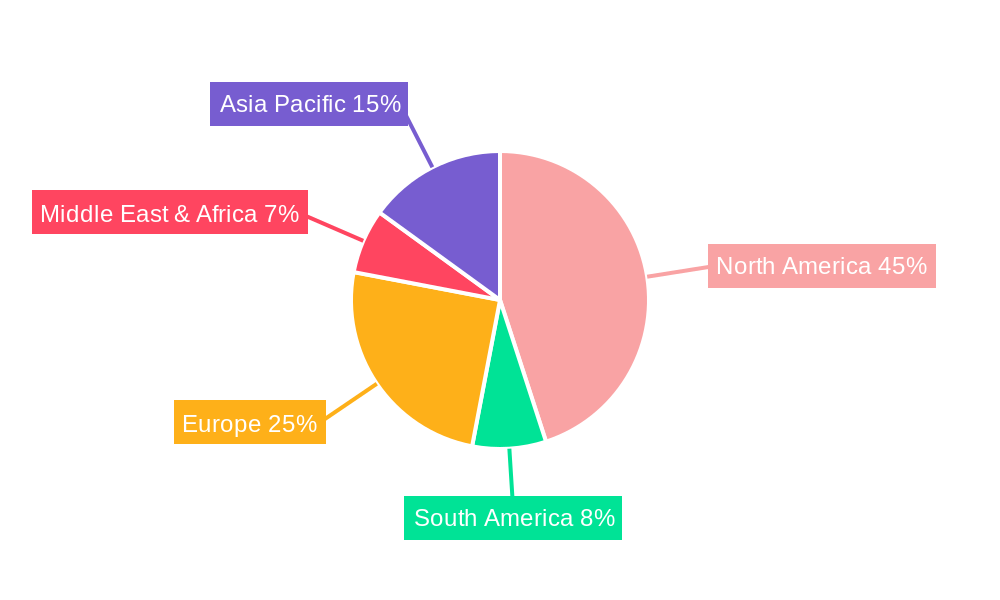
US NDT Equipment Market Regional Market Share
Geographic Coverage of US NDT Equipment Market
US NDT Equipment Market REPORT HIGHLIGHTS
| Aspects | Details |
|---|---|
| Study Period | 2020-2034 |
| Base Year | 2025 |
| Estimated Year | 2026 |
| Forecast Period | 2026-2034 |
| Historical Period | 2020-2025 |
| Growth Rate | CAGR of 11.57% from 2020-2034 |
| Segmentation |
|
Table of Contents
- 1. Introduction
- 1.1. Research Scope
- 1.2. Market Segmentation
- 1.3. Research Objective
- 1.4. Definitions and Assumptions
- 2. Executive Summary
- 2.1. Market Snapshot
- 3. Market Dynamics
- 3.1. Market Drivers
- 3.2. Market Restrains
- 3.3. Market Trends
- 3.4. Market Opportunities
- 4. Market Factor Analysis
- 4.1. Porters Five Forces
- 4.1.1. Bargaining Power of Suppliers
- 4.1.2. Bargaining Power of Buyers
- 4.1.3. Threat of New Entrants
- 4.1.4. Threat of Substitutes
- 4.1.5. Competitive Rivalry
- 4.2. PESTEL analysis
- 4.3. BCG Analysis
- 4.3.1. Stars (High Growth, High Market Share)
- 4.3.2. Cash Cows (Low Growth, High Market Share)
- 4.3.3. Question Mark (High Growth, Low Market Share)
- 4.3.4. Dogs (Low Growth, Low Market Share)
- 4.4. Ansoff Matrix Analysis
- 4.5. Supply Chain Analysis
- 4.6. Regulatory Landscape
- 4.7. Current Market Potential and Opportunity Assessment (TAM–SAM–SOM Framework)
- 4.8. DMV Analyst Note
- 4.1. Porters Five Forces
- 5. Market Analysis, Insights and Forecast 2021-2033
- 5.1. Market Analysis, Insights and Forecast - by Technology
- 5.1.1. Radiography Testing Equipment
- 5.1.2. Ultrasonic Testing Equipment
- 5.1.3. Magnetic Particle Testing Equipment
- 5.1.4. Liquid Penetrant Testing Equipment
- 5.1.5. Visual Inspection Equipment
- 5.1.6. Eddy Current Equipment
- 5.1.7. Other Technologies
- 5.2. Market Analysis, Insights and Forecast - by End-user Industry
- 5.2.1. Oil and Gas
- 5.2.2. Power and Energy
- 5.2.3. Aerospace and Defence
- 5.2.4. Automotive and Transportation
- 5.2.5. Construction
- 5.2.6. Other End-user Industries
- 5.3. Market Analysis, Insights and Forecast - by Region
- 5.3.1. North America
- 5.3.2. South America
- 5.3.3. Europe
- 5.3.4. Middle East & Africa
- 5.3.5. Asia Pacific
- 5.1. Market Analysis, Insights and Forecast - by Technology
- 6. Global US NDT Equipment Market Analysis, Insights and Forecast, 2021-2033
- 6.1. Market Analysis, Insights and Forecast - by Technology
- 6.1.1. Radiography Testing Equipment
- 6.1.2. Ultrasonic Testing Equipment
- 6.1.3. Magnetic Particle Testing Equipment
- 6.1.4. Liquid Penetrant Testing Equipment
- 6.1.5. Visual Inspection Equipment
- 6.1.6. Eddy Current Equipment
- 6.1.7. Other Technologies
- 6.2. Market Analysis, Insights and Forecast - by End-user Industry
- 6.2.1. Oil and Gas
- 6.2.2. Power and Energy
- 6.2.3. Aerospace and Defence
- 6.2.4. Automotive and Transportation
- 6.2.5. Construction
- 6.2.6. Other End-user Industries
- 6.1. Market Analysis, Insights and Forecast - by Technology
- 7. North America US NDT Equipment Market Analysis, Insights and Forecast, 2020-2032
- 7.1. Market Analysis, Insights and Forecast - by Technology
- 7.1.1. Radiography Testing Equipment
- 7.1.2. Ultrasonic Testing Equipment
- 7.1.3. Magnetic Particle Testing Equipment
- 7.1.4. Liquid Penetrant Testing Equipment
- 7.1.5. Visual Inspection Equipment
- 7.1.6. Eddy Current Equipment
- 7.1.7. Other Technologies
- 7.2. Market Analysis, Insights and Forecast - by End-user Industry
- 7.2.1. Oil and Gas
- 7.2.2. Power and Energy
- 7.2.3. Aerospace and Defence
- 7.2.4. Automotive and Transportation
- 7.2.5. Construction
- 7.2.6. Other End-user Industries
- 7.1. Market Analysis, Insights and Forecast - by Technology
- 8. South America US NDT Equipment Market Analysis, Insights and Forecast, 2020-2032
- 8.1. Market Analysis, Insights and Forecast - by Technology
- 8.1.1. Radiography Testing Equipment
- 8.1.2. Ultrasonic Testing Equipment
- 8.1.3. Magnetic Particle Testing Equipment
- 8.1.4. Liquid Penetrant Testing Equipment
- 8.1.5. Visual Inspection Equipment
- 8.1.6. Eddy Current Equipment
- 8.1.7. Other Technologies
- 8.2. Market Analysis, Insights and Forecast - by End-user Industry
- 8.2.1. Oil and Gas
- 8.2.2. Power and Energy
- 8.2.3. Aerospace and Defence
- 8.2.4. Automotive and Transportation
- 8.2.5. Construction
- 8.2.6. Other End-user Industries
- 8.1. Market Analysis, Insights and Forecast - by Technology
- 9. Europe US NDT Equipment Market Analysis, Insights and Forecast, 2020-2032
- 9.1. Market Analysis, Insights and Forecast - by Technology
- 9.1.1. Radiography Testing Equipment
- 9.1.2. Ultrasonic Testing Equipment
- 9.1.3. Magnetic Particle Testing Equipment
- 9.1.4. Liquid Penetrant Testing Equipment
- 9.1.5. Visual Inspection Equipment
- 9.1.6. Eddy Current Equipment
- 9.1.7. Other Technologies
- 9.2. Market Analysis, Insights and Forecast - by End-user Industry
- 9.2.1. Oil and Gas
- 9.2.2. Power and Energy
- 9.2.3. Aerospace and Defence
- 9.2.4. Automotive and Transportation
- 9.2.5. Construction
- 9.2.6. Other End-user Industries
- 9.1. Market Analysis, Insights and Forecast - by Technology
- 10. Middle East & Africa US NDT Equipment Market Analysis, Insights and Forecast, 2020-2032
- 10.1. Market Analysis, Insights and Forecast - by Technology
- 10.1.1. Radiography Testing Equipment
- 10.1.2. Ultrasonic Testing Equipment
- 10.1.3. Magnetic Particle Testing Equipment
- 10.1.4. Liquid Penetrant Testing Equipment
- 10.1.5. Visual Inspection Equipment
- 10.1.6. Eddy Current Equipment
- 10.1.7. Other Technologies
- 10.2. Market Analysis, Insights and Forecast - by End-user Industry
- 10.2.1. Oil and Gas
- 10.2.2. Power and Energy
- 10.2.3. Aerospace and Defence
- 10.2.4. Automotive and Transportation
- 10.2.5. Construction
- 10.2.6. Other End-user Industries
- 10.1. Market Analysis, Insights and Forecast - by Technology
- 11. Asia Pacific US NDT Equipment Market Analysis, Insights and Forecast, 2020-2032
- 11.1. Market Analysis, Insights and Forecast - by Technology
- 11.1.1. Radiography Testing Equipment
- 11.1.2. Ultrasonic Testing Equipment
- 11.1.3. Magnetic Particle Testing Equipment
- 11.1.4. Liquid Penetrant Testing Equipment
- 11.1.5. Visual Inspection Equipment
- 11.1.6. Eddy Current Equipment
- 11.1.7. Other Technologies
- 11.2. Market Analysis, Insights and Forecast - by End-user Industry
- 11.2.1. Oil and Gas
- 11.2.2. Power and Energy
- 11.2.3. Aerospace and Defence
- 11.2.4. Automotive and Transportation
- 11.2.5. Construction
- 11.2.6. Other End-user Industries
- 11.1. Market Analysis, Insights and Forecast - by Technology
- 12. Competitive Analysis
- 12.1. Company Profiles
- 12.1.1 TEAM Inc
- 12.1.1.1. Company Overview
- 12.1.1.2. Products
- 12.1.1.3. Company Financials
- 12.1.1.4. SWOT Analysis
- 12.1.2 National Inspection Services LLC
- 12.1.2.1. Company Overview
- 12.1.2.2. Products
- 12.1.2.3. Company Financials
- 12.1.2.4. SWOT Analysis
- 12.1.3 TesTex Inc
- 12.1.3.1. Company Overview
- 12.1.3.2. Products
- 12.1.3.3. Company Financials
- 12.1.3.4. SWOT Analysis
- 12.1.4 Baker Hughes
- 12.1.4.1. Company Overview
- 12.1.4.2. Products
- 12.1.4.3. Company Financials
- 12.1.4.4. SWOT Analysis
- 12.1.5 Mistras Group Inc
- 12.1.5.1. Company Overview
- 12.1.5.2. Products
- 12.1.5.3. Company Financials
- 12.1.5.4. SWOT Analysis
- 12.1.6 NDT Global LLC
- 12.1.6.1. Company Overview
- 12.1.6.2. Products
- 12.1.6.3. Company Financials
- 12.1.6.4. SWOT Analysis
- 12.1.7 Applied Technical Services
- 12.1.7.1. Company Overview
- 12.1.7.2. Products
- 12.1.7.3. Company Financials
- 12.1.7.4. SWOT Analysis
- 12.1.8 Triumph Group
- 12.1.8.1. Company Overview
- 12.1.8.2. Products
- 12.1.8.3. Company Financials
- 12.1.8.4. SWOT Analysis
- 12.1.9 Innerspec Technologies Inc
- 12.1.9.1. Company Overview
- 12.1.9.2. Products
- 12.1.9.3. Company Financials
- 12.1.9.4. SWOT Analysis
- 12.1.10 NVI Nondestructive & Visual Inspection
- 12.1.10.1. Company Overview
- 12.1.10.2. Products
- 12.1.10.3. Company Financials
- 12.1.10.4. SWOT Analysis
- 12.1.1 TEAM Inc
- 12.2. Market Entropy
- 12.2.1 Company's Key Areas Served
- 12.2.2 Recent Developments
- 12.3. Company Market Share Analysis 2025
- 12.3.1 Top 5 Companies Market Share Analysis
- 12.3.2 Top 3 Companies Market Share Analysis
- 12.4. List of Potential Customers
- 13. Research Methodology
List of Figures
- Figure 1: Global US NDT Equipment Market Revenue Breakdown (billion, %) by Region 2025 & 2033
- Figure 2: Global US NDT Equipment Market Volume Breakdown (K Unit, %) by Region 2025 & 2033
- Figure 3: North America US NDT Equipment Market Revenue (billion), by Technology 2025 & 2033
- Figure 4: North America US NDT Equipment Market Volume (K Unit), by Technology 2025 & 2033
- Figure 5: North America US NDT Equipment Market Revenue Share (%), by Technology 2025 & 2033
- Figure 6: North America US NDT Equipment Market Volume Share (%), by Technology 2025 & 2033
- Figure 7: North America US NDT Equipment Market Revenue (billion), by End-user Industry 2025 & 2033
- Figure 8: North America US NDT Equipment Market Volume (K Unit), by End-user Industry 2025 & 2033
- Figure 9: North America US NDT Equipment Market Revenue Share (%), by End-user Industry 2025 & 2033
- Figure 10: North America US NDT Equipment Market Volume Share (%), by End-user Industry 2025 & 2033
- Figure 11: North America US NDT Equipment Market Revenue (billion), by Country 2025 & 2033
- Figure 12: North America US NDT Equipment Market Volume (K Unit), by Country 2025 & 2033
- Figure 13: North America US NDT Equipment Market Revenue Share (%), by Country 2025 & 2033
- Figure 14: North America US NDT Equipment Market Volume Share (%), by Country 2025 & 2033
- Figure 15: South America US NDT Equipment Market Revenue (billion), by Technology 2025 & 2033
- Figure 16: South America US NDT Equipment Market Volume (K Unit), by Technology 2025 & 2033
- Figure 17: South America US NDT Equipment Market Revenue Share (%), by Technology 2025 & 2033
- Figure 18: South America US NDT Equipment Market Volume Share (%), by Technology 2025 & 2033
- Figure 19: South America US NDT Equipment Market Revenue (billion), by End-user Industry 2025 & 2033
- Figure 20: South America US NDT Equipment Market Volume (K Unit), by End-user Industry 2025 & 2033
- Figure 21: South America US NDT Equipment Market Revenue Share (%), by End-user Industry 2025 & 2033
- Figure 22: South America US NDT Equipment Market Volume Share (%), by End-user Industry 2025 & 2033
- Figure 23: South America US NDT Equipment Market Revenue (billion), by Country 2025 & 2033
- Figure 24: South America US NDT Equipment Market Volume (K Unit), by Country 2025 & 2033
- Figure 25: South America US NDT Equipment Market Revenue Share (%), by Country 2025 & 2033
- Figure 26: South America US NDT Equipment Market Volume Share (%), by Country 2025 & 2033
- Figure 27: Europe US NDT Equipment Market Revenue (billion), by Technology 2025 & 2033
- Figure 28: Europe US NDT Equipment Market Volume (K Unit), by Technology 2025 & 2033
- Figure 29: Europe US NDT Equipment Market Revenue Share (%), by Technology 2025 & 2033
- Figure 30: Europe US NDT Equipment Market Volume Share (%), by Technology 2025 & 2033
- Figure 31: Europe US NDT Equipment Market Revenue (billion), by End-user Industry 2025 & 2033
- Figure 32: Europe US NDT Equipment Market Volume (K Unit), by End-user Industry 2025 & 2033
- Figure 33: Europe US NDT Equipment Market Revenue Share (%), by End-user Industry 2025 & 2033
- Figure 34: Europe US NDT Equipment Market Volume Share (%), by End-user Industry 2025 & 2033
- Figure 35: Europe US NDT Equipment Market Revenue (billion), by Country 2025 & 2033
- Figure 36: Europe US NDT Equipment Market Volume (K Unit), by Country 2025 & 2033
- Figure 37: Europe US NDT Equipment Market Revenue Share (%), by Country 2025 & 2033
- Figure 38: Europe US NDT Equipment Market Volume Share (%), by Country 2025 & 2033
- Figure 39: Middle East & Africa US NDT Equipment Market Revenue (billion), by Technology 2025 & 2033
- Figure 40: Middle East & Africa US NDT Equipment Market Volume (K Unit), by Technology 2025 & 2033
- Figure 41: Middle East & Africa US NDT Equipment Market Revenue Share (%), by Technology 2025 & 2033
- Figure 42: Middle East & Africa US NDT Equipment Market Volume Share (%), by Technology 2025 & 2033
- Figure 43: Middle East & Africa US NDT Equipment Market Revenue (billion), by End-user Industry 2025 & 2033
- Figure 44: Middle East & Africa US NDT Equipment Market Volume (K Unit), by End-user Industry 2025 & 2033
- Figure 45: Middle East & Africa US NDT Equipment Market Revenue Share (%), by End-user Industry 2025 & 2033
- Figure 46: Middle East & Africa US NDT Equipment Market Volume Share (%), by End-user Industry 2025 & 2033
- Figure 47: Middle East & Africa US NDT Equipment Market Revenue (billion), by Country 2025 & 2033
- Figure 48: Middle East & Africa US NDT Equipment Market Volume (K Unit), by Country 2025 & 2033
- Figure 49: Middle East & Africa US NDT Equipment Market Revenue Share (%), by Country 2025 & 2033
- Figure 50: Middle East & Africa US NDT Equipment Market Volume Share (%), by Country 2025 & 2033
- Figure 51: Asia Pacific US NDT Equipment Market Revenue (billion), by Technology 2025 & 2033
- Figure 52: Asia Pacific US NDT Equipment Market Volume (K Unit), by Technology 2025 & 2033
- Figure 53: Asia Pacific US NDT Equipment Market Revenue Share (%), by Technology 2025 & 2033
- Figure 54: Asia Pacific US NDT Equipment Market Volume Share (%), by Technology 2025 & 2033
- Figure 55: Asia Pacific US NDT Equipment Market Revenue (billion), by End-user Industry 2025 & 2033
- Figure 56: Asia Pacific US NDT Equipment Market Volume (K Unit), by End-user Industry 2025 & 2033
- Figure 57: Asia Pacific US NDT Equipment Market Revenue Share (%), by End-user Industry 2025 & 2033
- Figure 58: Asia Pacific US NDT Equipment Market Volume Share (%), by End-user Industry 2025 & 2033
- Figure 59: Asia Pacific US NDT Equipment Market Revenue (billion), by Country 2025 & 2033
- Figure 60: Asia Pacific US NDT Equipment Market Volume (K Unit), by Country 2025 & 2033
- Figure 61: Asia Pacific US NDT Equipment Market Revenue Share (%), by Country 2025 & 2033
- Figure 62: Asia Pacific US NDT Equipment Market Volume Share (%), by Country 2025 & 2033
List of Tables
- Table 1: Global US NDT Equipment Market Revenue billion Forecast, by Technology 2020 & 2033
- Table 2: Global US NDT Equipment Market Volume K Unit Forecast, by Technology 2020 & 2033
- Table 3: Global US NDT Equipment Market Revenue billion Forecast, by End-user Industry 2020 & 2033
- Table 4: Global US NDT Equipment Market Volume K Unit Forecast, by End-user Industry 2020 & 2033
- Table 5: Global US NDT Equipment Market Revenue billion Forecast, by Region 2020 & 2033
- Table 6: Global US NDT Equipment Market Volume K Unit Forecast, by Region 2020 & 2033
- Table 7: Global US NDT Equipment Market Revenue billion Forecast, by Technology 2020 & 2033
- Table 8: Global US NDT Equipment Market Volume K Unit Forecast, by Technology 2020 & 2033
- Table 9: Global US NDT Equipment Market Revenue billion Forecast, by End-user Industry 2020 & 2033
- Table 10: Global US NDT Equipment Market Volume K Unit Forecast, by End-user Industry 2020 & 2033
- Table 11: Global US NDT Equipment Market Revenue billion Forecast, by Country 2020 & 2033
- Table 12: Global US NDT Equipment Market Volume K Unit Forecast, by Country 2020 & 2033
- Table 13: United States US NDT Equipment Market Revenue (billion) Forecast, by Application 2020 & 2033
- Table 14: United States US NDT Equipment Market Volume (K Unit) Forecast, by Application 2020 & 2033
- Table 15: Canada US NDT Equipment Market Revenue (billion) Forecast, by Application 2020 & 2033
- Table 16: Canada US NDT Equipment Market Volume (K Unit) Forecast, by Application 2020 & 2033
- Table 17: Mexico US NDT Equipment Market Revenue (billion) Forecast, by Application 2020 & 2033
- Table 18: Mexico US NDT Equipment Market Volume (K Unit) Forecast, by Application 2020 & 2033
- Table 19: Global US NDT Equipment Market Revenue billion Forecast, by Technology 2020 & 2033
- Table 20: Global US NDT Equipment Market Volume K Unit Forecast, by Technology 2020 & 2033
- Table 21: Global US NDT Equipment Market Revenue billion Forecast, by End-user Industry 2020 & 2033
- Table 22: Global US NDT Equipment Market Volume K Unit Forecast, by End-user Industry 2020 & 2033
- Table 23: Global US NDT Equipment Market Revenue billion Forecast, by Country 2020 & 2033
- Table 24: Global US NDT Equipment Market Volume K Unit Forecast, by Country 2020 & 2033
- Table 25: Brazil US NDT Equipment Market Revenue (billion) Forecast, by Application 2020 & 2033
- Table 26: Brazil US NDT Equipment Market Volume (K Unit) Forecast, by Application 2020 & 2033
- Table 27: Argentina US NDT Equipment Market Revenue (billion) Forecast, by Application 2020 & 2033
- Table 28: Argentina US NDT Equipment Market Volume (K Unit) Forecast, by Application 2020 & 2033
- Table 29: Rest of South America US NDT Equipment Market Revenue (billion) Forecast, by Application 2020 & 2033
- Table 30: Rest of South America US NDT Equipment Market Volume (K Unit) Forecast, by Application 2020 & 2033
- Table 31: Global US NDT Equipment Market Revenue billion Forecast, by Technology 2020 & 2033
- Table 32: Global US NDT Equipment Market Volume K Unit Forecast, by Technology 2020 & 2033
- Table 33: Global US NDT Equipment Market Revenue billion Forecast, by End-user Industry 2020 & 2033
- Table 34: Global US NDT Equipment Market Volume K Unit Forecast, by End-user Industry 2020 & 2033
- Table 35: Global US NDT Equipment Market Revenue billion Forecast, by Country 2020 & 2033
- Table 36: Global US NDT Equipment Market Volume K Unit Forecast, by Country 2020 & 2033
- Table 37: United Kingdom US NDT Equipment Market Revenue (billion) Forecast, by Application 2020 & 2033
- Table 38: United Kingdom US NDT Equipment Market Volume (K Unit) Forecast, by Application 2020 & 2033
- Table 39: Germany US NDT Equipment Market Revenue (billion) Forecast, by Application 2020 & 2033
- Table 40: Germany US NDT Equipment Market Volume (K Unit) Forecast, by Application 2020 & 2033
- Table 41: France US NDT Equipment Market Revenue (billion) Forecast, by Application 2020 & 2033
- Table 42: France US NDT Equipment Market Volume (K Unit) Forecast, by Application 2020 & 2033
- Table 43: Italy US NDT Equipment Market Revenue (billion) Forecast, by Application 2020 & 2033
- Table 44: Italy US NDT Equipment Market Volume (K Unit) Forecast, by Application 2020 & 2033
- Table 45: Spain US NDT Equipment Market Revenue (billion) Forecast, by Application 2020 & 2033
- Table 46: Spain US NDT Equipment Market Volume (K Unit) Forecast, by Application 2020 & 2033
- Table 47: Russia US NDT Equipment Market Revenue (billion) Forecast, by Application 2020 & 2033
- Table 48: Russia US NDT Equipment Market Volume (K Unit) Forecast, by Application 2020 & 2033
- Table 49: Benelux US NDT Equipment Market Revenue (billion) Forecast, by Application 2020 & 2033
- Table 50: Benelux US NDT Equipment Market Volume (K Unit) Forecast, by Application 2020 & 2033
- Table 51: Nordics US NDT Equipment Market Revenue (billion) Forecast, by Application 2020 & 2033
- Table 52: Nordics US NDT Equipment Market Volume (K Unit) Forecast, by Application 2020 & 2033
- Table 53: Rest of Europe US NDT Equipment Market Revenue (billion) Forecast, by Application 2020 & 2033
- Table 54: Rest of Europe US NDT Equipment Market Volume (K Unit) Forecast, by Application 2020 & 2033
- Table 55: Global US NDT Equipment Market Revenue billion Forecast, by Technology 2020 & 2033
- Table 56: Global US NDT Equipment Market Volume K Unit Forecast, by Technology 2020 & 2033
- Table 57: Global US NDT Equipment Market Revenue billion Forecast, by End-user Industry 2020 & 2033
- Table 58: Global US NDT Equipment Market Volume K Unit Forecast, by End-user Industry 2020 & 2033
- Table 59: Global US NDT Equipment Market Revenue billion Forecast, by Country 2020 & 2033
- Table 60: Global US NDT Equipment Market Volume K Unit Forecast, by Country 2020 & 2033
- Table 61: Turkey US NDT Equipment Market Revenue (billion) Forecast, by Application 2020 & 2033
- Table 62: Turkey US NDT Equipment Market Volume (K Unit) Forecast, by Application 2020 & 2033
- Table 63: Israel US NDT Equipment Market Revenue (billion) Forecast, by Application 2020 & 2033
- Table 64: Israel US NDT Equipment Market Volume (K Unit) Forecast, by Application 2020 & 2033
- Table 65: GCC US NDT Equipment Market Revenue (billion) Forecast, by Application 2020 & 2033
- Table 66: GCC US NDT Equipment Market Volume (K Unit) Forecast, by Application 2020 & 2033
- Table 67: North Africa US NDT Equipment Market Revenue (billion) Forecast, by Application 2020 & 2033
- Table 68: North Africa US NDT Equipment Market Volume (K Unit) Forecast, by Application 2020 & 2033
- Table 69: South Africa US NDT Equipment Market Revenue (billion) Forecast, by Application 2020 & 2033
- Table 70: South Africa US NDT Equipment Market Volume (K Unit) Forecast, by Application 2020 & 2033
- Table 71: Rest of Middle East & Africa US NDT Equipment Market Revenue (billion) Forecast, by Application 2020 & 2033
- Table 72: Rest of Middle East & Africa US NDT Equipment Market Volume (K Unit) Forecast, by Application 2020 & 2033
- Table 73: Global US NDT Equipment Market Revenue billion Forecast, by Technology 2020 & 2033
- Table 74: Global US NDT Equipment Market Volume K Unit Forecast, by Technology 2020 & 2033
- Table 75: Global US NDT Equipment Market Revenue billion Forecast, by End-user Industry 2020 & 2033
- Table 76: Global US NDT Equipment Market Volume K Unit Forecast, by End-user Industry 2020 & 2033
- Table 77: Global US NDT Equipment Market Revenue billion Forecast, by Country 2020 & 2033
- Table 78: Global US NDT Equipment Market Volume K Unit Forecast, by Country 2020 & 2033
- Table 79: China US NDT Equipment Market Revenue (billion) Forecast, by Application 2020 & 2033
- Table 80: China US NDT Equipment Market Volume (K Unit) Forecast, by Application 2020 & 2033
- Table 81: India US NDT Equipment Market Revenue (billion) Forecast, by Application 2020 & 2033
- Table 82: India US NDT Equipment Market Volume (K Unit) Forecast, by Application 2020 & 2033
- Table 83: Japan US NDT Equipment Market Revenue (billion) Forecast, by Application 2020 & 2033
- Table 84: Japan US NDT Equipment Market Volume (K Unit) Forecast, by Application 2020 & 2033
- Table 85: South Korea US NDT Equipment Market Revenue (billion) Forecast, by Application 2020 & 2033
- Table 86: South Korea US NDT Equipment Market Volume (K Unit) Forecast, by Application 2020 & 2033
- Table 87: ASEAN US NDT Equipment Market Revenue (billion) Forecast, by Application 2020 & 2033
- Table 88: ASEAN US NDT Equipment Market Volume (K Unit) Forecast, by Application 2020 & 2033
- Table 89: Oceania US NDT Equipment Market Revenue (billion) Forecast, by Application 2020 & 2033
- Table 90: Oceania US NDT Equipment Market Volume (K Unit) Forecast, by Application 2020 & 2033
- Table 91: Rest of Asia Pacific US NDT Equipment Market Revenue (billion) Forecast, by Application 2020 & 2033
- Table 92: Rest of Asia Pacific US NDT Equipment Market Volume (K Unit) Forecast, by Application 2020 & 2033
Frequently Asked Questions
1. What is the projected Compound Annual Growth Rate (CAGR) of the US NDT Equipment Market?
The projected CAGR is approximately 11.57%.
2. Which companies are prominent players in the US NDT Equipment Market?
Key companies in the market include TEAM Inc, National Inspection Services LLC, TesTex Inc, Baker Hughes, Mistras Group Inc, NDT Global LLC, Applied Technical Services, Triumph Group, Innerspec Technologies Inc, NVI Nondestructive & Visual Inspection.
3. What are the main segments of the US NDT Equipment Market?
The market segments include Technology, End-user Industry.
4. Can you provide details about the market size?
The market size is estimated to be USD 11.04 billion as of 2022.
5. What are some drivers contributing to market growth?
Stringent Regulations Mandating Safety; Aging Infrastructure and Increasing Need for Maintenance.
6. What are the notable trends driving market growth?
Ultrasonic Testing to Witness the Growth.
7. Are there any restraints impacting market growth?
Lack of Skilled Personnel and Training Facilities.
8. Can you provide examples of recent developments in the market?
September 2022 - Applied Technical Services announced a collaboration with C&W Meter Service, LLC, where the company will together continue to work alongside their pipeline, refinery, marketing terminal, airport refueling, and power/utility clients with no interruption to service C&W Meter Service's access to resources through this new partnership would expand its capabilities and service area.
9. What pricing options are available for accessing the report?
Pricing options include single-user, multi-user, and enterprise licenses priced at USD 3800, USD 4500, and USD 5800 respectively.
10. Is the market size provided in terms of value or volume?
The market size is provided in terms of value, measured in billion and volume, measured in K Unit.
11. Are there any specific market keywords associated with the report?
Yes, the market keyword associated with the report is "US NDT Equipment Market," which aids in identifying and referencing the specific market segment covered.
12. How do I determine which pricing option suits my needs best?
The pricing options vary based on user requirements and access needs. Individual users may opt for single-user licenses, while businesses requiring broader access may choose multi-user or enterprise licenses for cost-effective access to the report.
13. Are there any additional resources or data provided in the US NDT Equipment Market report?
While the report offers comprehensive insights, it's advisable to review the specific contents or supplementary materials provided to ascertain if additional resources or data are available.
14. How can I stay updated on further developments or reports in the US NDT Equipment Market?
To stay informed about further developments, trends, and reports in the US NDT Equipment Market, consider subscribing to industry newsletters, following relevant companies and organizations, or regularly checking reputable industry news sources and publications.
Methodology
Step 1 - Identification of Relevant Samples Size from Population Database


Step 2 - Approaches for Defining Global Market Size (Value, Volume* & Price*)

Note*: In applicable scenarios
Step 3 - Data Sources
Primary Research
- Web Analytics
- Survey Reports
- Research Institute
- Latest Research Reports
- Opinion Leaders
Secondary Research
- Annual Reports
- White Paper
- Latest Press Release
- Industry Association
- Paid Database
- Investor Presentations

Step 4 - Data Triangulation
Involves using different sources of information in order to increase the validity of a study
These sources are likely to be stakeholders in a program - participants, other researchers, program staff, other community members, and so on.
Then we put all data in single framework & apply various statistical tools to find out the dynamic on the market.
During the analysis stage, feedback from the stakeholder groups would be compared to determine areas of agreement as well as areas of divergence