

Key Insights
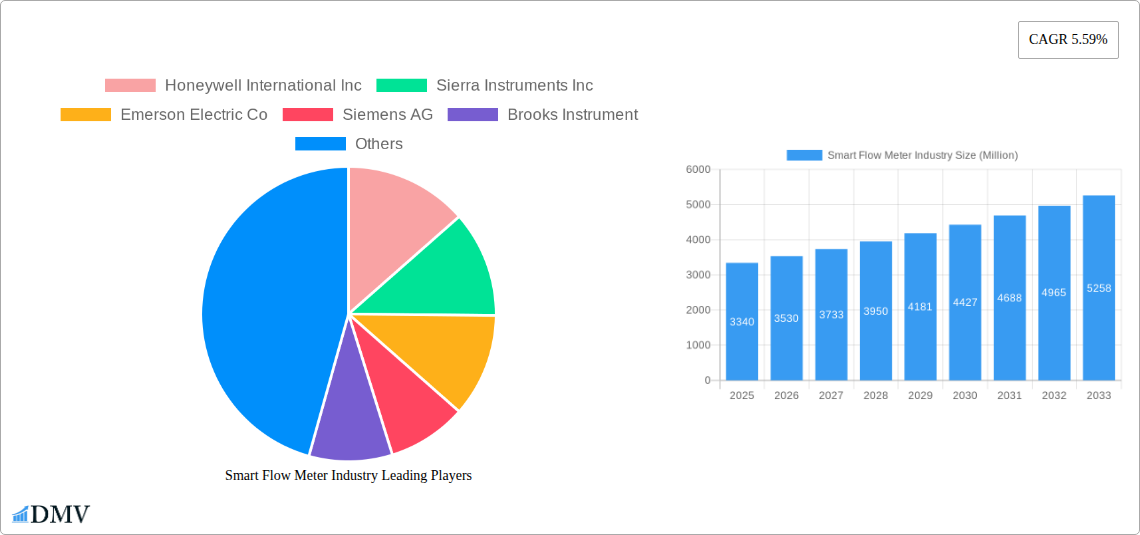
The smart flow meter market, valued at $3.34 billion in 2025, is projected to experience robust growth, driven by increasing automation in industrial processes and the rising demand for real-time data monitoring across diverse sectors. The market's Compound Annual Growth Rate (CAGR) of 5.59% from 2025 to 2033 indicates a significant expansion opportunity. Key drivers include the need for enhanced process efficiency, reduced operational costs, and improved safety measures in industries like oil and gas, pharmaceuticals, and water treatment. The preference for advanced communication protocols like Profibus, Modbus, and HART, enabling seamless integration with existing industrial automation systems, further fuels market growth. Coriolis, magnetic, and ultrasonic flow meters dominate the market by type, owing to their high accuracy and reliability. However, the adoption of newer technologies like multiphase flow meters is expected to gain momentum, driven by applications in complex fluid handling scenarios. While regulatory compliance and initial investment costs may present some restraints, the long-term benefits of improved operational efficiency and reduced environmental impact are likely to outweigh these challenges. Geographic expansion, particularly in emerging economies of Asia-Pacific, presents substantial growth potential.
The competitive landscape is characterized by both established players like Honeywell, Emerson, Siemens, and Endress+Hauser, and specialized niche companies. Technological advancements, such as the integration of IoT and AI capabilities, are shaping future market trends. The development of smart flow meters with predictive maintenance features and cloud-based data analytics platforms further enhances their value proposition. This convergence of advanced metering technologies and data analytics is expected to drive innovation and create new market opportunities in the coming years, attracting further investment and fostering greater market penetration across diverse industries. A diversified product portfolio, strong customer relationships, and strategic partnerships will be crucial for sustained success in this evolving market.
Smart Flow Meter Industry Market Report: 2019-2033
This comprehensive report provides an in-depth analysis of the global smart flow meter market, projecting a substantial growth trajectory fueled by technological advancements and rising demand across diverse industries. The study period spans from 2019 to 2033, with 2025 serving as both the base and estimated year. The forecast period extends from 2025 to 2033, while the historical period covers 2019-2024. Key players like Honeywell International Inc, Emerson Electric Co, Siemens AG, and Yokogawa Electric Corporation are analyzed, alongside market segmentation by type, communication protocol, and end-user industry. The report offers crucial insights for stakeholders, investors, and industry professionals seeking to navigate this dynamic market. The market is expected to reach xx Million by 2033.
Smart Flow Meter Industry Market Composition & Trends
The global smart flow meter market exhibits moderate concentration, with several key players holding significant market share. However, the landscape is dynamic, characterized by continuous innovation and strategic mergers and acquisitions (M&A). Market share distribution is currently estimated as follows: Honeywell International Inc. holds approximately xx% market share, followed by Emerson Electric Co. with xx%, Siemens AG at xx%, and other players distributing the remaining xx%. The total M&A activity in the industry between 2019 and 2024 reached an estimated value of xx Million. Regulatory landscapes vary across regions, influencing adoption rates and technological choices. Substitute products, while present, often lack the advanced features and data analytics capabilities of smart flow meters. End-user profiles span numerous sectors, including oil and gas, pharmaceuticals, water and wastewater, and more, each exhibiting unique requirements.
- Market Concentration: Moderately concentrated, with top players holding significant but not dominant shares.
- Innovation Catalysts: Demand for improved efficiency, data-driven insights, and remote monitoring capabilities.
- Regulatory Landscape: Varies geographically, impacting adoption and technology selection.
- Substitute Products: Exist but generally lack the advanced capabilities of smart flow meters.
- End-User Profiles: Diverse range of industries with varying needs and preferences.
- M&A Activity: Significant M&A activity observed (xx Million in deal value between 2019-2024), indicating market consolidation and expansion.
Smart Flow Meter Industry Industry Evolution
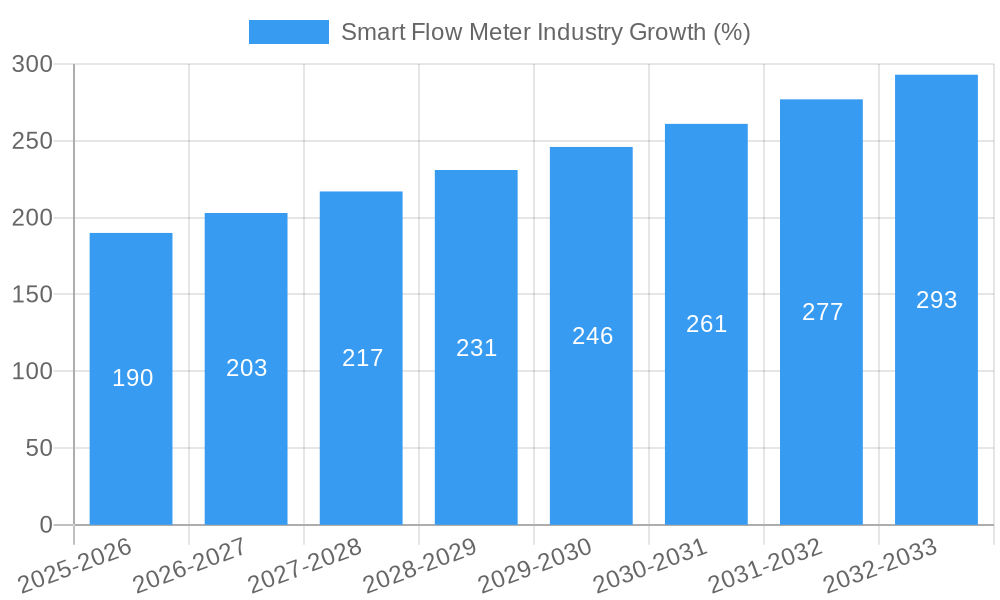
The smart flow meter industry has witnessed remarkable growth driven by the increasing adoption of smart technologies across various industrial sectors. The market expanded at a Compound Annual Growth Rate (CAGR) of xx% during the historical period (2019-2024) and is projected to maintain a CAGR of xx% throughout the forecast period (2025-2033). This growth is fueled by technological advancements such as the integration of IoT, AI, and cloud computing, enabling real-time data acquisition and analysis. The shift towards digitalization and Industry 4.0 principles further accelerates adoption. Consumer demands are increasingly focused on enhanced accuracy, reliability, and reduced maintenance costs. The market is witnessing a transition towards advanced communication protocols, such as Modbus and Profibus, facilitating seamless integration with existing infrastructure. The adoption rate of smart flow meters within specific sectors showcases considerable variation; for instance, the oil and gas industry exhibits higher adoption rates compared to other sectors due to stringent regulatory requirements and the significant economic benefits.
Leading Regions, Countries, or Segments in Smart Flow Meter Industry
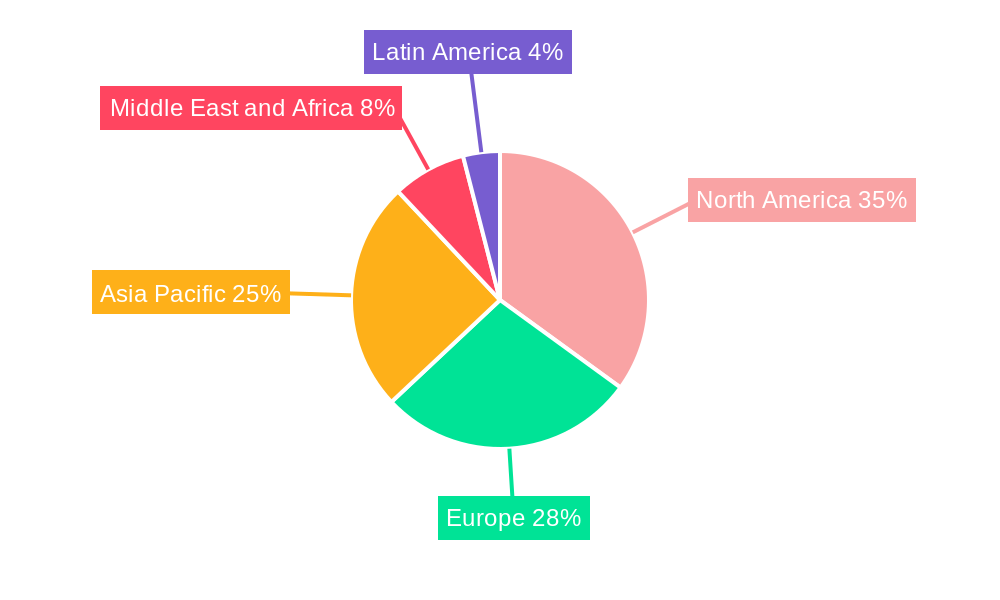
The North American region currently holds the leading position in the smart flow meter market, followed by Europe and Asia-Pacific. This dominance stems from several factors:
- North America: Strong technological advancements, well-established infrastructure, and high adoption in key industries like oil & gas contribute significantly.
- Europe: Stringent environmental regulations drive the adoption of smart meters for efficient resource management.
- Asia-Pacific: Rapid industrialization and increasing investment in infrastructure development are key growth drivers.
By Type: The Coriolis flow meter segment dominates due to its high accuracy and ability to measure various fluids. The Magnetic flow meter segment shows robust growth owing to its suitability for conductive fluids.
By Communication Protocol: Modbus and Profibus lead due to their widespread compatibility and established standards.
By End-User Industry: The Oil and Gas sector displays high adoption rates due to operational efficiency and compliance needs. However, the Water and Wastewater industry is witnessing rapid growth driven by increasing demand for accurate water measurement and leak detection.
- Key Drivers (Specific examples): Significant investments in infrastructure modernization, supportive government policies and regulations promoting smart city initiatives, increased focus on operational efficiency and cost reduction within various end-user industries.
Smart Flow Meter Industry Product Innovations
Recent innovations in smart flow meters include the integration of advanced sensors for enhanced accuracy and reliability. Miniaturization efforts result in compact designs suitable for various applications, while improved communication protocols facilitate seamless data integration. These innovations enhance functionalities such as predictive maintenance and remote monitoring capabilities. Unique selling propositions include pressure insensitivity (as seen in Brooks Instrument’s GP200 Series), enabling better performance in challenging conditions.
Propelling Factors for Smart Flow Meter Industry Growth
Technological advancements, particularly IoT and cloud computing, drive market expansion by enabling remote monitoring, predictive maintenance, and real-time data analysis. Stringent environmental regulations, coupled with a growing need for optimized resource management, incentivize adoption across sectors. Economic benefits, including cost savings through improved efficiency and reduced downtime, further propel growth.
Obstacles in the Smart Flow Meter Industry Market
High initial investment costs can present a barrier to entry for smaller businesses. Supply chain disruptions, particularly for specialized components, can hinder production and timely delivery. Intense competition among established players adds pressure on profit margins. Regulatory complexities in different regions create implementation challenges. These obstacles can lead to xx Million loss in revenue annually.
Future Opportunities in Smart Flow Meter Industry
Emerging markets in developing economies present significant growth potential. The integration of advanced analytics and AI promises enhanced data insights and improved decision-making. The development of new sensor technologies will further enhance measurement accuracy and reliability. Expansion into niche applications such as microfluidics will open up new avenues for market penetration.
Major Players in the Smart Flow Meter Industry Ecosystem
- Honeywell International Inc
- Sierra Instruments Inc
- Emerson Electric Co
- Siemens AG
- Brooks Instrument
- KROHNE Messtechnik GmbH
- Fuji Electric
- ABB Ltd
- Azbil Corporation
- Yokogawa Electric Corporation
- Endress + Hauser AG
- General Electric Company
- Teledyne Isco Inc
Key Developments in Smart Flow Meter Industry Industry
- November 2021: Brooks Instrument launched the GP200 Series pressure-based mass flow controller, marking a significant advancement in semiconductor manufacturing.
- April 2022: Yokogawa Electric Corporation released the OpreXVortex Flowmeter VY Series, enhancing remote maintenance capabilities and expanding its market reach.
Strategic Smart Flow Meter Industry Market Forecast
The smart flow meter market is poised for significant growth, driven by technological innovation, increased demand across various industries, and supportive regulatory frameworks. Emerging markets, advancements in data analytics, and the development of novel sensor technologies will further fuel market expansion. The market is expected to experience sustained growth, presenting substantial opportunities for industry players.
Smart Flow Meter Industry Segmentation
-
1. Type
- 1.1. Coriolis
- 1.2. Magnetic
- 1.3. Ultrasonic
- 1.4. Multiphase
- 1.5. Vortex
- 1.6. Variable Area
- 1.7. Differential pressure
- 1.8. Thermal
- 1.9. Turbine
-
2. Communication Protocol
- 2.1. Profibus
- 2.2. Modbus
- 2.3. Hart
- 2.4. Others
-
3. End-User Industry
- 3.1. Oil and Gas
- 3.2. Pharmaceuticals
- 3.3. Water and Wastewater
- 3.4. Paper and Pulp
- 3.5. Power Generation
- 3.6. Food and Beverages
- 3.7. Other End-User Industries
Smart Flow Meter Industry Segmentation By Geography
- 1. North America
- 2. Latin America
- 3. Europe
- 4. Asia Pacific
- 5. Middle East and Africa
Smart Flow Meter Industry REPORT HIGHLIGHTS
| Aspects | Details |
|---|---|
| Study Period | 2019-2033 |
| Base Year | 2024 |
| Estimated Year | 2025 |
| Forecast Period | 2025-2033 |
| Historical Period | 2019-2024 |
| Growth Rate | CAGR of 5.59% from 2019-2033 |
| Segmentation |
|
Table of Contents
- 1. Introduction
- 1.1. Research Scope
- 1.2. Market Segmentation
- 1.3. Research Methodology
- 1.4. Definitions and Assumptions
- 2. Executive Summary
- 2.1. Introduction
- 3. Market Dynamics
- 3.1. Introduction
- 3.2. Market Drivers
- 3.2.1. Growing Penetration of Advanced Flow Meters in the Oil and Gas Sector and Water & Wastewater Management; Penetration of IoT in Flow Rate Measurement Solutions
- 3.3. Market Restrains
- 3.3.1. Higher Cost of Intelligent Flow Meters Compared to Traditional Flow Meters; High Initial Cost for Coriolis and Magnetic Flow Meters
- 3.4. Market Trends
- 3.4.1. Food and Beverages Industry to Witness the Highest Growth
- 4. Market Factor Analysis
- 4.1. Porters Five Forces
- 4.2. Supply/Value Chain
- 4.3. PESTEL analysis
- 4.4. Market Entropy
- 4.5. Patent/Trademark Analysis
- 5. Global Smart Flow Meter Industry Analysis, Insights and Forecast, 2019-2031
- 5.1. Market Analysis, Insights and Forecast - by Type
- 5.1.1. Coriolis
- 5.1.2. Magnetic
- 5.1.3. Ultrasonic
- 5.1.4. Multiphase
- 5.1.5. Vortex
- 5.1.6. Variable Area
- 5.1.7. Differential pressure
- 5.1.8. Thermal
- 5.1.9. Turbine
- 5.2. Market Analysis, Insights and Forecast - by Communication Protocol
- 5.2.1. Profibus
- 5.2.2. Modbus
- 5.2.3. Hart
- 5.2.4. Others
- 5.3. Market Analysis, Insights and Forecast - by End-User Industry
- 5.3.1. Oil and Gas
- 5.3.2. Pharmaceuticals
- 5.3.3. Water and Wastewater
- 5.3.4. Paper and Pulp
- 5.3.5. Power Generation
- 5.3.6. Food and Beverages
- 5.3.7. Other End-User Industries
- 5.4. Market Analysis, Insights and Forecast - by Region
- 5.4.1. North America
- 5.4.2. Latin America
- 5.4.3. Europe
- 5.4.4. Asia Pacific
- 5.4.5. Middle East and Africa
- 5.1. Market Analysis, Insights and Forecast - by Type
- 6. North America Smart Flow Meter Industry Analysis, Insights and Forecast, 2019-2031
- 6.1. Market Analysis, Insights and Forecast - by Type
- 6.1.1. Coriolis
- 6.1.2. Magnetic
- 6.1.3. Ultrasonic
- 6.1.4. Multiphase
- 6.1.5. Vortex
- 6.1.6. Variable Area
- 6.1.7. Differential pressure
- 6.1.8. Thermal
- 6.1.9. Turbine
- 6.2. Market Analysis, Insights and Forecast - by Communication Protocol
- 6.2.1. Profibus
- 6.2.2. Modbus
- 6.2.3. Hart
- 6.2.4. Others
- 6.3. Market Analysis, Insights and Forecast - by End-User Industry
- 6.3.1. Oil and Gas
- 6.3.2. Pharmaceuticals
- 6.3.3. Water and Wastewater
- 6.3.4. Paper and Pulp
- 6.3.5. Power Generation
- 6.3.6. Food and Beverages
- 6.3.7. Other End-User Industries
- 6.1. Market Analysis, Insights and Forecast - by Type
- 7. Latin America Smart Flow Meter Industry Analysis, Insights and Forecast, 2019-2031
- 7.1. Market Analysis, Insights and Forecast - by Type
- 7.1.1. Coriolis
- 7.1.2. Magnetic
- 7.1.3. Ultrasonic
- 7.1.4. Multiphase
- 7.1.5. Vortex
- 7.1.6. Variable Area
- 7.1.7. Differential pressure
- 7.1.8. Thermal
- 7.1.9. Turbine
- 7.2. Market Analysis, Insights and Forecast - by Communication Protocol
- 7.2.1. Profibus
- 7.2.2. Modbus
- 7.2.3. Hart
- 7.2.4. Others
- 7.3. Market Analysis, Insights and Forecast - by End-User Industry
- 7.3.1. Oil and Gas
- 7.3.2. Pharmaceuticals
- 7.3.3. Water and Wastewater
- 7.3.4. Paper and Pulp
- 7.3.5. Power Generation
- 7.3.6. Food and Beverages
- 7.3.7. Other End-User Industries
- 7.1. Market Analysis, Insights and Forecast - by Type
- 8. Europe Smart Flow Meter Industry Analysis, Insights and Forecast, 2019-2031
- 8.1. Market Analysis, Insights and Forecast - by Type
- 8.1.1. Coriolis
- 8.1.2. Magnetic
- 8.1.3. Ultrasonic
- 8.1.4. Multiphase
- 8.1.5. Vortex
- 8.1.6. Variable Area
- 8.1.7. Differential pressure
- 8.1.8. Thermal
- 8.1.9. Turbine
- 8.2. Market Analysis, Insights and Forecast - by Communication Protocol
- 8.2.1. Profibus
- 8.2.2. Modbus
- 8.2.3. Hart
- 8.2.4. Others
- 8.3. Market Analysis, Insights and Forecast - by End-User Industry
- 8.3.1. Oil and Gas
- 8.3.2. Pharmaceuticals
- 8.3.3. Water and Wastewater
- 8.3.4. Paper and Pulp
- 8.3.5. Power Generation
- 8.3.6. Food and Beverages
- 8.3.7. Other End-User Industries
- 8.1. Market Analysis, Insights and Forecast - by Type
- 9. Asia Pacific Smart Flow Meter Industry Analysis, Insights and Forecast, 2019-2031
- 9.1. Market Analysis, Insights and Forecast - by Type
- 9.1.1. Coriolis
- 9.1.2. Magnetic
- 9.1.3. Ultrasonic
- 9.1.4. Multiphase
- 9.1.5. Vortex
- 9.1.6. Variable Area
- 9.1.7. Differential pressure
- 9.1.8. Thermal
- 9.1.9. Turbine
- 9.2. Market Analysis, Insights and Forecast - by Communication Protocol
- 9.2.1. Profibus
- 9.2.2. Modbus
- 9.2.3. Hart
- 9.2.4. Others
- 9.3. Market Analysis, Insights and Forecast - by End-User Industry
- 9.3.1. Oil and Gas
- 9.3.2. Pharmaceuticals
- 9.3.3. Water and Wastewater
- 9.3.4. Paper and Pulp
- 9.3.5. Power Generation
- 9.3.6. Food and Beverages
- 9.3.7. Other End-User Industries
- 9.1. Market Analysis, Insights and Forecast - by Type
- 10. Middle East and Africa Smart Flow Meter Industry Analysis, Insights and Forecast, 2019-2031
- 10.1. Market Analysis, Insights and Forecast - by Type
- 10.1.1. Coriolis
- 10.1.2. Magnetic
- 10.1.3. Ultrasonic
- 10.1.4. Multiphase
- 10.1.5. Vortex
- 10.1.6. Variable Area
- 10.1.7. Differential pressure
- 10.1.8. Thermal
- 10.1.9. Turbine
- 10.2. Market Analysis, Insights and Forecast - by Communication Protocol
- 10.2.1. Profibus
- 10.2.2. Modbus
- 10.2.3. Hart
- 10.2.4. Others
- 10.3. Market Analysis, Insights and Forecast - by End-User Industry
- 10.3.1. Oil and Gas
- 10.3.2. Pharmaceuticals
- 10.3.3. Water and Wastewater
- 10.3.4. Paper and Pulp
- 10.3.5. Power Generation
- 10.3.6. Food and Beverages
- 10.3.7. Other End-User Industries
- 10.1. Market Analysis, Insights and Forecast - by Type
- 11. North America Smart Flow Meter Industry Analysis, Insights and Forecast, 2019-2031
- 11.1. Market Analysis, Insights and Forecast - By Country/Sub-region
- 11.1.1.
- 12. Latin America Smart Flow Meter Industry Analysis, Insights and Forecast, 2019-2031
- 12.1. Market Analysis, Insights and Forecast - By Country/Sub-region
- 12.1.1.
- 13. Europe Smart Flow Meter Industry Analysis, Insights and Forecast, 2019-2031
- 13.1. Market Analysis, Insights and Forecast - By Country/Sub-region
- 13.1.1.
- 14. Asia Pacific Smart Flow Meter Industry Analysis, Insights and Forecast, 2019-2031
- 14.1. Market Analysis, Insights and Forecast - By Country/Sub-region
- 14.1.1.
- 15. Middle East and Africa Smart Flow Meter Industry Analysis, Insights and Forecast, 2019-2031
- 15.1. Market Analysis, Insights and Forecast - By Country/Sub-region
- 15.1.1.
- 16. Competitive Analysis
- 16.1. Global Market Share Analysis 2024
- 16.2. Company Profiles
- 16.2.1 Honeywell International Inc
- 16.2.1.1. Overview
- 16.2.1.2. Products
- 16.2.1.3. SWOT Analysis
- 16.2.1.4. Recent Developments
- 16.2.1.5. Financials (Based on Availability)
- 16.2.2 Sierra Instruments Inc
- 16.2.2.1. Overview
- 16.2.2.2. Products
- 16.2.2.3. SWOT Analysis
- 16.2.2.4. Recent Developments
- 16.2.2.5. Financials (Based on Availability)
- 16.2.3 Emerson Electric Co
- 16.2.3.1. Overview
- 16.2.3.2. Products
- 16.2.3.3. SWOT Analysis
- 16.2.3.4. Recent Developments
- 16.2.3.5. Financials (Based on Availability)
- 16.2.4 Siemens AG
- 16.2.4.1. Overview
- 16.2.4.2. Products
- 16.2.4.3. SWOT Analysis
- 16.2.4.4. Recent Developments
- 16.2.4.5. Financials (Based on Availability)
- 16.2.5 Brooks Instrument
- 16.2.5.1. Overview
- 16.2.5.2. Products
- 16.2.5.3. SWOT Analysis
- 16.2.5.4. Recent Developments
- 16.2.5.5. Financials (Based on Availability)
- 16.2.6 KROHNE Messtechnik GmbH
- 16.2.6.1. Overview
- 16.2.6.2. Products
- 16.2.6.3. SWOT Analysis
- 16.2.6.4. Recent Developments
- 16.2.6.5. Financials (Based on Availability)
- 16.2.7 Fuji Electric
- 16.2.7.1. Overview
- 16.2.7.2. Products
- 16.2.7.3. SWOT Analysis
- 16.2.7.4. Recent Developments
- 16.2.7.5. Financials (Based on Availability)
- 16.2.8 ABB Ltd *List Not Exhaustive
- 16.2.8.1. Overview
- 16.2.8.2. Products
- 16.2.8.3. SWOT Analysis
- 16.2.8.4. Recent Developments
- 16.2.8.5. Financials (Based on Availability)
- 16.2.9 Azbil Corporation
- 16.2.9.1. Overview
- 16.2.9.2. Products
- 16.2.9.3. SWOT Analysis
- 16.2.9.4. Recent Developments
- 16.2.9.5. Financials (Based on Availability)
- 16.2.10 Yokogawa Electric Corporation
- 16.2.10.1. Overview
- 16.2.10.2. Products
- 16.2.10.3. SWOT Analysis
- 16.2.10.4. Recent Developments
- 16.2.10.5. Financials (Based on Availability)
- 16.2.11 Endress + Hauser AG
- 16.2.11.1. Overview
- 16.2.11.2. Products
- 16.2.11.3. SWOT Analysis
- 16.2.11.4. Recent Developments
- 16.2.11.5. Financials (Based on Availability)
- 16.2.12 General Electric Company
- 16.2.12.1. Overview
- 16.2.12.2. Products
- 16.2.12.3. SWOT Analysis
- 16.2.12.4. Recent Developments
- 16.2.12.5. Financials (Based on Availability)
- 16.2.13 Teledyne Isco Inc
- 16.2.13.1. Overview
- 16.2.13.2. Products
- 16.2.13.3. SWOT Analysis
- 16.2.13.4. Recent Developments
- 16.2.13.5. Financials (Based on Availability)
- 16.2.1 Honeywell International Inc
List of Figures
- Figure 1: Global Smart Flow Meter Industry Revenue Breakdown (Million, %) by Region 2024 & 2032
- Figure 2: North America Smart Flow Meter Industry Revenue (Million), by Country 2024 & 2032
- Figure 3: North America Smart Flow Meter Industry Revenue Share (%), by Country 2024 & 2032
- Figure 4: Latin America Smart Flow Meter Industry Revenue (Million), by Country 2024 & 2032
- Figure 5: Latin America Smart Flow Meter Industry Revenue Share (%), by Country 2024 & 2032
- Figure 6: Europe Smart Flow Meter Industry Revenue (Million), by Country 2024 & 2032
- Figure 7: Europe Smart Flow Meter Industry Revenue Share (%), by Country 2024 & 2032
- Figure 8: Asia Pacific Smart Flow Meter Industry Revenue (Million), by Country 2024 & 2032
- Figure 9: Asia Pacific Smart Flow Meter Industry Revenue Share (%), by Country 2024 & 2032
- Figure 10: Middle East and Africa Smart Flow Meter Industry Revenue (Million), by Country 2024 & 2032
- Figure 11: Middle East and Africa Smart Flow Meter Industry Revenue Share (%), by Country 2024 & 2032
- Figure 12: North America Smart Flow Meter Industry Revenue (Million), by Type 2024 & 2032
- Figure 13: North America Smart Flow Meter Industry Revenue Share (%), by Type 2024 & 2032
- Figure 14: North America Smart Flow Meter Industry Revenue (Million), by Communication Protocol 2024 & 2032
- Figure 15: North America Smart Flow Meter Industry Revenue Share (%), by Communication Protocol 2024 & 2032
- Figure 16: North America Smart Flow Meter Industry Revenue (Million), by End-User Industry 2024 & 2032
- Figure 17: North America Smart Flow Meter Industry Revenue Share (%), by End-User Industry 2024 & 2032
- Figure 18: North America Smart Flow Meter Industry Revenue (Million), by Country 2024 & 2032
- Figure 19: North America Smart Flow Meter Industry Revenue Share (%), by Country 2024 & 2032
- Figure 20: Latin America Smart Flow Meter Industry Revenue (Million), by Type 2024 & 2032
- Figure 21: Latin America Smart Flow Meter Industry Revenue Share (%), by Type 2024 & 2032
- Figure 22: Latin America Smart Flow Meter Industry Revenue (Million), by Communication Protocol 2024 & 2032
- Figure 23: Latin America Smart Flow Meter Industry Revenue Share (%), by Communication Protocol 2024 & 2032
- Figure 24: Latin America Smart Flow Meter Industry Revenue (Million), by End-User Industry 2024 & 2032
- Figure 25: Latin America Smart Flow Meter Industry Revenue Share (%), by End-User Industry 2024 & 2032
- Figure 26: Latin America Smart Flow Meter Industry Revenue (Million), by Country 2024 & 2032
- Figure 27: Latin America Smart Flow Meter Industry Revenue Share (%), by Country 2024 & 2032
- Figure 28: Europe Smart Flow Meter Industry Revenue (Million), by Type 2024 & 2032
- Figure 29: Europe Smart Flow Meter Industry Revenue Share (%), by Type 2024 & 2032
- Figure 30: Europe Smart Flow Meter Industry Revenue (Million), by Communication Protocol 2024 & 2032
- Figure 31: Europe Smart Flow Meter Industry Revenue Share (%), by Communication Protocol 2024 & 2032
- Figure 32: Europe Smart Flow Meter Industry Revenue (Million), by End-User Industry 2024 & 2032
- Figure 33: Europe Smart Flow Meter Industry Revenue Share (%), by End-User Industry 2024 & 2032
- Figure 34: Europe Smart Flow Meter Industry Revenue (Million), by Country 2024 & 2032
- Figure 35: Europe Smart Flow Meter Industry Revenue Share (%), by Country 2024 & 2032
- Figure 36: Asia Pacific Smart Flow Meter Industry Revenue (Million), by Type 2024 & 2032
- Figure 37: Asia Pacific Smart Flow Meter Industry Revenue Share (%), by Type 2024 & 2032
- Figure 38: Asia Pacific Smart Flow Meter Industry Revenue (Million), by Communication Protocol 2024 & 2032
- Figure 39: Asia Pacific Smart Flow Meter Industry Revenue Share (%), by Communication Protocol 2024 & 2032
- Figure 40: Asia Pacific Smart Flow Meter Industry Revenue (Million), by End-User Industry 2024 & 2032
- Figure 41: Asia Pacific Smart Flow Meter Industry Revenue Share (%), by End-User Industry 2024 & 2032
- Figure 42: Asia Pacific Smart Flow Meter Industry Revenue (Million), by Country 2024 & 2032
- Figure 43: Asia Pacific Smart Flow Meter Industry Revenue Share (%), by Country 2024 & 2032
- Figure 44: Middle East and Africa Smart Flow Meter Industry Revenue (Million), by Type 2024 & 2032
- Figure 45: Middle East and Africa Smart Flow Meter Industry Revenue Share (%), by Type 2024 & 2032
- Figure 46: Middle East and Africa Smart Flow Meter Industry Revenue (Million), by Communication Protocol 2024 & 2032
- Figure 47: Middle East and Africa Smart Flow Meter Industry Revenue Share (%), by Communication Protocol 2024 & 2032
- Figure 48: Middle East and Africa Smart Flow Meter Industry Revenue (Million), by End-User Industry 2024 & 2032
- Figure 49: Middle East and Africa Smart Flow Meter Industry Revenue Share (%), by End-User Industry 2024 & 2032
- Figure 50: Middle East and Africa Smart Flow Meter Industry Revenue (Million), by Country 2024 & 2032
- Figure 51: Middle East and Africa Smart Flow Meter Industry Revenue Share (%), by Country 2024 & 2032
List of Tables
- Table 1: Global Smart Flow Meter Industry Revenue Million Forecast, by Region 2019 & 2032
- Table 2: Global Smart Flow Meter Industry Revenue Million Forecast, by Type 2019 & 2032
- Table 3: Global Smart Flow Meter Industry Revenue Million Forecast, by Communication Protocol 2019 & 2032
- Table 4: Global Smart Flow Meter Industry Revenue Million Forecast, by End-User Industry 2019 & 2032
- Table 5: Global Smart Flow Meter Industry Revenue Million Forecast, by Region 2019 & 2032
- Table 6: Global Smart Flow Meter Industry Revenue Million Forecast, by Country 2019 & 2032
- Table 7: Smart Flow Meter Industry Revenue (Million) Forecast, by Application 2019 & 2032
- Table 8: Global Smart Flow Meter Industry Revenue Million Forecast, by Country 2019 & 2032
- Table 9: Smart Flow Meter Industry Revenue (Million) Forecast, by Application 2019 & 2032
- Table 10: Global Smart Flow Meter Industry Revenue Million Forecast, by Country 2019 & 2032
- Table 11: Smart Flow Meter Industry Revenue (Million) Forecast, by Application 2019 & 2032
- Table 12: Global Smart Flow Meter Industry Revenue Million Forecast, by Country 2019 & 2032
- Table 13: Smart Flow Meter Industry Revenue (Million) Forecast, by Application 2019 & 2032
- Table 14: Global Smart Flow Meter Industry Revenue Million Forecast, by Country 2019 & 2032
- Table 15: Smart Flow Meter Industry Revenue (Million) Forecast, by Application 2019 & 2032
- Table 16: Global Smart Flow Meter Industry Revenue Million Forecast, by Type 2019 & 2032
- Table 17: Global Smart Flow Meter Industry Revenue Million Forecast, by Communication Protocol 2019 & 2032
- Table 18: Global Smart Flow Meter Industry Revenue Million Forecast, by End-User Industry 2019 & 2032
- Table 19: Global Smart Flow Meter Industry Revenue Million Forecast, by Country 2019 & 2032
- Table 20: Global Smart Flow Meter Industry Revenue Million Forecast, by Type 2019 & 2032
- Table 21: Global Smart Flow Meter Industry Revenue Million Forecast, by Communication Protocol 2019 & 2032
- Table 22: Global Smart Flow Meter Industry Revenue Million Forecast, by End-User Industry 2019 & 2032
- Table 23: Global Smart Flow Meter Industry Revenue Million Forecast, by Country 2019 & 2032
- Table 24: Global Smart Flow Meter Industry Revenue Million Forecast, by Type 2019 & 2032
- Table 25: Global Smart Flow Meter Industry Revenue Million Forecast, by Communication Protocol 2019 & 2032
- Table 26: Global Smart Flow Meter Industry Revenue Million Forecast, by End-User Industry 2019 & 2032
- Table 27: Global Smart Flow Meter Industry Revenue Million Forecast, by Country 2019 & 2032
- Table 28: Global Smart Flow Meter Industry Revenue Million Forecast, by Type 2019 & 2032
- Table 29: Global Smart Flow Meter Industry Revenue Million Forecast, by Communication Protocol 2019 & 2032
- Table 30: Global Smart Flow Meter Industry Revenue Million Forecast, by End-User Industry 2019 & 2032
- Table 31: Global Smart Flow Meter Industry Revenue Million Forecast, by Country 2019 & 2032
- Table 32: Global Smart Flow Meter Industry Revenue Million Forecast, by Type 2019 & 2032
- Table 33: Global Smart Flow Meter Industry Revenue Million Forecast, by Communication Protocol 2019 & 2032
- Table 34: Global Smart Flow Meter Industry Revenue Million Forecast, by End-User Industry 2019 & 2032
- Table 35: Global Smart Flow Meter Industry Revenue Million Forecast, by Country 2019 & 2032
Frequently Asked Questions
1. What is the projected Compound Annual Growth Rate (CAGR) of the Smart Flow Meter Industry?
The projected CAGR is approximately 5.59%.
2. Which companies are prominent players in the Smart Flow Meter Industry?
Key companies in the market include Honeywell International Inc, Sierra Instruments Inc, Emerson Electric Co, Siemens AG, Brooks Instrument, KROHNE Messtechnik GmbH, Fuji Electric, ABB Ltd *List Not Exhaustive, Azbil Corporation, Yokogawa Electric Corporation, Endress + Hauser AG, General Electric Company, Teledyne Isco Inc.
3. What are the main segments of the Smart Flow Meter Industry?
The market segments include Type, Communication Protocol, End-User Industry.
4. Can you provide details about the market size?
The market size is estimated to be USD 3.34 Million as of 2022.
5. What are some drivers contributing to market growth?
Growing Penetration of Advanced Flow Meters in the Oil and Gas Sector and Water & Wastewater Management; Penetration of IoT in Flow Rate Measurement Solutions.
6. What are the notable trends driving market growth?
Food and Beverages Industry to Witness the Highest Growth.
7. Are there any restraints impacting market growth?
Higher Cost of Intelligent Flow Meters Compared to Traditional Flow Meters; High Initial Cost for Coriolis and Magnetic Flow Meters.
8. Can you provide examples of recent developments in the market?
April 2022 - Yokogawa Electric Corporation released OpreXVortex Flowmeter VY Series. The new series will be released in Southeast Asia, Oceania, India, the Middle East, and South America, excluding Brazil. The product will support remote maintenance functions that allow condition-based maintenance.
9. What pricing options are available for accessing the report?
Pricing options include single-user, multi-user, and enterprise licenses priced at USD 4750, USD 5250, and USD 8750 respectively.
10. Is the market size provided in terms of value or volume?
The market size is provided in terms of value, measured in Million.
11. Are there any specific market keywords associated with the report?
Yes, the market keyword associated with the report is "Smart Flow Meter Industry," which aids in identifying and referencing the specific market segment covered.
12. How do I determine which pricing option suits my needs best?
The pricing options vary based on user requirements and access needs. Individual users may opt for single-user licenses, while businesses requiring broader access may choose multi-user or enterprise licenses for cost-effective access to the report.
13. Are there any additional resources or data provided in the Smart Flow Meter Industry report?
While the report offers comprehensive insights, it's advisable to review the specific contents or supplementary materials provided to ascertain if additional resources or data are available.
14. How can I stay updated on further developments or reports in the Smart Flow Meter Industry?
To stay informed about further developments, trends, and reports in the Smart Flow Meter Industry, consider subscribing to industry newsletters, following relevant companies and organizations, or regularly checking reputable industry news sources and publications.
Methodology
Step 1 - Identification of Relevant Samples Size from Population Database


Step 2 - Approaches for Defining Global Market Size (Value, Volume* & Price*)

Note*: In applicable scenarios
Step 3 - Data Sources
Primary Research
- Web Analytics
- Survey Reports
- Research Institute
- Latest Research Reports
- Opinion Leaders
Secondary Research
- Annual Reports
- White Paper
- Latest Press Release
- Industry Association
- Paid Database
- Investor Presentations

Step 4 - Data Triangulation
Involves using different sources of information in order to increase the validity of a study
These sources are likely to be stakeholders in a program - participants, other researchers, program staff, other community members, and so on.
Then we put all data in single framework & apply various statistical tools to find out the dynamic on the market.
During the analysis stage, feedback from the stakeholder groups would be compared to determine areas of agreement as well as areas of divergence
