

Key Insights
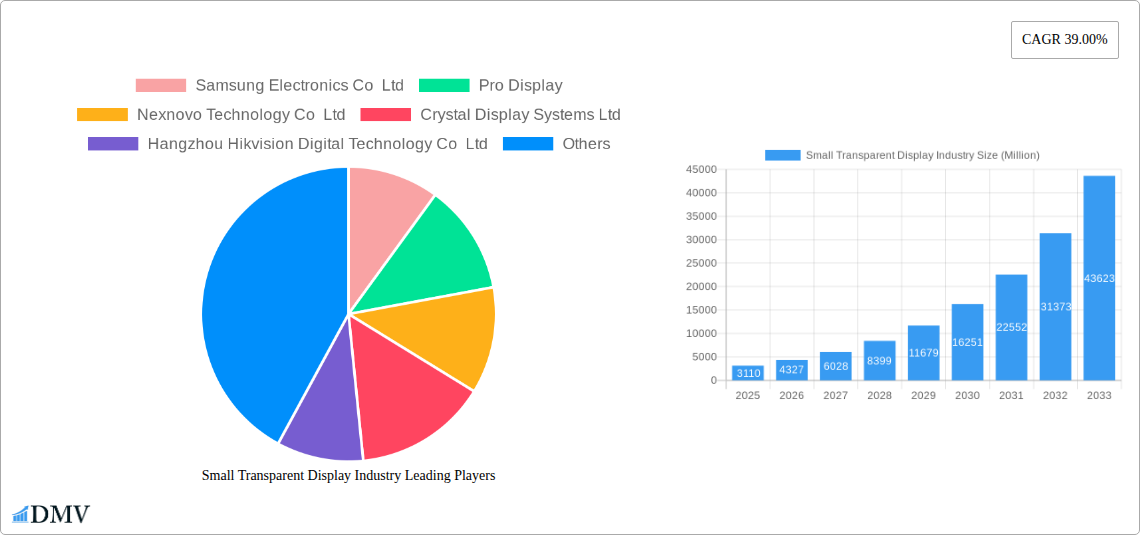
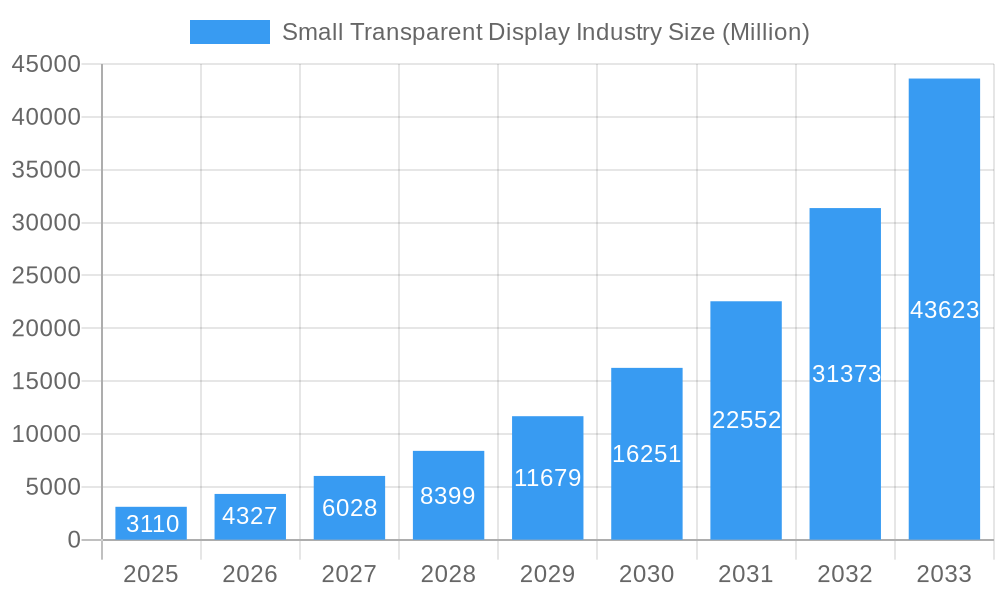
The small transparent display market is experiencing robust growth, projected to reach $3.11 billion in 2025 and maintain a Compound Annual Growth Rate (CAGR) of 39% from 2025 to 2033. This expansion is fueled by increasing demand across diverse sectors, primarily driven by advancements in display technologies like OLED and LCD, leading to improved transparency, brightness, and resolution. The retail sector, particularly in interactive displays and smart shelves, is a key driver, along with the burgeoning consumer electronics market incorporating transparent displays in smartphones, wearables, and head-up displays (HUDs). The automotive industry's adoption of transparent displays in instrument panels and advanced driver-assistance systems (ADAS) further contributes to market growth. While the aerospace and defense industries represent a smaller segment currently, their adoption is expected to increase due to the need for sophisticated, lightweight, and transparent information displays in cockpits and military equipment. Technological advancements leading to higher manufacturing yields and reduced costs are also bolstering market expansion.
Small Transparent Display Industry Market Size (In Billion)
However, the market faces challenges. The high manufacturing cost of advanced transparent display technologies like OLED compared to traditional LCDs acts as a significant restraint. Furthermore, the complexity of integrating these displays into existing systems and the need for specialized infrastructure can hinder broader adoption, particularly in smaller or less technologically advanced companies. Despite these challenges, ongoing research and development focusing on cost reduction and improved performance are expected to mitigate these restraints. The competitive landscape is characterized by a mix of established players like Samsung Electronics, LG Electronics, and BOE Technology Group alongside smaller, specialized companies focusing on niche applications. This competition fosters innovation and drives further market growth through the introduction of improved products and lower prices. The Asia Pacific region, particularly China and South Korea, are expected to dominate the market owing to the presence of major display manufacturers and a high concentration of consumer electronics and automotive industries.
Small Transparent Display Industry Company Market Share
Small Transparent Display Industry Market Report: 2019-2033
This comprehensive report provides an in-depth analysis of the small transparent display industry, projecting a market value of xx Million by 2033. The study covers the period from 2019 to 2033, with a base year of 2025 and a forecast period from 2025 to 2033. It examines market composition, technological advancements, key players, and future growth opportunities, equipping stakeholders with crucial insights for strategic decision-making.
Small Transparent Display Industry Market Composition & Trends
The small transparent display market is experiencing dynamic growth, driven by technological innovations and expanding applications across various sectors. Market concentration is moderately high, with key players like Samsung Electronics Co Ltd, LG Electronics Co Ltd, and BOE Technology Group holding significant market share. However, the emergence of innovative companies like Nexnovo Technology Co Ltd and Shenzhen AuroLED Technology Co Ltd signifies a competitive landscape. The report estimates the market share distribution for 2025 as follows: Samsung (25%), LG (20%), BOE (15%), and others (40%). Recent M&A activities, though not extensively documented, are projected to reach a total value of xx Million in the next 5 years, largely driven by consolidation among smaller players. The regulatory landscape is generally supportive of technological advancements in display technologies, with varying regulations across different regions impacting market access. Substitute products, including conventional displays and projection systems, continue to pose some competitive pressure, though the unique aesthetic and functional advantages of transparent displays are increasingly driving adoption. End-user profiles show a diverse range of applications, from retail and consumer electronics to the rapidly growing automotive and aerospace and defense sectors.
- Market Share Distribution (2025): Samsung (25%), LG (20%), BOE (15%), Others (40%)
- Projected M&A Value (Next 5 years): xx Million
- Key End-User Industries: Retail, Consumer Electronics, Automotive, Aerospace & Defense
Small Transparent Display Industry Industry Evolution
The small transparent display market has witnessed remarkable growth trajectories in recent years, primarily fueled by advancements in LCD, OLED, and emerging microLED technologies. The historical period (2019-2024) saw a Compound Annual Growth Rate (CAGR) of xx%, with the market size reaching xx Million by 2024. The forecast period (2025-2033) projects a CAGR of xx%, driven by increasing demand across various sectors. Technological advancements, such as the improvement of transparency levels, resolution, brightness, and lifespan of these displays are key factors in this growth. Consumer demand is shifting towards aesthetically pleasing and functional displays, further augmenting the market’s expansion. Adoption metrics indicate significant uptake in retail and consumer electronics, with a noticeable acceleration in the automotive sector, particularly for instrument panels and head-up displays. The market's evolution is characterized by a transition from primarily LCD-based solutions to the increasing adoption of OLED and the promising potential of microLED.
Leading Regions, Countries, or Segments in Small Transparent Display Industry
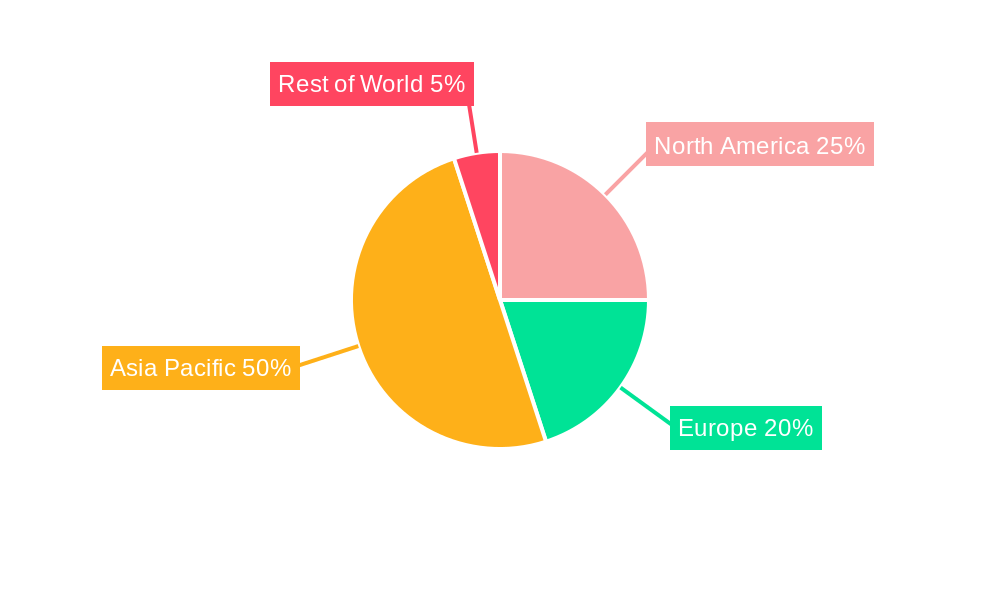
The Asia-Pacific region currently dominates the small transparent display market, driven by robust manufacturing capabilities, a large consumer base, and significant investments in technological advancements. Within this region, China and South Korea are leading countries, benefitting from strong government support for the electronics industry.
- Dominant Region: Asia-Pacific
- Leading Countries: China, South Korea
- Key Drivers:
- High Investment: Significant government funding and private investment in R&D and manufacturing.
- Robust Manufacturing Base: Well-established supply chains and manufacturing capabilities within the region.
- Strong Demand: Large consumer base and growing demand from various sectors.
By Technology: OLED technology is witnessing increasing adoption due to its superior image quality and flexibility. LCD technology still holds a significant market share, primarily due to its cost-effectiveness. Other emerging technologies, such as microLED, show strong potential for future growth but currently have limited market penetration.
By End-User Industry: The automotive industry is expected to witness the highest growth in the adoption of small transparent displays, driven by the increasing demand for advanced driver-assistance systems (ADAS) and infotainment features. Retail and consumer electronics markets remain significant sectors, with ongoing innovation in applications such as interactive displays and digital signage.
Small Transparent Display Industry Product Innovations
Recent innovations include higher transparency levels exceeding 80%, improved resolution capabilities exceeding 1000 PPI in select niche displays, and enhanced brightness to improve visibility in diverse lighting conditions. These advancements are achieved through improvements in materials science, advanced manufacturing techniques, and optimized backlighting solutions. Unique selling propositions focus on enhancing the user experience and creating seamless integration with surrounding environments through aesthetic and functional design.
Propelling Factors for Small Transparent Display Growth
Technological advancements, particularly in OLED and microLED, are driving significant growth, enabling improved brightness, resolution, and transparency. Economic factors include increasing consumer disposable income and demand for technologically advanced products. Furthermore, favorable government policies and regulations in some regions, promoting the development and adoption of innovative display technologies, contribute to the positive outlook for the industry.
Obstacles in the Small Transparent Display Industry Market
High manufacturing costs for advanced technologies like OLED and microLED remain a significant barrier to wider adoption. Supply chain disruptions, particularly related to raw materials and specialized components, can impact production and delivery timelines. Intense competition from established display manufacturers also presents a challenge.
Future Opportunities in Small Transparent Display Industry
Emerging applications in smart home devices, augmented reality (AR), and wearable technology represent significant untapped opportunities. New technologies, such as transparent microLED, hold strong potential for market expansion. Changing consumer preferences towards interactive and seamless user interfaces are further boosting the industry’s prospects.
Major Players in the Small Transparent Display Industry Ecosystem
- Samsung Electronics Co Ltd
- Pro Display
- Nexnovo Technology Co Ltd
- Crystal Display Systems Ltd
- Hangzhou Hikvision Digital Technology Co Ltd
- Planar Systems Inc (Leyard Optoelectronic Co )
- Shenzhen AuroLED Technology Co Ltd
- BOE Technology Group
- LG Electronics Co Ltd
- Panasonic Corporation
- 2Point0 Concepts
Key Developments in Small Transparent Display Industry
July 2023: Tianma unveiled transparent microLED display prototypes at Display Week 2023, targeting the automotive sector. An 8.75” panel (114 PPI, 880x480 resolution, 800 nits brightness, >70% transparency) was showcased. This highlights the advancement of microLED technology and its potential in automotive applications.
June 2023: LG Business Solutions USA showcased diverse transparent digital displays at InfoComm 2023, including LED films, a 55-inch OLED panel, and 50/30-inch transparent OLED touch displays. This demonstrates the broadening applications and design flexibility of transparent OLED technology.
Strategic Small Transparent Display Industry Market Forecast
The small transparent display market is poised for robust growth, driven by technological advancements, expanding applications across various sectors, and increasing consumer demand for aesthetically pleasing and functional displays. The market's future potential is particularly strong in automotive and AR/wearable segments, where innovative display solutions can significantly enhance the user experience. Continued investments in R&D and manufacturing capacity will further propel market expansion, presenting lucrative opportunities for industry players.
Small Transparent Display Industry Segmentation
-
1. Technology
- 1.1. LCD
- 1.2. OLED
- 1.3. Other Technologies
-
2. End-user Industry
- 2.1. Retail
- 2.2. Consumer Electronics
- 2.3. Automotive
- 2.4. Aerospace and Defense
- 2.5. Other End-user Industries
Small Transparent Display Industry Segmentation By Geography
-
1. North America
- 1.1. United States
- 1.2. Canada
-
2. Europe
- 2.1. Germany
- 2.2. United Kingdom
- 2.3. France
-
3. Asia
- 3.1. China
- 3.2. Japan
- 3.3. India
- 3.4. South Korea
- 3.5. Australia and New Zealand
- 4. Latin America
- 5. Middle East and Africa
Small Transparent Display Industry Regional Market Share
Geographic Coverage of Small Transparent Display Industry
Small Transparent Display Industry REPORT HIGHLIGHTS
| Aspects | Details |
|---|---|
| Study Period | 2020-2034 |
| Base Year | 2025 |
| Estimated Year | 2026 |
| Forecast Period | 2026-2034 |
| Historical Period | 2020-2025 |
| Growth Rate | CAGR of 39.00% from 2020-2034 |
| Segmentation |
|
Table of Contents
- 1. Introduction
- 1.1. Research Scope
- 1.2. Market Segmentation
- 1.3. Research Objective
- 1.4. Definitions and Assumptions
- 2. Executive Summary
- 2.1. Market Snapshot
- 3. Market Dynamics
- 3.1. Market Drivers
- 3.2. Market Restrains
- 3.3. Market Trends
- 3.4. Market Opportunities
- 4. Market Factor Analysis
- 4.1. Porters Five Forces
- 4.1.1. Bargaining Power of Suppliers
- 4.1.2. Bargaining Power of Buyers
- 4.1.3. Threat of New Entrants
- 4.1.4. Threat of Substitutes
- 4.1.5. Competitive Rivalry
- 4.2. PESTEL analysis
- 4.3. BCG Analysis
- 4.3.1. Stars (High Growth, High Market Share)
- 4.3.2. Cash Cows (Low Growth, High Market Share)
- 4.3.3. Question Mark (High Growth, Low Market Share)
- 4.3.4. Dogs (Low Growth, Low Market Share)
- 4.4. Ansoff Matrix Analysis
- 4.5. Supply Chain Analysis
- 4.6. Regulatory Landscape
- 4.7. Current Market Potential and Opportunity Assessment (TAM–SAM–SOM Framework)
- 4.8. DMV Analyst Note
- 4.1. Porters Five Forces
- 5. Market Analysis, Insights and Forecast 2021-2033
- 5.1. Market Analysis, Insights and Forecast - by Technology
- 5.1.1. LCD
- 5.1.2. OLED
- 5.1.3. Other Technologies
- 5.2. Market Analysis, Insights and Forecast - by End-user Industry
- 5.2.1. Retail
- 5.2.2. Consumer Electronics
- 5.2.3. Automotive
- 5.2.4. Aerospace and Defense
- 5.2.5. Other End-user Industries
- 5.3. Market Analysis, Insights and Forecast - by Region
- 5.3.1. North America
- 5.3.2. Europe
- 5.3.3. Asia
- 5.3.4. Latin America
- 5.3.5. Middle East and Africa
- 5.1. Market Analysis, Insights and Forecast - by Technology
- 6. Global Small Transparent Display Industry Analysis, Insights and Forecast, 2021-2033
- 6.1. Market Analysis, Insights and Forecast - by Technology
- 6.1.1. LCD
- 6.1.2. OLED
- 6.1.3. Other Technologies
- 6.2. Market Analysis, Insights and Forecast - by End-user Industry
- 6.2.1. Retail
- 6.2.2. Consumer Electronics
- 6.2.3. Automotive
- 6.2.4. Aerospace and Defense
- 6.2.5. Other End-user Industries
- 6.1. Market Analysis, Insights and Forecast - by Technology
- 7. North America Small Transparent Display Industry Analysis, Insights and Forecast, 2020-2032
- 7.1. Market Analysis, Insights and Forecast - by Technology
- 7.1.1. LCD
- 7.1.2. OLED
- 7.1.3. Other Technologies
- 7.2. Market Analysis, Insights and Forecast - by End-user Industry
- 7.2.1. Retail
- 7.2.2. Consumer Electronics
- 7.2.3. Automotive
- 7.2.4. Aerospace and Defense
- 7.2.5. Other End-user Industries
- 7.1. Market Analysis, Insights and Forecast - by Technology
- 8. Europe Small Transparent Display Industry Analysis, Insights and Forecast, 2020-2032
- 8.1. Market Analysis, Insights and Forecast - by Technology
- 8.1.1. LCD
- 8.1.2. OLED
- 8.1.3. Other Technologies
- 8.2. Market Analysis, Insights and Forecast - by End-user Industry
- 8.2.1. Retail
- 8.2.2. Consumer Electronics
- 8.2.3. Automotive
- 8.2.4. Aerospace and Defense
- 8.2.5. Other End-user Industries
- 8.1. Market Analysis, Insights and Forecast - by Technology
- 9. Asia Small Transparent Display Industry Analysis, Insights and Forecast, 2020-2032
- 9.1. Market Analysis, Insights and Forecast - by Technology
- 9.1.1. LCD
- 9.1.2. OLED
- 9.1.3. Other Technologies
- 9.2. Market Analysis, Insights and Forecast - by End-user Industry
- 9.2.1. Retail
- 9.2.2. Consumer Electronics
- 9.2.3. Automotive
- 9.2.4. Aerospace and Defense
- 9.2.5. Other End-user Industries
- 9.1. Market Analysis, Insights and Forecast - by Technology
- 10. Latin America Small Transparent Display Industry Analysis, Insights and Forecast, 2020-2032
- 10.1. Market Analysis, Insights and Forecast - by Technology
- 10.1.1. LCD
- 10.1.2. OLED
- 10.1.3. Other Technologies
- 10.2. Market Analysis, Insights and Forecast - by End-user Industry
- 10.2.1. Retail
- 10.2.2. Consumer Electronics
- 10.2.3. Automotive
- 10.2.4. Aerospace and Defense
- 10.2.5. Other End-user Industries
- 10.1. Market Analysis, Insights and Forecast - by Technology
- 11. Middle East and Africa Small Transparent Display Industry Analysis, Insights and Forecast, 2020-2032
- 11.1. Market Analysis, Insights and Forecast - by Technology
- 11.1.1. LCD
- 11.1.2. OLED
- 11.1.3. Other Technologies
- 11.2. Market Analysis, Insights and Forecast - by End-user Industry
- 11.2.1. Retail
- 11.2.2. Consumer Electronics
- 11.2.3. Automotive
- 11.2.4. Aerospace and Defense
- 11.2.5. Other End-user Industries
- 11.1. Market Analysis, Insights and Forecast - by Technology
- 12. Competitive Analysis
- 12.1. Company Profiles
- 12.1.1 Samsung Electronics Co Ltd
- 12.1.1.1. Company Overview
- 12.1.1.2. Products
- 12.1.1.3. Company Financials
- 12.1.1.4. SWOT Analysis
- 12.1.2 Pro Display
- 12.1.2.1. Company Overview
- 12.1.2.2. Products
- 12.1.2.3. Company Financials
- 12.1.2.4. SWOT Analysis
- 12.1.3 Nexnovo Technology Co Ltd
- 12.1.3.1. Company Overview
- 12.1.3.2. Products
- 12.1.3.3. Company Financials
- 12.1.3.4. SWOT Analysis
- 12.1.4 Crystal Display Systems Ltd
- 12.1.4.1. Company Overview
- 12.1.4.2. Products
- 12.1.4.3. Company Financials
- 12.1.4.4. SWOT Analysis
- 12.1.5 Hangzhou Hikvision Digital Technology Co Ltd
- 12.1.5.1. Company Overview
- 12.1.5.2. Products
- 12.1.5.3. Company Financials
- 12.1.5.4. SWOT Analysis
- 12.1.6 Planar Systems Inc (Leyard Optoelectronic Co )
- 12.1.6.1. Company Overview
- 12.1.6.2. Products
- 12.1.6.3. Company Financials
- 12.1.6.4. SWOT Analysis
- 12.1.7 Shenzhen AuroLED Technology Co Ltd
- 12.1.7.1. Company Overview
- 12.1.7.2. Products
- 12.1.7.3. Company Financials
- 12.1.7.4. SWOT Analysis
- 12.1.8 BOE Technology Grou
- 12.1.8.1. Company Overview
- 12.1.8.2. Products
- 12.1.8.3. Company Financials
- 12.1.8.4. SWOT Analysis
- 12.1.9 LG Electronics Co Ltd
- 12.1.9.1. Company Overview
- 12.1.9.2. Products
- 12.1.9.3. Company Financials
- 12.1.9.4. SWOT Analysis
- 12.1.10 Panasonic Corporation
- 12.1.10.1. Company Overview
- 12.1.10.2. Products
- 12.1.10.3. Company Financials
- 12.1.10.4. SWOT Analysis
- 12.1.11 2Point0 Concepts
- 12.1.11.1. Company Overview
- 12.1.11.2. Products
- 12.1.11.3. Company Financials
- 12.1.11.4. SWOT Analysis
- 12.1.1 Samsung Electronics Co Ltd
- 12.2. Market Entropy
- 12.2.1 Company's Key Areas Served
- 12.2.2 Recent Developments
- 12.3. Company Market Share Analysis 2025
- 12.3.1 Top 5 Companies Market Share Analysis
- 12.3.2 Top 3 Companies Market Share Analysis
- 12.4. List of Potential Customers
- 13. Research Methodology
List of Figures
- Figure 1: Global Small Transparent Display Industry Revenue Breakdown (Million, %) by Region 2025 & 2033
- Figure 2: North America Small Transparent Display Industry Revenue (Million), by Technology 2025 & 2033
- Figure 3: North America Small Transparent Display Industry Revenue Share (%), by Technology 2025 & 2033
- Figure 4: North America Small Transparent Display Industry Revenue (Million), by End-user Industry 2025 & 2033
- Figure 5: North America Small Transparent Display Industry Revenue Share (%), by End-user Industry 2025 & 2033
- Figure 6: North America Small Transparent Display Industry Revenue (Million), by Country 2025 & 2033
- Figure 7: North America Small Transparent Display Industry Revenue Share (%), by Country 2025 & 2033
- Figure 8: Europe Small Transparent Display Industry Revenue (Million), by Technology 2025 & 2033
- Figure 9: Europe Small Transparent Display Industry Revenue Share (%), by Technology 2025 & 2033
- Figure 10: Europe Small Transparent Display Industry Revenue (Million), by End-user Industry 2025 & 2033
- Figure 11: Europe Small Transparent Display Industry Revenue Share (%), by End-user Industry 2025 & 2033
- Figure 12: Europe Small Transparent Display Industry Revenue (Million), by Country 2025 & 2033
- Figure 13: Europe Small Transparent Display Industry Revenue Share (%), by Country 2025 & 2033
- Figure 14: Asia Small Transparent Display Industry Revenue (Million), by Technology 2025 & 2033
- Figure 15: Asia Small Transparent Display Industry Revenue Share (%), by Technology 2025 & 2033
- Figure 16: Asia Small Transparent Display Industry Revenue (Million), by End-user Industry 2025 & 2033
- Figure 17: Asia Small Transparent Display Industry Revenue Share (%), by End-user Industry 2025 & 2033
- Figure 18: Asia Small Transparent Display Industry Revenue (Million), by Country 2025 & 2033
- Figure 19: Asia Small Transparent Display Industry Revenue Share (%), by Country 2025 & 2033
- Figure 20: Latin America Small Transparent Display Industry Revenue (Million), by Technology 2025 & 2033
- Figure 21: Latin America Small Transparent Display Industry Revenue Share (%), by Technology 2025 & 2033
- Figure 22: Latin America Small Transparent Display Industry Revenue (Million), by End-user Industry 2025 & 2033
- Figure 23: Latin America Small Transparent Display Industry Revenue Share (%), by End-user Industry 2025 & 2033
- Figure 24: Latin America Small Transparent Display Industry Revenue (Million), by Country 2025 & 2033
- Figure 25: Latin America Small Transparent Display Industry Revenue Share (%), by Country 2025 & 2033
- Figure 26: Middle East and Africa Small Transparent Display Industry Revenue (Million), by Technology 2025 & 2033
- Figure 27: Middle East and Africa Small Transparent Display Industry Revenue Share (%), by Technology 2025 & 2033
- Figure 28: Middle East and Africa Small Transparent Display Industry Revenue (Million), by End-user Industry 2025 & 2033
- Figure 29: Middle East and Africa Small Transparent Display Industry Revenue Share (%), by End-user Industry 2025 & 2033
- Figure 30: Middle East and Africa Small Transparent Display Industry Revenue (Million), by Country 2025 & 2033
- Figure 31: Middle East and Africa Small Transparent Display Industry Revenue Share (%), by Country 2025 & 2033
List of Tables
- Table 1: Global Small Transparent Display Industry Revenue Million Forecast, by Technology 2020 & 2033
- Table 2: Global Small Transparent Display Industry Revenue Million Forecast, by End-user Industry 2020 & 2033
- Table 3: Global Small Transparent Display Industry Revenue Million Forecast, by Region 2020 & 2033
- Table 4: Global Small Transparent Display Industry Revenue Million Forecast, by Technology 2020 & 2033
- Table 5: Global Small Transparent Display Industry Revenue Million Forecast, by End-user Industry 2020 & 2033
- Table 6: Global Small Transparent Display Industry Revenue Million Forecast, by Country 2020 & 2033
- Table 7: United States Small Transparent Display Industry Revenue (Million) Forecast, by Application 2020 & 2033
- Table 8: Canada Small Transparent Display Industry Revenue (Million) Forecast, by Application 2020 & 2033
- Table 9: Global Small Transparent Display Industry Revenue Million Forecast, by Technology 2020 & 2033
- Table 10: Global Small Transparent Display Industry Revenue Million Forecast, by End-user Industry 2020 & 2033
- Table 11: Global Small Transparent Display Industry Revenue Million Forecast, by Country 2020 & 2033
- Table 12: Germany Small Transparent Display Industry Revenue (Million) Forecast, by Application 2020 & 2033
- Table 13: United Kingdom Small Transparent Display Industry Revenue (Million) Forecast, by Application 2020 & 2033
- Table 14: France Small Transparent Display Industry Revenue (Million) Forecast, by Application 2020 & 2033
- Table 15: Global Small Transparent Display Industry Revenue Million Forecast, by Technology 2020 & 2033
- Table 16: Global Small Transparent Display Industry Revenue Million Forecast, by End-user Industry 2020 & 2033
- Table 17: Global Small Transparent Display Industry Revenue Million Forecast, by Country 2020 & 2033
- Table 18: China Small Transparent Display Industry Revenue (Million) Forecast, by Application 2020 & 2033
- Table 19: Japan Small Transparent Display Industry Revenue (Million) Forecast, by Application 2020 & 2033
- Table 20: India Small Transparent Display Industry Revenue (Million) Forecast, by Application 2020 & 2033
- Table 21: South Korea Small Transparent Display Industry Revenue (Million) Forecast, by Application 2020 & 2033
- Table 22: Australia and New Zealand Small Transparent Display Industry Revenue (Million) Forecast, by Application 2020 & 2033
- Table 23: Global Small Transparent Display Industry Revenue Million Forecast, by Technology 2020 & 2033
- Table 24: Global Small Transparent Display Industry Revenue Million Forecast, by End-user Industry 2020 & 2033
- Table 25: Global Small Transparent Display Industry Revenue Million Forecast, by Country 2020 & 2033
- Table 26: Global Small Transparent Display Industry Revenue Million Forecast, by Technology 2020 & 2033
- Table 27: Global Small Transparent Display Industry Revenue Million Forecast, by End-user Industry 2020 & 2033
- Table 28: Global Small Transparent Display Industry Revenue Million Forecast, by Country 2020 & 2033
Frequently Asked Questions
1. What is the projected Compound Annual Growth Rate (CAGR) of the Small Transparent Display Industry?
The projected CAGR is approximately 39.00%.
2. Which companies are prominent players in the Small Transparent Display Industry?
Key companies in the market include Samsung Electronics Co Ltd, Pro Display, Nexnovo Technology Co Ltd, Crystal Display Systems Ltd, Hangzhou Hikvision Digital Technology Co Ltd, Planar Systems Inc (Leyard Optoelectronic Co ), Shenzhen AuroLED Technology Co Ltd, BOE Technology Grou, LG Electronics Co Ltd, Panasonic Corporation, 2Point0 Concepts.
3. What are the main segments of the Small Transparent Display Industry?
The market segments include Technology, End-user Industry.
4. Can you provide details about the market size?
The market size is estimated to be USD 3.11 Million as of 2022.
5. What are some drivers contributing to market growth?
Increasing Demand for Advanced Displays in the Automotive Market; Growth of Augmented and Virtual Reality.
6. What are the notable trends driving market growth?
Retail Sector to Hold a Significant Market Share.
7. Are there any restraints impacting market growth?
Complex Manufacturing Process and Expensive to Deploy in Consumer Products.
8. Can you provide examples of recent developments in the market?
Jul 2023: Tianma unveiled the latest transparent microLED display prototypes demonstrated at Display Week 2023. The company claims that the automotive sector is the primary application for these displays. The first display is an 8.75” (114 PPI) panel with an 880x480 resolution, 800 nits brightness, and more than 70% transparency.
9. What pricing options are available for accessing the report?
Pricing options include single-user, multi-user, and enterprise licenses priced at USD 4750, USD 5250, and USD 8750 respectively.
10. Is the market size provided in terms of value or volume?
The market size is provided in terms of value, measured in Million.
11. Are there any specific market keywords associated with the report?
Yes, the market keyword associated with the report is "Small Transparent Display Industry," which aids in identifying and referencing the specific market segment covered.
12. How do I determine which pricing option suits my needs best?
The pricing options vary based on user requirements and access needs. Individual users may opt for single-user licenses, while businesses requiring broader access may choose multi-user or enterprise licenses for cost-effective access to the report.
13. Are there any additional resources or data provided in the Small Transparent Display Industry report?
While the report offers comprehensive insights, it's advisable to review the specific contents or supplementary materials provided to ascertain if additional resources or data are available.
14. How can I stay updated on further developments or reports in the Small Transparent Display Industry?
To stay informed about further developments, trends, and reports in the Small Transparent Display Industry, consider subscribing to industry newsletters, following relevant companies and organizations, or regularly checking reputable industry news sources and publications.
Methodology
Step 1 - Identification of Relevant Samples Size from Population Database


Step 2 - Approaches for Defining Global Market Size (Value, Volume* & Price*)

Note*: In applicable scenarios
Step 3 - Data Sources
Primary Research
- Web Analytics
- Survey Reports
- Research Institute
- Latest Research Reports
- Opinion Leaders
Secondary Research
- Annual Reports
- White Paper
- Latest Press Release
- Industry Association
- Paid Database
- Investor Presentations

Step 4 - Data Triangulation
Involves using different sources of information in order to increase the validity of a study
These sources are likely to be stakeholders in a program - participants, other researchers, program staff, other community members, and so on.
Then we put all data in single framework & apply various statistical tools to find out the dynamic on the market.
During the analysis stage, feedback from the stakeholder groups would be compared to determine areas of agreement as well as areas of divergence