

Key Insights
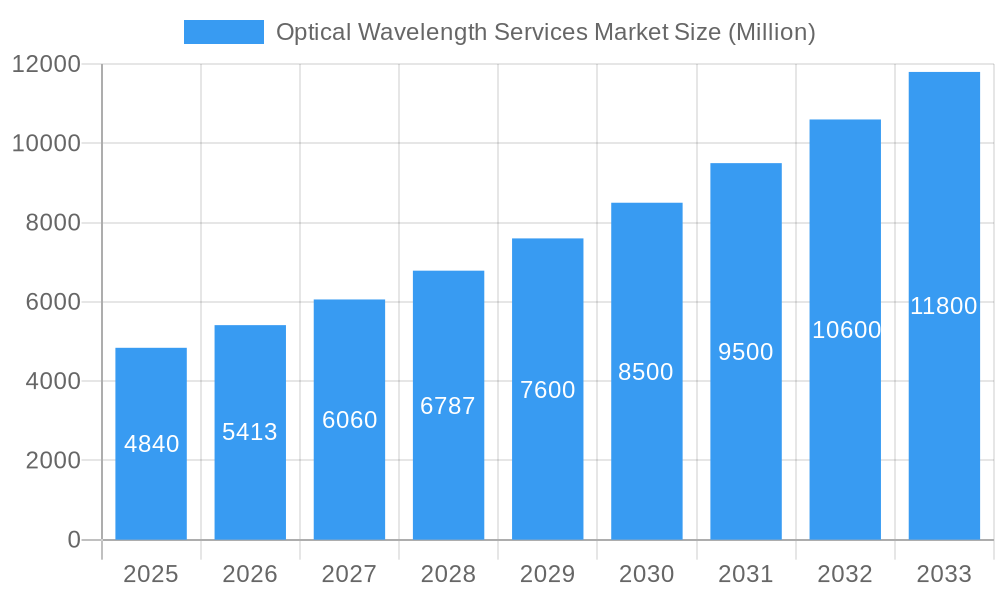
The Optical Wavelength Services market is experiencing robust growth, projected to reach \$4.84 billion in 2025 and maintain a Compound Annual Growth Rate (CAGR) of 11.71% from 2025 to 2033. This expansion is fueled by several key drivers. The increasing demand for high-bandwidth connectivity across various sectors, including cloud computing, data centers, and 5G networks, is a primary catalyst. The shift towards software-defined networking (SDN) and network function virtualization (NFV) is also contributing to market growth by improving network efficiency and flexibility. Furthermore, the rising adoption of advanced technologies like coherent optical transmission systems, enhancing transmission capacity and reach, is significantly impacting market expansion. Growth is particularly strong in regions with rapidly developing digital infrastructure, such as North America and Asia Pacific, although Europe remains a significant market.
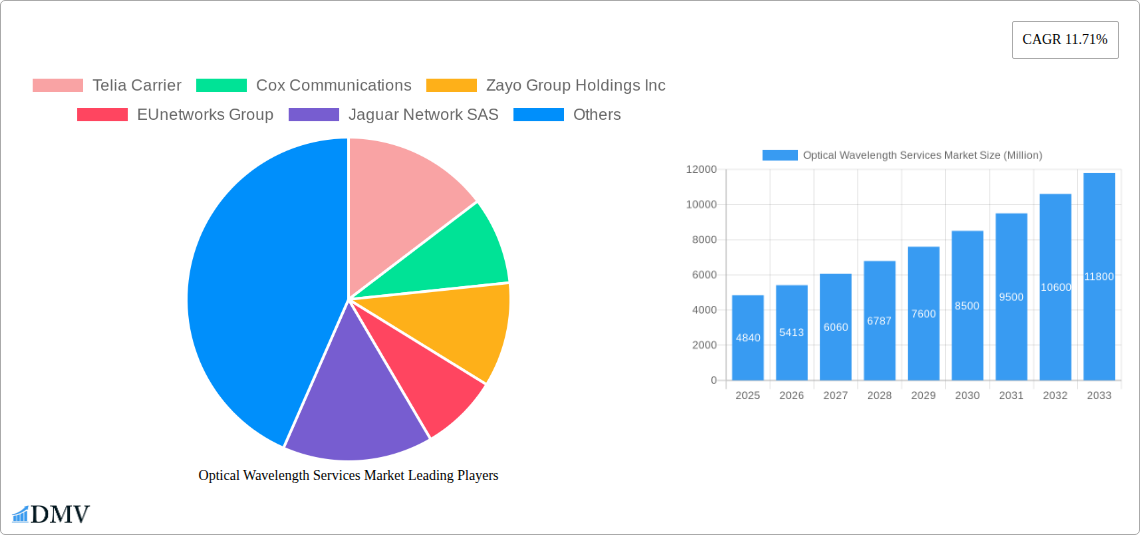
Optical Wavelength Services Market Market Size (In Billion)
However, the market also faces certain restraints. High initial investment costs associated with deploying optical wavelength services can be a barrier to entry for smaller players. Competition among established telecommunication companies is intense, leading to price pressures. Technological advancements are rapid, demanding constant adaptation and upgrades, presenting challenges for maintaining profitability. Nevertheless, the overall market outlook remains positive due to the long-term trend of increasing data traffic and the continued importance of high-speed, reliable network infrastructure across all industries. Segmentation by bandwidth reveals a growing preference for higher bandwidth solutions, with 100 Gbps and above segments exhibiting the strongest growth. Key players like Telia Carrier, Comcast, and Verizon are actively shaping the market through strategic partnerships, capacity expansions, and technological innovations. The long-term forecast anticipates continued market growth driven by the sustained demand for high-bandwidth connectivity in a digitally transforming world.
Optical Wavelength Services Market Company Market Share
Optical Wavelength Services Market: A Comprehensive Report (2019-2033)
This insightful report provides a detailed analysis of the Optical Wavelength Services Market, offering a comprehensive overview of market trends, leading players, technological advancements, and future growth opportunities. The study period spans from 2019 to 2033, with 2025 serving as the base and estimated year. The forecast period is 2025-2033, and the historical period covers 2019-2024. The market is segmented by bandwidth: Less than 10 Gbps, 40 Gbps, 100 Gbps, and More Than 100 Gbps. The total market value is projected to reach xx Million by 2033.
Optical Wavelength Services Market Market Composition & Trends
This section delves into the competitive landscape of the optical wavelength services market, evaluating market concentration, innovation drivers, regulatory influences, and substitute product analysis. We analyze market share distribution among key players, highlighting M&A activities and their impact on market dynamics. The analysis incorporates detailed profiles of end-users and assesses the overall market concentration. For example, the market share of the top 5 players in 2024 was approximately xx%, with significant variations observed across different bandwidth segments. M&A activities in the period 2019-2024 totaled approximately xx Million in deal value, largely driven by consolidation among smaller players.
- Market Concentration: Highly concentrated with a few dominant players controlling a significant portion of the market share.
- Innovation Catalysts: Increasing demand for high-bandwidth applications and advancements in optical fiber technology.
- Regulatory Landscape: Government initiatives promoting digital infrastructure development influence market growth.
- Substitute Products: Limited direct substitutes, with competition primarily focused on alternative transmission technologies.
- End-User Profiles: Telecommunication carriers, cloud service providers, and large enterprises constitute the primary end-users.
- M&A Activities: Consolidation is a significant trend, driving market concentration and influencing pricing strategies.
Optical Wavelength Services Market Industry Evolution
This section provides a thorough analysis of the optical wavelength services market's evolution, examining growth trajectories, technological advancements, and the evolution of consumer demands. The market exhibited a CAGR of xx% during the historical period (2019-2024), driven by the widespread adoption of cloud computing, 5G networks, and increased data consumption. Technological advancements, such as the introduction of coherent optical systems and 400G/800G transmission technologies, have significantly enhanced network capacity and efficiency. The shift towards software-defined networking (SDN) and network function virtualization (NFV) is further reshaping the market landscape. The adoption rate of 100 Gbps and higher bandwidth solutions is accelerating, reflecting the growing demand for higher data rates and lower latency. The forecast period (2025-2033) is expected to witness continued growth, fueled by expanding network infrastructure and the emergence of new applications.
Leading Regions, Countries, or Segments in Optical Wavelength Services Market
North America currently dominates the optical wavelength services market, driven by robust investments in network infrastructure, the presence of major telecommunication carriers, and a high concentration of data centers.
- Key Drivers in North America:
- High capital expenditure by major telecom operators.
- Strong government support for broadband infrastructure development.
- Rapid adoption of cloud services and data center expansion.
- Europe: Significant growth is anticipated due to increasing digitalization and government initiatives.
- Asia-Pacific: The region is witnessing rapid growth driven by increasing internet penetration and investments in 5G infrastructure.
- Bandwidth Segmentation: The 'More Than 100 Gbps' segment demonstrates the fastest growth rate, reflecting the increasing demand for higher bandwidth capacity.
The dominance of North America stems from the strong presence of major telecom providers such as Verizon, AT&T, and Lumen Technologies, along with significant investments in fiber optic network expansion. This robust infrastructure supports the high demand for high-bandwidth services from cloud providers and large enterprises, fueling the market's growth in this region.
Optical Wavelength Services Market Product Innovations
Recent years have witnessed significant advancements in optical wavelength technology, including the introduction of 400G and 800G coherent optical systems, enhancing spectral efficiency and transmission capacity. These innovations are enabling the delivery of higher bandwidth services at lower costs, catering to the growing demand for high-speed data transmission. Furthermore, the integration of software-defined networking (SDN) and network function virtualization (NFV) is enabling greater network flexibility and programmability, allowing for more efficient network management and service provisioning. The development of advanced optical amplification technologies further contributes to extending transmission distances and improving network reach.
Propelling Factors for Optical Wavelength Services Market Growth
The Optical Wavelength Services Market is experiencing robust growth, driven by several key factors. The surging demand for high-bandwidth applications, such as cloud computing, video streaming, and the Internet of Things (IoT), necessitates advanced network infrastructure capable of handling massive data volumes. Government initiatives aimed at expanding broadband infrastructure and promoting digitalization are providing significant impetus. Furthermore, the ongoing technological advancements in optical fiber technology are constantly enhancing transmission capacity and reducing costs. The increasing adoption of 5G networks is also contributing to the market's expansion by significantly increasing demand for high-speed, low-latency connectivity.
Obstacles in the Optical Wavelength Services Market Market
Despite significant growth potential, the market faces certain challenges. The high initial investment required for deploying optical fiber networks can be a barrier to entry for smaller players. Supply chain disruptions impacting the availability of crucial components like optical transceivers can impede market growth. Intense competition among established players and the emergence of new entrants also create pressure on pricing and profitability. Regulatory hurdles and differing standards across regions can hinder seamless network integration and expansion.
Future Opportunities in Optical Wavelength Services Market
The future of the Optical Wavelength Services Market holds significant promise. The emergence of new technologies like coherent optical transmission systems and flexible grid networking will unlock even higher bandwidth capabilities. Expanding into underserved regions and markets presents substantial growth potential. The growing adoption of edge computing necessitates localized high-bandwidth connectivity, creating new demand opportunities. The increasing demand for secure and reliable data transmission will drive the adoption of advanced encryption and security solutions.
Major Players in the Optical Wavelength Services Market Ecosystem
- Telia Carrier
- Cox Communications
- Zayo Group Holdings Inc
- EUnetworks Group
- Jaguar Network SAS
- Charter Communications
- Comcast Corporation
- Exascale Limite
- Verizon Communications Inc
- GTT Communications Inc
- Crown Castle Inc
- CarrierBid Communications
- Colt Technology Services Group Limited
- Nokia Corporation
- Lumen Technologies Inc
- Windstream Holdings Inc
- AT&T Inc
- T-Mobile US Inc
Key Developments in Optical Wavelength Services Market Industry
- January 2023: Lumen Technologies launched 400 Gbps wavelength networks across 70 US markets, covering 240 data centers with over 50 TB of 400G wavelengths and offering a self-service tool for clients. This significantly expands high-bandwidth capacity and enhances service accessibility.
- October 2022: LOGIX Fiber Networks and Ciena partnered to launch 100G wavelength services for enterprise and carrier customers, addressing the increasing demand for high-speed connectivity fueled by cloud services, video streaming, and content consumption. This collaboration strengthens the market offering and expands reach.
Strategic Optical Wavelength Services Market Market Forecast
The Optical Wavelength Services Market is poised for sustained growth driven by ongoing technological advancements, increasing data consumption, and the expansion of network infrastructure globally. The continued adoption of higher bandwidth solutions like 400G and 800G, coupled with the proliferation of 5G networks and edge computing, will propel market expansion. The development of innovative services and applications leveraging the enhanced capacity and speed of optical wavelength technology will unlock further growth opportunities in the coming years. The market is expected to experience a strong CAGR of xx% during the forecast period (2025-2033).
Optical Wavelength Services Market Segmentation
-
1. Bandwidth
- 1.1. Less than 10 Gbps
- 1.2. 40 Gbps
- 1.3. 100 Gbps
- 1.4. More Than 100 Gbps
Optical Wavelength Services Market Segmentation By Geography
- 1. North America
- 2. Europe
- 3. Asia Pacific
- 4. Rest of the World
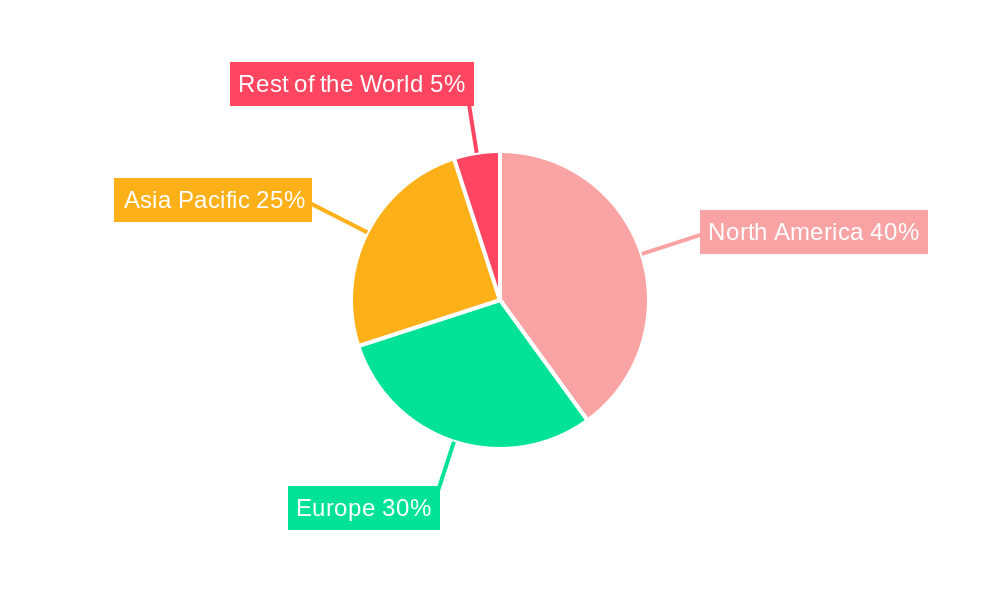
Optical Wavelength Services Market Regional Market Share
Geographic Coverage of Optical Wavelength Services Market
Optical Wavelength Services Market REPORT HIGHLIGHTS
| Aspects | Details |
|---|---|
| Study Period | 2020-2034 |
| Base Year | 2025 |
| Estimated Year | 2026 |
| Forecast Period | 2026-2034 |
| Historical Period | 2020-2025 |
| Growth Rate | CAGR of 11.71% from 2020-2034 |
| Segmentation |
|
Table of Contents
- 1. Introduction
- 1.1. Research Scope
- 1.2. Market Segmentation
- 1.3. Research Objective
- 1.4. Definitions and Assumptions
- 2. Executive Summary
- 2.1. Market Snapshot
- 3. Market Dynamics
- 3.1. Market Drivers
- 3.2. Market Restrains
- 3.3. Market Trends
- 3.4. Market Opportunities
- 4. Market Factor Analysis
- 4.1. Porters Five Forces
- 4.1.1. Bargaining Power of Suppliers
- 4.1.2. Bargaining Power of Buyers
- 4.1.3. Threat of New Entrants
- 4.1.4. Threat of Substitutes
- 4.1.5. Competitive Rivalry
- 4.2. PESTEL analysis
- 4.3. BCG Analysis
- 4.3.1. Stars (High Growth, High Market Share)
- 4.3.2. Cash Cows (Low Growth, High Market Share)
- 4.3.3. Question Mark (High Growth, Low Market Share)
- 4.3.4. Dogs (Low Growth, Low Market Share)
- 4.4. Ansoff Matrix Analysis
- 4.5. Supply Chain Analysis
- 4.6. Regulatory Landscape
- 4.7. Current Market Potential and Opportunity Assessment (TAM–SAM–SOM Framework)
- 4.8. DMV Analyst Note
- 4.1. Porters Five Forces
- 5. Market Analysis, Insights and Forecast 2021-2033
- 5.1. Market Analysis, Insights and Forecast - by Bandwidth
- 5.1.1. Less than 10 Gbps
- 5.1.2. 40 Gbps
- 5.1.3. 100 Gbps
- 5.1.4. More Than 100 Gbps
- 5.2. Market Analysis, Insights and Forecast - by Region
- 5.2.1. North America
- 5.2.2. Europe
- 5.2.3. Asia Pacific
- 5.2.4. Rest of the World
- 5.1. Market Analysis, Insights and Forecast - by Bandwidth
- 6. Global Optical Wavelength Services Market Analysis, Insights and Forecast, 2021-2033
- 6.1. Market Analysis, Insights and Forecast - by Bandwidth
- 6.1.1. Less than 10 Gbps
- 6.1.2. 40 Gbps
- 6.1.3. 100 Gbps
- 6.1.4. More Than 100 Gbps
- 6.1. Market Analysis, Insights and Forecast - by Bandwidth
- 7. North America Optical Wavelength Services Market Analysis, Insights and Forecast, 2020-2032
- 7.1. Market Analysis, Insights and Forecast - by Bandwidth
- 7.1.1. Less than 10 Gbps
- 7.1.2. 40 Gbps
- 7.1.3. 100 Gbps
- 7.1.4. More Than 100 Gbps
- 7.1. Market Analysis, Insights and Forecast - by Bandwidth
- 8. Europe Optical Wavelength Services Market Analysis, Insights and Forecast, 2020-2032
- 8.1. Market Analysis, Insights and Forecast - by Bandwidth
- 8.1.1. Less than 10 Gbps
- 8.1.2. 40 Gbps
- 8.1.3. 100 Gbps
- 8.1.4. More Than 100 Gbps
- 8.1. Market Analysis, Insights and Forecast - by Bandwidth
- 9. Asia Pacific Optical Wavelength Services Market Analysis, Insights and Forecast, 2020-2032
- 9.1. Market Analysis, Insights and Forecast - by Bandwidth
- 9.1.1. Less than 10 Gbps
- 9.1.2. 40 Gbps
- 9.1.3. 100 Gbps
- 9.1.4. More Than 100 Gbps
- 9.1. Market Analysis, Insights and Forecast - by Bandwidth
- 10. Rest of the World Optical Wavelength Services Market Analysis, Insights and Forecast, 2020-2032
- 10.1. Market Analysis, Insights and Forecast - by Bandwidth
- 10.1.1. Less than 10 Gbps
- 10.1.2. 40 Gbps
- 10.1.3. 100 Gbps
- 10.1.4. More Than 100 Gbps
- 10.1. Market Analysis, Insights and Forecast - by Bandwidth
- 11. Competitive Analysis
- 11.1. Company Profiles
- 11.1.1 Telia Carrier
- 11.1.1.1. Company Overview
- 11.1.1.2. Products
- 11.1.1.3. Company Financials
- 11.1.1.4. SWOT Analysis
- 11.1.2 Cox Communications
- 11.1.2.1. Company Overview
- 11.1.2.2. Products
- 11.1.2.3. Company Financials
- 11.1.2.4. SWOT Analysis
- 11.1.3 Zayo Group Holdings Inc
- 11.1.3.1. Company Overview
- 11.1.3.2. Products
- 11.1.3.3. Company Financials
- 11.1.3.4. SWOT Analysis
- 11.1.4 EUnetworks Group
- 11.1.4.1. Company Overview
- 11.1.4.2. Products
- 11.1.4.3. Company Financials
- 11.1.4.4. SWOT Analysis
- 11.1.5 Jaguar Network SAS
- 11.1.5.1. Company Overview
- 11.1.5.2. Products
- 11.1.5.3. Company Financials
- 11.1.5.4. SWOT Analysis
- 11.1.6 Charter Communications
- 11.1.6.1. Company Overview
- 11.1.6.2. Products
- 11.1.6.3. Company Financials
- 11.1.6.4. SWOT Analysis
- 11.1.7 Comcast Corporation
- 11.1.7.1. Company Overview
- 11.1.7.2. Products
- 11.1.7.3. Company Financials
- 11.1.7.4. SWOT Analysis
- 11.1.8 Exascale Limite
- 11.1.8.1. Company Overview
- 11.1.8.2. Products
- 11.1.8.3. Company Financials
- 11.1.8.4. SWOT Analysis
- 11.1.9 Verizon Communications Inc
- 11.1.9.1. Company Overview
- 11.1.9.2. Products
- 11.1.9.3. Company Financials
- 11.1.9.4. SWOT Analysis
- 11.1.10 GTT Communications Inc
- 11.1.10.1. Company Overview
- 11.1.10.2. Products
- 11.1.10.3. Company Financials
- 11.1.10.4. SWOT Analysis
- 11.1.11 Crown Castle Inc
- 11.1.11.1. Company Overview
- 11.1.11.2. Products
- 11.1.11.3. Company Financials
- 11.1.11.4. SWOT Analysis
- 11.1.12 CarrierBid Communications
- 11.1.12.1. Company Overview
- 11.1.12.2. Products
- 11.1.12.3. Company Financials
- 11.1.12.4. SWOT Analysis
- 11.1.13 Colt Technology Services Group Limited
- 11.1.13.1. Company Overview
- 11.1.13.2. Products
- 11.1.13.3. Company Financials
- 11.1.13.4. SWOT Analysis
- 11.1.14 Nokia Corporation
- 11.1.14.1. Company Overview
- 11.1.14.2. Products
- 11.1.14.3. Company Financials
- 11.1.14.4. SWOT Analysis
- 11.1.15 Lumen Technologies Inc
- 11.1.15.1. Company Overview
- 11.1.15.2. Products
- 11.1.15.3. Company Financials
- 11.1.15.4. SWOT Analysis
- 11.1.16 Windstream Holdings Inc
- 11.1.16.1. Company Overview
- 11.1.16.2. Products
- 11.1.16.3. Company Financials
- 11.1.16.4. SWOT Analysis
- 11.1.17 AT&T Inc
- 11.1.17.1. Company Overview
- 11.1.17.2. Products
- 11.1.17.3. Company Financials
- 11.1.17.4. SWOT Analysis
- 11.1.18 T-Mobile US Inc
- 11.1.18.1. Company Overview
- 11.1.18.2. Products
- 11.1.18.3. Company Financials
- 11.1.18.4. SWOT Analysis
- 11.1.1 Telia Carrier
- 11.2. Market Entropy
- 11.2.1 Company's Key Areas Served
- 11.2.2 Recent Developments
- 11.3. Company Market Share Analysis 2025
- 11.3.1 Top 5 Companies Market Share Analysis
- 11.3.2 Top 3 Companies Market Share Analysis
- 11.4. List of Potential Customers
- 12. Research Methodology
List of Figures
- Figure 1: Global Optical Wavelength Services Market Revenue Breakdown (Million, %) by Region 2025 & 2033
- Figure 2: North America Optical Wavelength Services Market Revenue (Million), by Bandwidth 2025 & 2033
- Figure 3: North America Optical Wavelength Services Market Revenue Share (%), by Bandwidth 2025 & 2033
- Figure 4: North America Optical Wavelength Services Market Revenue (Million), by Country 2025 & 2033
- Figure 5: North America Optical Wavelength Services Market Revenue Share (%), by Country 2025 & 2033
- Figure 6: Europe Optical Wavelength Services Market Revenue (Million), by Bandwidth 2025 & 2033
- Figure 7: Europe Optical Wavelength Services Market Revenue Share (%), by Bandwidth 2025 & 2033
- Figure 8: Europe Optical Wavelength Services Market Revenue (Million), by Country 2025 & 2033
- Figure 9: Europe Optical Wavelength Services Market Revenue Share (%), by Country 2025 & 2033
- Figure 10: Asia Pacific Optical Wavelength Services Market Revenue (Million), by Bandwidth 2025 & 2033
- Figure 11: Asia Pacific Optical Wavelength Services Market Revenue Share (%), by Bandwidth 2025 & 2033
- Figure 12: Asia Pacific Optical Wavelength Services Market Revenue (Million), by Country 2025 & 2033
- Figure 13: Asia Pacific Optical Wavelength Services Market Revenue Share (%), by Country 2025 & 2033
- Figure 14: Rest of the World Optical Wavelength Services Market Revenue (Million), by Bandwidth 2025 & 2033
- Figure 15: Rest of the World Optical Wavelength Services Market Revenue Share (%), by Bandwidth 2025 & 2033
- Figure 16: Rest of the World Optical Wavelength Services Market Revenue (Million), by Country 2025 & 2033
- Figure 17: Rest of the World Optical Wavelength Services Market Revenue Share (%), by Country 2025 & 2033
List of Tables
- Table 1: Global Optical Wavelength Services Market Revenue Million Forecast, by Bandwidth 2020 & 2033
- Table 2: Global Optical Wavelength Services Market Revenue Million Forecast, by Region 2020 & 2033
- Table 3: Global Optical Wavelength Services Market Revenue Million Forecast, by Bandwidth 2020 & 2033
- Table 4: Global Optical Wavelength Services Market Revenue Million Forecast, by Country 2020 & 2033
- Table 5: Global Optical Wavelength Services Market Revenue Million Forecast, by Bandwidth 2020 & 2033
- Table 6: Global Optical Wavelength Services Market Revenue Million Forecast, by Country 2020 & 2033
- Table 7: Global Optical Wavelength Services Market Revenue Million Forecast, by Bandwidth 2020 & 2033
- Table 8: Global Optical Wavelength Services Market Revenue Million Forecast, by Country 2020 & 2033
- Table 9: Global Optical Wavelength Services Market Revenue Million Forecast, by Bandwidth 2020 & 2033
- Table 10: Global Optical Wavelength Services Market Revenue Million Forecast, by Country 2020 & 2033
Frequently Asked Questions
1. What is the projected Compound Annual Growth Rate (CAGR) of the Optical Wavelength Services Market?
The projected CAGR is approximately 11.71%.
2. Which companies are prominent players in the Optical Wavelength Services Market?
Key companies in the market include Telia Carrier, Cox Communications, Zayo Group Holdings Inc, EUnetworks Group, Jaguar Network SAS, Charter Communications, Comcast Corporation, Exascale Limite, Verizon Communications Inc, GTT Communications Inc, Crown Castle Inc, CarrierBid Communications, Colt Technology Services Group Limited, Nokia Corporation, Lumen Technologies Inc, Windstream Holdings Inc, AT&T Inc, T-Mobile US Inc.
3. What are the main segments of the Optical Wavelength Services Market?
The market segments include Bandwidth.
4. Can you provide details about the market size?
The market size is estimated to be USD 4.84 Million as of 2022.
5. What are some drivers contributing to market growth?
Growing Demand for the Internet; Accelerated Bandwidth-intensive Applications.
6. What are the notable trends driving market growth?
Less than 10 Gbps Bandwidth Segment is Expected to Hold Significant Market Share.
7. Are there any restraints impacting market growth?
Limited Availability of Incremental Bandwidth; Increasing Demand for Virtual Connectivity.
8. Can you provide examples of recent developments in the market?
January 2023: Lumen Technologies started distributing 400 Gbps wavelength networks in the United States. The company will serve 70 markets across the country, covering 240 data centers with more than 50 TB of 400 G wavelengths. Additionally, Lumen will provide its clients with a self-service tool that allows them to quote, design, and build their wavelengths across Lumen's North American Network.
9. What pricing options are available for accessing the report?
Pricing options include single-user, multi-user, and enterprise licenses priced at USD 4750, USD 5250, and USD 8750 respectively.
10. Is the market size provided in terms of value or volume?
The market size is provided in terms of value, measured in Million.
11. Are there any specific market keywords associated with the report?
Yes, the market keyword associated with the report is "Optical Wavelength Services Market," which aids in identifying and referencing the specific market segment covered.
12. How do I determine which pricing option suits my needs best?
The pricing options vary based on user requirements and access needs. Individual users may opt for single-user licenses, while businesses requiring broader access may choose multi-user or enterprise licenses for cost-effective access to the report.
13. Are there any additional resources or data provided in the Optical Wavelength Services Market report?
While the report offers comprehensive insights, it's advisable to review the specific contents or supplementary materials provided to ascertain if additional resources or data are available.
14. How can I stay updated on further developments or reports in the Optical Wavelength Services Market?
To stay informed about further developments, trends, and reports in the Optical Wavelength Services Market, consider subscribing to industry newsletters, following relevant companies and organizations, or regularly checking reputable industry news sources and publications.
Methodology
Step 1 - Identification of Relevant Samples Size from Population Database


Step 2 - Approaches for Defining Global Market Size (Value, Volume* & Price*)

Note*: In applicable scenarios
Step 3 - Data Sources
Primary Research
- Web Analytics
- Survey Reports
- Research Institute
- Latest Research Reports
- Opinion Leaders
Secondary Research
- Annual Reports
- White Paper
- Latest Press Release
- Industry Association
- Paid Database
- Investor Presentations

Step 4 - Data Triangulation
Involves using different sources of information in order to increase the validity of a study
These sources are likely to be stakeholders in a program - participants, other researchers, program staff, other community members, and so on.
Then we put all data in single framework & apply various statistical tools to find out the dynamic on the market.
During the analysis stage, feedback from the stakeholder groups would be compared to determine areas of agreement as well as areas of divergence