

Key Insights
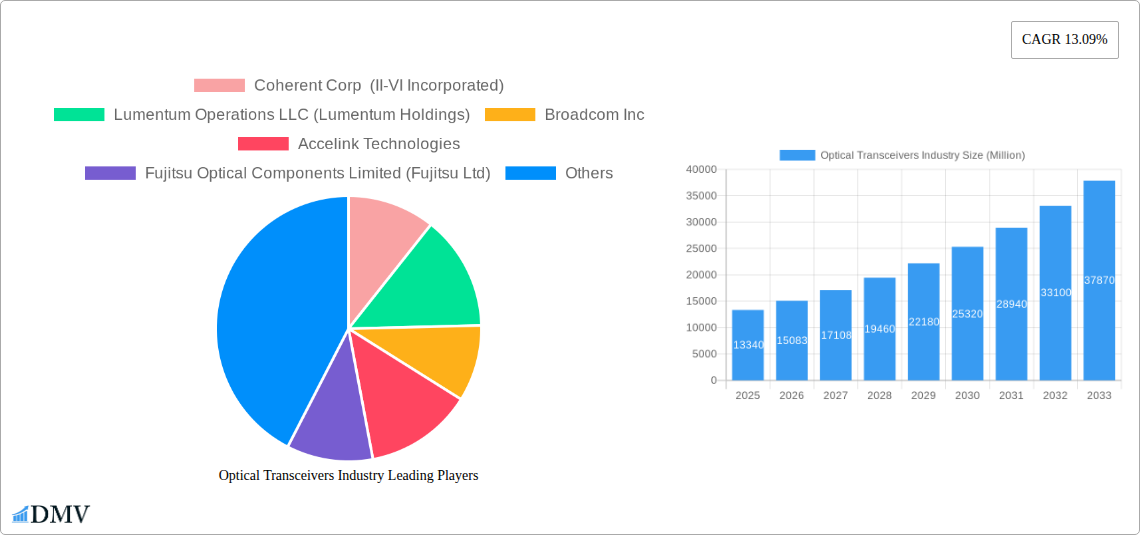
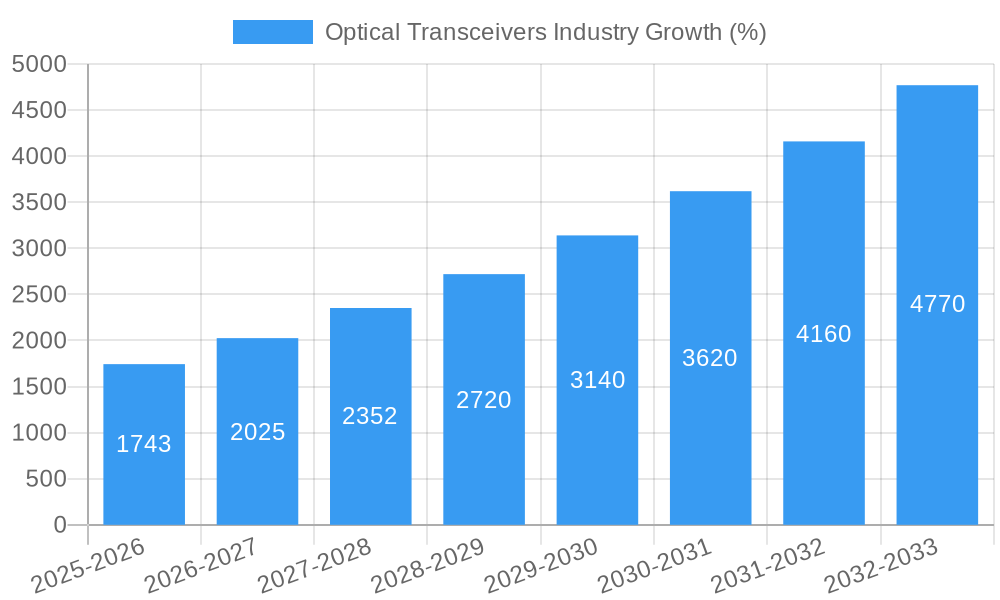
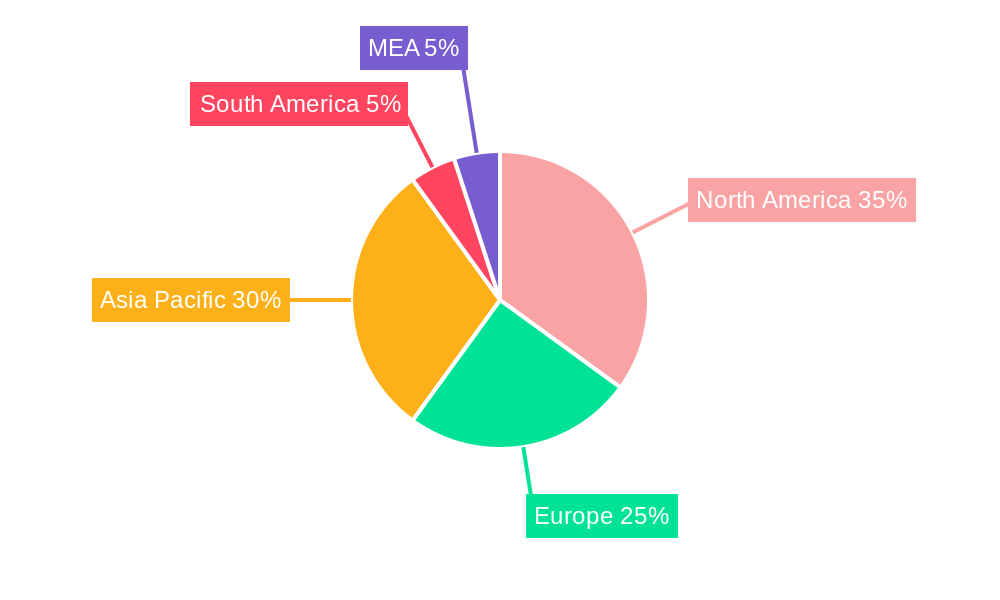
The optical transceivers market, valued at $13.34 billion in 2025, is projected to experience robust growth, driven by the escalating demand for high-speed data transmission in data centers and telecommunications. A compound annual growth rate (CAGR) of 13.09% from 2025 to 2033 indicates a significant market expansion. This growth is fueled by several key factors. The proliferation of cloud computing and the increasing adoption of 5G and beyond networks are major drivers, necessitating faster and more efficient data transfer solutions. Furthermore, the continuous advancement in data rates, from 10 Gbps to 100 Gbps and beyond, is pushing the demand for higher-capacity optical transceivers. The market segmentation reveals strong growth across various protocols (Ethernet, Fiber Channel, CWDM/DWDM, FTTX), data rates (particularly 100 Gbps and above), and applications (data centers leading the charge). Geographical analysis suggests North America and Asia Pacific, specifically China, will continue to be key regions for market expansion, due to high technology adoption and significant investments in infrastructure development.
However, market growth may face some challenges. Cost constraints associated with advanced technologies like 400G and 800G transceivers could limit wider adoption in certain segments. Furthermore, the market’s dependence on the performance of the telecommunications and data center sectors introduces inherent vulnerability to economic downturns. Nevertheless, the overall growth trajectory remains positive, driven by the insatiable need for increased bandwidth and data processing capabilities in an increasingly interconnected world. Leading companies like Coherent Corp, Lumentum, and Broadcom are strategically positioned to capitalize on this market expansion through innovation and strategic partnerships. The forecast period (2025-2033) promises substantial opportunities for market players to innovate, expand their product portfolios, and establish strong market presence.
Optical Transceivers Industry: A Comprehensive Market Report (2019-2033)
This insightful report provides a detailed analysis of the Optical Transceivers industry, encompassing market size, growth trends, technological advancements, and key players. With a study period spanning 2019-2033, a base year of 2025, and a forecast period of 2025-2033, this report offers valuable insights for stakeholders seeking to navigate this dynamic market. The global optical transceivers market is projected to reach xx Million by 2033, demonstrating significant growth potential.
Optical Transceivers Industry Market Composition & Trends
The optical transceiver market is characterized by a moderately concentrated landscape, with key players like Coherent Corp (II-VI Incorporated), Lumentum Holdings, Broadcom Inc., and others holding significant market share. Innovation is a primary driver, with continuous advancements in data rates and protocols shaping market dynamics. Stringent regulatory standards, particularly concerning data security and network reliability, influence industry practices. Substitute products, while limited, pose some competitive pressure, mainly from alternative short-range connectivity solutions. End-users primarily include data centers, telecommunication companies, and enterprise networks. M&A activity has been moderate, with deal values ranging from xx Million to xx Million in recent years, reflecting strategic consolidation efforts within the industry.
- Market Share Distribution (2024): Broadcom Inc. (xx%), Coherent Corp (II-VI Incorporated) (xx%), Lumentum Holdings (xx%), Others (xx%). (Note: Exact figures unavailable, estimations provided).
- Recent M&A Activity: While specific deal values are confidential, several acquisitions have occurred, primarily focused on strengthening technological capabilities and expanding market reach.
Optical Transceivers Industry Evolution
The optical transceiver market has experienced substantial growth, driven by the escalating demand for high-bandwidth connectivity across various sectors. From 2019 to 2024, the market witnessed a Compound Annual Growth Rate (CAGR) of xx%, primarily fueled by the proliferation of cloud computing, 5G deployments, and the increasing adoption of high-speed data networks. Technological advancements, particularly in silicon photonics and coherent optical transmission, have enabled higher data rates and improved efficiency. Consumer demand shifts toward higher bandwidth capabilities and reduced latency, pushing the industry towards the development of 400G, 800G, and beyond. This demand is further fueled by the rise of AI/ML applications, necessitating high-speed interconnects. Market growth is projected to continue at a CAGR of xx% during the forecast period (2025-2033), reaching xx Million by 2033. The adoption rate of 100G and 400G transceivers has rapidly increased, while the market for higher data rates (800G and beyond) is experiencing significant growth.
Leading Regions, Countries, or Segments in Optical Transceivers Industry
The Data Center segment dominates the application landscape, owing to the exponential growth of cloud computing and hyperscale data centers. Within protocols, Ethernet holds the largest market share due to its widespread adoption in data center and enterprise networks. Regarding data rates, the 100Gbps segment currently leads, but the greater than 100Gbps segment is experiencing the fastest growth, reflecting industry trends toward higher bandwidth demands. North America and Asia-Pacific regions are leading in market share, driven by high technological adoption and substantial investments in infrastructure development.
Key Drivers (Data Center Segment):
- Massive investments in data center infrastructure globally.
- Increasing demand for high-speed interconnects in cloud computing.
- Growing adoption of AI/ML applications.
Key Drivers (Ethernet Protocol):
- Ubiquitous use in enterprise and data center networking.
- Standardized protocols ensuring interoperability.
- Cost-effectiveness compared to other protocols.
Optical Transceivers Industry Product Innovations
Recent innovations focus on increasing data rates, improving power efficiency, and reducing costs. The introduction of 800G and 1.6T transceivers signifies a significant leap forward. These advancements leverage technologies like coherent detection and advanced modulation formats (e.g., PAM4) to achieve higher data transmission capacities within existing fiber optic infrastructures. Unique selling propositions often include lower power consumption, smaller form factors, and improved signal integrity.
Propelling Factors for Optical Transceivers Industry Growth
The optical transceiver market's growth is driven by several factors: the exponential growth of data centers fueled by cloud computing, the rapid expansion of 5G networks demanding high-bandwidth connectivity, and the increasing adoption of AI/ML, which require high-speed data processing and transmission. Government initiatives to improve digital infrastructure further boost this growth. Technological advancements, particularly in coherent optical transmission, enable higher data rates and improve efficiency, further driving market expansion.
Obstacles in the Optical Transceivers Industry Market
Challenges include maintaining cost-effectiveness while increasing data rates, managing supply chain complexities due to the specialized components involved, and navigating the competitive landscape dominated by established players. Regulatory hurdles and compliance requirements also pose significant challenges, especially with international data transmission. Supply chain disruptions can lead to increased production costs and delivery delays, impacting profitability.
Future Opportunities in Optical Transceivers Industry
Future opportunities lie in the development of higher data rate transceivers (beyond 800G), advancements in silicon photonics for cost reduction and integration, and expanding into new markets like autonomous vehicles and the Internet of Things (IoT). The growth of edge computing also presents significant opportunities for optical transceivers enabling high bandwidth connectivity at the network edge.
Major Players in the Optical Transceivers Industry Ecosystem
- Coherent Corp (II-VI Incorporated)
- Lumentum Operations LLC (Lumentum Holdings)
- Broadcom Inc
- Accelink Technologies
- Fujitsu Optical Components Limited (Fujitsu Ltd)
- Huawei Technologies Co Ltd
- Source Photonics (Redview Capital)
- HUBER+SUHNER Cube Optics
- Smiths Interconnect (Reflex Photonics Inc)
- Sumitomo Electric Industries Ltd
Key Developments in Optical Transceivers Industry Industry
- October 2023: Broadcom and Semtech Corporation demonstrated a 200 G/lane optical transceiver at ECOC 2023, featuring Semtech’s Fiberdge 200 G PAM4 PMDs and Broadcom’s DSP PHY and single-mode optics. This signifies a significant advancement in high-speed optical communication.
- October 2023: II-VI Incorporated demonstrated next-generation transceivers and laser technology for 800 G and 1.6T datacom transmission at ECOC 2023. These advancements are crucial for supporting the rapid growth of cloud computing driven by AI/ML and are designed for use in 25T and 50T Ethernet switches.
Strategic Optical Transceivers Industry Market Forecast
The optical transceiver market is poised for robust growth, driven by continuous technological advancements, increasing bandwidth demands across various sectors, and the ongoing expansion of global digital infrastructure. The emergence of new applications and the adoption of higher data rate transceivers will be key catalysts for future market expansion. The market is expected to see significant growth in the forecast period, primarily driven by the data center segment and the increasing adoption of 800G and higher data rate technologies.
Optical Transceivers Industry Segmentation
-
1. Protocol
- 1.1. Ethernet
- 1.2. Fiber Channel
- 1.3. CWDM/DWDM
- 1.4. FTTX
- 1.5. Other Protocols
-
2. Data Rate
- 2.1. Less than 10 Gbps
- 2.2. 10 Gbps to 40 Gbps
- 2.3. 100 Gbps
- 2.4. Greater than 100 Gbps
-
3. Application
- 3.1. Data Center
- 3.2. Telecommunication
Optical Transceivers Industry Segmentation By Geography
- 1. North America
- 2. Europe
- 3. Asia
- 4. Australia and New Zealand
- 5. Latin America
- 6. Middle East and Africa
Optical Transceivers Industry REPORT HIGHLIGHTS
| Aspects | Details |
|---|---|
| Study Period | 2019-2033 |
| Base Year | 2024 |
| Estimated Year | 2025 |
| Forecast Period | 2025-2033 |
| Historical Period | 2019-2024 |
| Growth Rate | CAGR of 13.09% from 2019-2033 |
| Segmentation |
|
Table of Contents
- 1. Introduction
- 1.1. Research Scope
- 1.2. Market Segmentation
- 1.3. Research Methodology
- 1.4. Definitions and Assumptions
- 2. Executive Summary
- 2.1. Introduction
- 3. Market Dynamics
- 3.1. Introduction
- 3.2. Market Drivers
- 3.2.1. Increasing Need for Advanced Communication; Increasing Demand for Cloud-based Services
- 3.3. Market Restrains
- 3.3.1. Increase in Network Complexity
- 3.4. Market Trends
- 3.4.1. Data Centers to the Fastest Growing Application for Optical Transceivers
- 4. Market Factor Analysis
- 4.1. Porters Five Forces
- 4.2. Supply/Value Chain
- 4.3. PESTEL analysis
- 4.4. Market Entropy
- 4.5. Patent/Trademark Analysis
- 5. Global Optical Transceivers Industry Analysis, Insights and Forecast, 2019-2031
- 5.1. Market Analysis, Insights and Forecast - by Protocol
- 5.1.1. Ethernet
- 5.1.2. Fiber Channel
- 5.1.3. CWDM/DWDM
- 5.1.4. FTTX
- 5.1.5. Other Protocols
- 5.2. Market Analysis, Insights and Forecast - by Data Rate
- 5.2.1. Less than 10 Gbps
- 5.2.2. 10 Gbps to 40 Gbps
- 5.2.3. 100 Gbps
- 5.2.4. Greater than 100 Gbps
- 5.3. Market Analysis, Insights and Forecast - by Application
- 5.3.1. Data Center
- 5.3.2. Telecommunication
- 5.4. Market Analysis, Insights and Forecast - by Region
- 5.4.1. North America
- 5.4.2. Europe
- 5.4.3. Asia
- 5.4.4. Australia and New Zealand
- 5.4.5. Latin America
- 5.4.6. Middle East and Africa
- 5.1. Market Analysis, Insights and Forecast - by Protocol
- 6. North America Optical Transceivers Industry Analysis, Insights and Forecast, 2019-2031
- 6.1. Market Analysis, Insights and Forecast - by Protocol
- 6.1.1. Ethernet
- 6.1.2. Fiber Channel
- 6.1.3. CWDM/DWDM
- 6.1.4. FTTX
- 6.1.5. Other Protocols
- 6.2. Market Analysis, Insights and Forecast - by Data Rate
- 6.2.1. Less than 10 Gbps
- 6.2.2. 10 Gbps to 40 Gbps
- 6.2.3. 100 Gbps
- 6.2.4. Greater than 100 Gbps
- 6.3. Market Analysis, Insights and Forecast - by Application
- 6.3.1. Data Center
- 6.3.2. Telecommunication
- 6.1. Market Analysis, Insights and Forecast - by Protocol
- 7. Europe Optical Transceivers Industry Analysis, Insights and Forecast, 2019-2031
- 7.1. Market Analysis, Insights and Forecast - by Protocol
- 7.1.1. Ethernet
- 7.1.2. Fiber Channel
- 7.1.3. CWDM/DWDM
- 7.1.4. FTTX
- 7.1.5. Other Protocols
- 7.2. Market Analysis, Insights and Forecast - by Data Rate
- 7.2.1. Less than 10 Gbps
- 7.2.2. 10 Gbps to 40 Gbps
- 7.2.3. 100 Gbps
- 7.2.4. Greater than 100 Gbps
- 7.3. Market Analysis, Insights and Forecast - by Application
- 7.3.1. Data Center
- 7.3.2. Telecommunication
- 7.1. Market Analysis, Insights and Forecast - by Protocol
- 8. Asia Optical Transceivers Industry Analysis, Insights and Forecast, 2019-2031
- 8.1. Market Analysis, Insights and Forecast - by Protocol
- 8.1.1. Ethernet
- 8.1.2. Fiber Channel
- 8.1.3. CWDM/DWDM
- 8.1.4. FTTX
- 8.1.5. Other Protocols
- 8.2. Market Analysis, Insights and Forecast - by Data Rate
- 8.2.1. Less than 10 Gbps
- 8.2.2. 10 Gbps to 40 Gbps
- 8.2.3. 100 Gbps
- 8.2.4. Greater than 100 Gbps
- 8.3. Market Analysis, Insights and Forecast - by Application
- 8.3.1. Data Center
- 8.3.2. Telecommunication
- 8.1. Market Analysis, Insights and Forecast - by Protocol
- 9. Australia and New Zealand Optical Transceivers Industry Analysis, Insights and Forecast, 2019-2031
- 9.1. Market Analysis, Insights and Forecast - by Protocol
- 9.1.1. Ethernet
- 9.1.2. Fiber Channel
- 9.1.3. CWDM/DWDM
- 9.1.4. FTTX
- 9.1.5. Other Protocols
- 9.2. Market Analysis, Insights and Forecast - by Data Rate
- 9.2.1. Less than 10 Gbps
- 9.2.2. 10 Gbps to 40 Gbps
- 9.2.3. 100 Gbps
- 9.2.4. Greater than 100 Gbps
- 9.3. Market Analysis, Insights and Forecast - by Application
- 9.3.1. Data Center
- 9.3.2. Telecommunication
- 9.1. Market Analysis, Insights and Forecast - by Protocol
- 10. Latin America Optical Transceivers Industry Analysis, Insights and Forecast, 2019-2031
- 10.1. Market Analysis, Insights and Forecast - by Protocol
- 10.1.1. Ethernet
- 10.1.2. Fiber Channel
- 10.1.3. CWDM/DWDM
- 10.1.4. FTTX
- 10.1.5. Other Protocols
- 10.2. Market Analysis, Insights and Forecast - by Data Rate
- 10.2.1. Less than 10 Gbps
- 10.2.2. 10 Gbps to 40 Gbps
- 10.2.3. 100 Gbps
- 10.2.4. Greater than 100 Gbps
- 10.3. Market Analysis, Insights and Forecast - by Application
- 10.3.1. Data Center
- 10.3.2. Telecommunication
- 10.1. Market Analysis, Insights and Forecast - by Protocol
- 11. Middle East and Africa Optical Transceivers Industry Analysis, Insights and Forecast, 2019-2031
- 11.1. Market Analysis, Insights and Forecast - by Protocol
- 11.1.1. Ethernet
- 11.1.2. Fiber Channel
- 11.1.3. CWDM/DWDM
- 11.1.4. FTTX
- 11.1.5. Other Protocols
- 11.2. Market Analysis, Insights and Forecast - by Data Rate
- 11.2.1. Less than 10 Gbps
- 11.2.2. 10 Gbps to 40 Gbps
- 11.2.3. 100 Gbps
- 11.2.4. Greater than 100 Gbps
- 11.3. Market Analysis, Insights and Forecast - by Application
- 11.3.1. Data Center
- 11.3.2. Telecommunication
- 11.1. Market Analysis, Insights and Forecast - by Protocol
- 12. North America Optical Transceivers Industry Analysis, Insights and Forecast, 2019-2031
- 12.1. Market Analysis, Insights and Forecast - By Country/Sub-region
- 12.1.1 United States
- 12.1.2 Canada
- 12.1.3 Mexico
- 13. Europe Optical Transceivers Industry Analysis, Insights and Forecast, 2019-2031
- 13.1. Market Analysis, Insights and Forecast - By Country/Sub-region
- 13.1.1 Germany
- 13.1.2 United Kingdom
- 13.1.3 France
- 13.1.4 Spain
- 13.1.5 Italy
- 13.1.6 Spain
- 13.1.7 Belgium
- 13.1.8 Netherland
- 13.1.9 Nordics
- 13.1.10 Rest of Europe
- 14. Asia Pacific Optical Transceivers Industry Analysis, Insights and Forecast, 2019-2031
- 14.1. Market Analysis, Insights and Forecast - By Country/Sub-region
- 14.1.1 China
- 14.1.2 Japan
- 14.1.3 India
- 14.1.4 South Korea
- 14.1.5 Southeast Asia
- 14.1.6 Australia
- 14.1.7 Indonesia
- 14.1.8 Phillipes
- 14.1.9 Singapore
- 14.1.10 Thailandc
- 14.1.11 Rest of Asia Pacific
- 15. South America Optical Transceivers Industry Analysis, Insights and Forecast, 2019-2031
- 15.1. Market Analysis, Insights and Forecast - By Country/Sub-region
- 15.1.1 Brazil
- 15.1.2 Argentina
- 15.1.3 Peru
- 15.1.4 Chile
- 15.1.5 Colombia
- 15.1.6 Ecuador
- 15.1.7 Venezuela
- 15.1.8 Rest of South America
- 16. North America Optical Transceivers Industry Analysis, Insights and Forecast, 2019-2031
- 16.1. Market Analysis, Insights and Forecast - By Country/Sub-region
- 16.1.1 United States
- 16.1.2 Canada
- 16.1.3 Mexico
- 17. MEA Optical Transceivers Industry Analysis, Insights and Forecast, 2019-2031
- 17.1. Market Analysis, Insights and Forecast - By Country/Sub-region
- 17.1.1 United Arab Emirates
- 17.1.2 Saudi Arabia
- 17.1.3 South Africa
- 17.1.4 Rest of Middle East and Africa
- 18. Competitive Analysis
- 18.1. Global Market Share Analysis 2024
- 18.2. Company Profiles
- 18.2.1 Coherent Corp (II-VI Incorporated)
- 18.2.1.1. Overview
- 18.2.1.2. Products
- 18.2.1.3. SWOT Analysis
- 18.2.1.4. Recent Developments
- 18.2.1.5. Financials (Based on Availability)
- 18.2.2 Lumentum Operations LLC (Lumentum Holdings)
- 18.2.2.1. Overview
- 18.2.2.2. Products
- 18.2.2.3. SWOT Analysis
- 18.2.2.4. Recent Developments
- 18.2.2.5. Financials (Based on Availability)
- 18.2.3 Broadcom Inc
- 18.2.3.1. Overview
- 18.2.3.2. Products
- 18.2.3.3. SWOT Analysis
- 18.2.3.4. Recent Developments
- 18.2.3.5. Financials (Based on Availability)
- 18.2.4 Accelink Technologies
- 18.2.4.1. Overview
- 18.2.4.2. Products
- 18.2.4.3. SWOT Analysis
- 18.2.4.4. Recent Developments
- 18.2.4.5. Financials (Based on Availability)
- 18.2.5 Fujitsu Optical Components Limited (Fujitsu Ltd)
- 18.2.5.1. Overview
- 18.2.5.2. Products
- 18.2.5.3. SWOT Analysis
- 18.2.5.4. Recent Developments
- 18.2.5.5. Financials (Based on Availability)
- 18.2.6 Huawei Technologies Co Ltd
- 18.2.6.1. Overview
- 18.2.6.2. Products
- 18.2.6.3. SWOT Analysis
- 18.2.6.4. Recent Developments
- 18.2.6.5. Financials (Based on Availability)
- 18.2.7 Source Photonics (Redview Capital)
- 18.2.7.1. Overview
- 18.2.7.2. Products
- 18.2.7.3. SWOT Analysis
- 18.2.7.4. Recent Developments
- 18.2.7.5. Financials (Based on Availability)
- 18.2.8 HUBER+SUHNER Cube Optics
- 18.2.8.1. Overview
- 18.2.8.2. Products
- 18.2.8.3. SWOT Analysis
- 18.2.8.4. Recent Developments
- 18.2.8.5. Financials (Based on Availability)
- 18.2.9 Smiths Interconnect (Reflex Photonics Inc )
- 18.2.9.1. Overview
- 18.2.9.2. Products
- 18.2.9.3. SWOT Analysis
- 18.2.9.4. Recent Developments
- 18.2.9.5. Financials (Based on Availability)
- 18.2.10 Sumitomo Electric Industries Ltd
- 18.2.10.1. Overview
- 18.2.10.2. Products
- 18.2.10.3. SWOT Analysis
- 18.2.10.4. Recent Developments
- 18.2.10.5. Financials (Based on Availability)
- 18.2.1 Coherent Corp (II-VI Incorporated)
List of Figures
- Figure 1: Global Optical Transceivers Industry Revenue Breakdown (Million, %) by Region 2024 & 2032
- Figure 2: North America Optical Transceivers Industry Revenue (Million), by Country 2024 & 2032
- Figure 3: North America Optical Transceivers Industry Revenue Share (%), by Country 2024 & 2032
- Figure 4: Europe Optical Transceivers Industry Revenue (Million), by Country 2024 & 2032
- Figure 5: Europe Optical Transceivers Industry Revenue Share (%), by Country 2024 & 2032
- Figure 6: Asia Pacific Optical Transceivers Industry Revenue (Million), by Country 2024 & 2032
- Figure 7: Asia Pacific Optical Transceivers Industry Revenue Share (%), by Country 2024 & 2032
- Figure 8: South America Optical Transceivers Industry Revenue (Million), by Country 2024 & 2032
- Figure 9: South America Optical Transceivers Industry Revenue Share (%), by Country 2024 & 2032
- Figure 10: North America Optical Transceivers Industry Revenue (Million), by Country 2024 & 2032
- Figure 11: North America Optical Transceivers Industry Revenue Share (%), by Country 2024 & 2032
- Figure 12: MEA Optical Transceivers Industry Revenue (Million), by Country 2024 & 2032
- Figure 13: MEA Optical Transceivers Industry Revenue Share (%), by Country 2024 & 2032
- Figure 14: North America Optical Transceivers Industry Revenue (Million), by Protocol 2024 & 2032
- Figure 15: North America Optical Transceivers Industry Revenue Share (%), by Protocol 2024 & 2032
- Figure 16: North America Optical Transceivers Industry Revenue (Million), by Data Rate 2024 & 2032
- Figure 17: North America Optical Transceivers Industry Revenue Share (%), by Data Rate 2024 & 2032
- Figure 18: North America Optical Transceivers Industry Revenue (Million), by Application 2024 & 2032
- Figure 19: North America Optical Transceivers Industry Revenue Share (%), by Application 2024 & 2032
- Figure 20: North America Optical Transceivers Industry Revenue (Million), by Country 2024 & 2032
- Figure 21: North America Optical Transceivers Industry Revenue Share (%), by Country 2024 & 2032
- Figure 22: Europe Optical Transceivers Industry Revenue (Million), by Protocol 2024 & 2032
- Figure 23: Europe Optical Transceivers Industry Revenue Share (%), by Protocol 2024 & 2032
- Figure 24: Europe Optical Transceivers Industry Revenue (Million), by Data Rate 2024 & 2032
- Figure 25: Europe Optical Transceivers Industry Revenue Share (%), by Data Rate 2024 & 2032
- Figure 26: Europe Optical Transceivers Industry Revenue (Million), by Application 2024 & 2032
- Figure 27: Europe Optical Transceivers Industry Revenue Share (%), by Application 2024 & 2032
- Figure 28: Europe Optical Transceivers Industry Revenue (Million), by Country 2024 & 2032
- Figure 29: Europe Optical Transceivers Industry Revenue Share (%), by Country 2024 & 2032
- Figure 30: Asia Optical Transceivers Industry Revenue (Million), by Protocol 2024 & 2032
- Figure 31: Asia Optical Transceivers Industry Revenue Share (%), by Protocol 2024 & 2032
- Figure 32: Asia Optical Transceivers Industry Revenue (Million), by Data Rate 2024 & 2032
- Figure 33: Asia Optical Transceivers Industry Revenue Share (%), by Data Rate 2024 & 2032
- Figure 34: Asia Optical Transceivers Industry Revenue (Million), by Application 2024 & 2032
- Figure 35: Asia Optical Transceivers Industry Revenue Share (%), by Application 2024 & 2032
- Figure 36: Asia Optical Transceivers Industry Revenue (Million), by Country 2024 & 2032
- Figure 37: Asia Optical Transceivers Industry Revenue Share (%), by Country 2024 & 2032
- Figure 38: Australia and New Zealand Optical Transceivers Industry Revenue (Million), by Protocol 2024 & 2032
- Figure 39: Australia and New Zealand Optical Transceivers Industry Revenue Share (%), by Protocol 2024 & 2032
- Figure 40: Australia and New Zealand Optical Transceivers Industry Revenue (Million), by Data Rate 2024 & 2032
- Figure 41: Australia and New Zealand Optical Transceivers Industry Revenue Share (%), by Data Rate 2024 & 2032
- Figure 42: Australia and New Zealand Optical Transceivers Industry Revenue (Million), by Application 2024 & 2032
- Figure 43: Australia and New Zealand Optical Transceivers Industry Revenue Share (%), by Application 2024 & 2032
- Figure 44: Australia and New Zealand Optical Transceivers Industry Revenue (Million), by Country 2024 & 2032
- Figure 45: Australia and New Zealand Optical Transceivers Industry Revenue Share (%), by Country 2024 & 2032
- Figure 46: Latin America Optical Transceivers Industry Revenue (Million), by Protocol 2024 & 2032
- Figure 47: Latin America Optical Transceivers Industry Revenue Share (%), by Protocol 2024 & 2032
- Figure 48: Latin America Optical Transceivers Industry Revenue (Million), by Data Rate 2024 & 2032
- Figure 49: Latin America Optical Transceivers Industry Revenue Share (%), by Data Rate 2024 & 2032
- Figure 50: Latin America Optical Transceivers Industry Revenue (Million), by Application 2024 & 2032
- Figure 51: Latin America Optical Transceivers Industry Revenue Share (%), by Application 2024 & 2032
- Figure 52: Latin America Optical Transceivers Industry Revenue (Million), by Country 2024 & 2032
- Figure 53: Latin America Optical Transceivers Industry Revenue Share (%), by Country 2024 & 2032
- Figure 54: Middle East and Africa Optical Transceivers Industry Revenue (Million), by Protocol 2024 & 2032
- Figure 55: Middle East and Africa Optical Transceivers Industry Revenue Share (%), by Protocol 2024 & 2032
- Figure 56: Middle East and Africa Optical Transceivers Industry Revenue (Million), by Data Rate 2024 & 2032
- Figure 57: Middle East and Africa Optical Transceivers Industry Revenue Share (%), by Data Rate 2024 & 2032
- Figure 58: Middle East and Africa Optical Transceivers Industry Revenue (Million), by Application 2024 & 2032
- Figure 59: Middle East and Africa Optical Transceivers Industry Revenue Share (%), by Application 2024 & 2032
- Figure 60: Middle East and Africa Optical Transceivers Industry Revenue (Million), by Country 2024 & 2032
- Figure 61: Middle East and Africa Optical Transceivers Industry Revenue Share (%), by Country 2024 & 2032
List of Tables
- Table 1: Global Optical Transceivers Industry Revenue Million Forecast, by Region 2019 & 2032
- Table 2: Global Optical Transceivers Industry Revenue Million Forecast, by Protocol 2019 & 2032
- Table 3: Global Optical Transceivers Industry Revenue Million Forecast, by Data Rate 2019 & 2032
- Table 4: Global Optical Transceivers Industry Revenue Million Forecast, by Application 2019 & 2032
- Table 5: Global Optical Transceivers Industry Revenue Million Forecast, by Region 2019 & 2032
- Table 6: Global Optical Transceivers Industry Revenue Million Forecast, by Country 2019 & 2032
- Table 7: United States Optical Transceivers Industry Revenue (Million) Forecast, by Application 2019 & 2032
- Table 8: Canada Optical Transceivers Industry Revenue (Million) Forecast, by Application 2019 & 2032
- Table 9: Mexico Optical Transceivers Industry Revenue (Million) Forecast, by Application 2019 & 2032
- Table 10: Global Optical Transceivers Industry Revenue Million Forecast, by Country 2019 & 2032
- Table 11: Germany Optical Transceivers Industry Revenue (Million) Forecast, by Application 2019 & 2032
- Table 12: United Kingdom Optical Transceivers Industry Revenue (Million) Forecast, by Application 2019 & 2032
- Table 13: France Optical Transceivers Industry Revenue (Million) Forecast, by Application 2019 & 2032
- Table 14: Spain Optical Transceivers Industry Revenue (Million) Forecast, by Application 2019 & 2032
- Table 15: Italy Optical Transceivers Industry Revenue (Million) Forecast, by Application 2019 & 2032
- Table 16: Spain Optical Transceivers Industry Revenue (Million) Forecast, by Application 2019 & 2032
- Table 17: Belgium Optical Transceivers Industry Revenue (Million) Forecast, by Application 2019 & 2032
- Table 18: Netherland Optical Transceivers Industry Revenue (Million) Forecast, by Application 2019 & 2032
- Table 19: Nordics Optical Transceivers Industry Revenue (Million) Forecast, by Application 2019 & 2032
- Table 20: Rest of Europe Optical Transceivers Industry Revenue (Million) Forecast, by Application 2019 & 2032
- Table 21: Global Optical Transceivers Industry Revenue Million Forecast, by Country 2019 & 2032
- Table 22: China Optical Transceivers Industry Revenue (Million) Forecast, by Application 2019 & 2032
- Table 23: Japan Optical Transceivers Industry Revenue (Million) Forecast, by Application 2019 & 2032
- Table 24: India Optical Transceivers Industry Revenue (Million) Forecast, by Application 2019 & 2032
- Table 25: South Korea Optical Transceivers Industry Revenue (Million) Forecast, by Application 2019 & 2032
- Table 26: Southeast Asia Optical Transceivers Industry Revenue (Million) Forecast, by Application 2019 & 2032
- Table 27: Australia Optical Transceivers Industry Revenue (Million) Forecast, by Application 2019 & 2032
- Table 28: Indonesia Optical Transceivers Industry Revenue (Million) Forecast, by Application 2019 & 2032
- Table 29: Phillipes Optical Transceivers Industry Revenue (Million) Forecast, by Application 2019 & 2032
- Table 30: Singapore Optical Transceivers Industry Revenue (Million) Forecast, by Application 2019 & 2032
- Table 31: Thailandc Optical Transceivers Industry Revenue (Million) Forecast, by Application 2019 & 2032
- Table 32: Rest of Asia Pacific Optical Transceivers Industry Revenue (Million) Forecast, by Application 2019 & 2032
- Table 33: Global Optical Transceivers Industry Revenue Million Forecast, by Country 2019 & 2032
- Table 34: Brazil Optical Transceivers Industry Revenue (Million) Forecast, by Application 2019 & 2032
- Table 35: Argentina Optical Transceivers Industry Revenue (Million) Forecast, by Application 2019 & 2032
- Table 36: Peru Optical Transceivers Industry Revenue (Million) Forecast, by Application 2019 & 2032
- Table 37: Chile Optical Transceivers Industry Revenue (Million) Forecast, by Application 2019 & 2032
- Table 38: Colombia Optical Transceivers Industry Revenue (Million) Forecast, by Application 2019 & 2032
- Table 39: Ecuador Optical Transceivers Industry Revenue (Million) Forecast, by Application 2019 & 2032
- Table 40: Venezuela Optical Transceivers Industry Revenue (Million) Forecast, by Application 2019 & 2032
- Table 41: Rest of South America Optical Transceivers Industry Revenue (Million) Forecast, by Application 2019 & 2032
- Table 42: Global Optical Transceivers Industry Revenue Million Forecast, by Country 2019 & 2032
- Table 43: United States Optical Transceivers Industry Revenue (Million) Forecast, by Application 2019 & 2032
- Table 44: Canada Optical Transceivers Industry Revenue (Million) Forecast, by Application 2019 & 2032
- Table 45: Mexico Optical Transceivers Industry Revenue (Million) Forecast, by Application 2019 & 2032
- Table 46: Global Optical Transceivers Industry Revenue Million Forecast, by Country 2019 & 2032
- Table 47: United Arab Emirates Optical Transceivers Industry Revenue (Million) Forecast, by Application 2019 & 2032
- Table 48: Saudi Arabia Optical Transceivers Industry Revenue (Million) Forecast, by Application 2019 & 2032
- Table 49: South Africa Optical Transceivers Industry Revenue (Million) Forecast, by Application 2019 & 2032
- Table 50: Rest of Middle East and Africa Optical Transceivers Industry Revenue (Million) Forecast, by Application 2019 & 2032
- Table 51: Global Optical Transceivers Industry Revenue Million Forecast, by Protocol 2019 & 2032
- Table 52: Global Optical Transceivers Industry Revenue Million Forecast, by Data Rate 2019 & 2032
- Table 53: Global Optical Transceivers Industry Revenue Million Forecast, by Application 2019 & 2032
- Table 54: Global Optical Transceivers Industry Revenue Million Forecast, by Country 2019 & 2032
- Table 55: Global Optical Transceivers Industry Revenue Million Forecast, by Protocol 2019 & 2032
- Table 56: Global Optical Transceivers Industry Revenue Million Forecast, by Data Rate 2019 & 2032
- Table 57: Global Optical Transceivers Industry Revenue Million Forecast, by Application 2019 & 2032
- Table 58: Global Optical Transceivers Industry Revenue Million Forecast, by Country 2019 & 2032
- Table 59: Global Optical Transceivers Industry Revenue Million Forecast, by Protocol 2019 & 2032
- Table 60: Global Optical Transceivers Industry Revenue Million Forecast, by Data Rate 2019 & 2032
- Table 61: Global Optical Transceivers Industry Revenue Million Forecast, by Application 2019 & 2032
- Table 62: Global Optical Transceivers Industry Revenue Million Forecast, by Country 2019 & 2032
- Table 63: Global Optical Transceivers Industry Revenue Million Forecast, by Protocol 2019 & 2032
- Table 64: Global Optical Transceivers Industry Revenue Million Forecast, by Data Rate 2019 & 2032
- Table 65: Global Optical Transceivers Industry Revenue Million Forecast, by Application 2019 & 2032
- Table 66: Global Optical Transceivers Industry Revenue Million Forecast, by Country 2019 & 2032
- Table 67: Global Optical Transceivers Industry Revenue Million Forecast, by Protocol 2019 & 2032
- Table 68: Global Optical Transceivers Industry Revenue Million Forecast, by Data Rate 2019 & 2032
- Table 69: Global Optical Transceivers Industry Revenue Million Forecast, by Application 2019 & 2032
- Table 70: Global Optical Transceivers Industry Revenue Million Forecast, by Country 2019 & 2032
- Table 71: Global Optical Transceivers Industry Revenue Million Forecast, by Protocol 2019 & 2032
- Table 72: Global Optical Transceivers Industry Revenue Million Forecast, by Data Rate 2019 & 2032
- Table 73: Global Optical Transceivers Industry Revenue Million Forecast, by Application 2019 & 2032
- Table 74: Global Optical Transceivers Industry Revenue Million Forecast, by Country 2019 & 2032
Frequently Asked Questions
1. What is the projected Compound Annual Growth Rate (CAGR) of the Optical Transceivers Industry?
The projected CAGR is approximately 13.09%.
2. Which companies are prominent players in the Optical Transceivers Industry?
Key companies in the market include Coherent Corp (II-VI Incorporated), Lumentum Operations LLC (Lumentum Holdings), Broadcom Inc, Accelink Technologies, Fujitsu Optical Components Limited (Fujitsu Ltd), Huawei Technologies Co Ltd, Source Photonics (Redview Capital), HUBER+SUHNER Cube Optics, Smiths Interconnect (Reflex Photonics Inc ), Sumitomo Electric Industries Ltd.
3. What are the main segments of the Optical Transceivers Industry?
The market segments include Protocol, Data Rate, Application.
4. Can you provide details about the market size?
The market size is estimated to be USD 13.34 Million as of 2022.
5. What are some drivers contributing to market growth?
Increasing Need for Advanced Communication; Increasing Demand for Cloud-based Services.
6. What are the notable trends driving market growth?
Data Centers to the Fastest Growing Application for Optical Transceivers.
7. Are there any restraints impacting market growth?
Increase in Network Complexity.
8. Can you provide examples of recent developments in the market?
October 2023: Broadcom and Semtech Corporation announced the demonstration of a 200 G/lane optical transceiver at the ECOC 2023, featuring Semtech’s latest Fiberdge 200 G PAM4 PMDs and Broadcom’s latest generation DSP PHY and single-mode optics.
9. What pricing options are available for accessing the report?
Pricing options include single-user, multi-user, and enterprise licenses priced at USD 4750, USD 5250, and USD 8750 respectively.
10. Is the market size provided in terms of value or volume?
The market size is provided in terms of value, measured in Million.
11. Are there any specific market keywords associated with the report?
Yes, the market keyword associated with the report is "Optical Transceivers Industry," which aids in identifying and referencing the specific market segment covered.
12. How do I determine which pricing option suits my needs best?
The pricing options vary based on user requirements and access needs. Individual users may opt for single-user licenses, while businesses requiring broader access may choose multi-user or enterprise licenses for cost-effective access to the report.
13. Are there any additional resources or data provided in the Optical Transceivers Industry report?
While the report offers comprehensive insights, it's advisable to review the specific contents or supplementary materials provided to ascertain if additional resources or data are available.
14. How can I stay updated on further developments or reports in the Optical Transceivers Industry?
To stay informed about further developments, trends, and reports in the Optical Transceivers Industry, consider subscribing to industry newsletters, following relevant companies and organizations, or regularly checking reputable industry news sources and publications.
Methodology
Step 1 - Identification of Relevant Samples Size from Population Database


Step 2 - Approaches for Defining Global Market Size (Value, Volume* & Price*)

Note*: In applicable scenarios
Step 3 - Data Sources
Primary Research
- Web Analytics
- Survey Reports
- Research Institute
- Latest Research Reports
- Opinion Leaders
Secondary Research
- Annual Reports
- White Paper
- Latest Press Release
- Industry Association
- Paid Database
- Investor Presentations

Step 4 - Data Triangulation
Involves using different sources of information in order to increase the validity of a study
These sources are likely to be stakeholders in a program - participants, other researchers, program staff, other community members, and so on.
Then we put all data in single framework & apply various statistical tools to find out the dynamic on the market.
During the analysis stage, feedback from the stakeholder groups would be compared to determine areas of agreement as well as areas of divergence
