

Key Insights
The Global Hazardous Location LED Lighting market is projected for substantial growth, anticipated to reach $9.13 billion by 2025, with a Compound Annual Growth Rate (CAGR) of 8.64% from 2025 to 2033. This expansion is driven by increasingly stringent safety regulations in high-risk industries and the inherent advantages of LED technology, including superior energy efficiency, extended lifespan, and reduced heat emission, making them ideal for volatile environments. The Oil & Gas and Petrochemical sectors are expected to maintain their dominance due to continuous investment in operations where ignition source prevention is critical. Growing demand for reliable lighting in Industrial, Power Generation, and Pharmaceutical settings, all featuring hazardous atmospheres, will also significantly contribute to market penetration. Emerging trends include smart lighting technologies with IoT integration for remote monitoring and predictive maintenance, enhancing operational safety and efficiency.
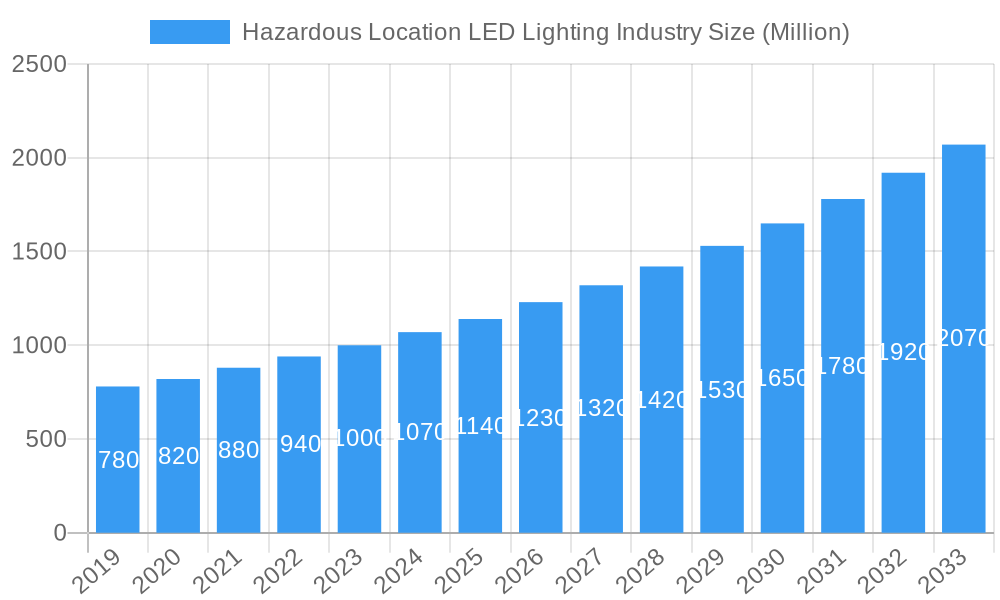
Hazardous Location LED Lighting Industry Market Size (In Billion)
Despite a promising outlook, initial higher upfront costs for specialized hazardous location LED fixtures present a challenge for some organizations. However, the long-term total cost of ownership, factoring in energy savings and reduced maintenance, offers a compelling return on investment. The market is segmented by hazardous location classes and device types, addressing diverse risk levels. Geographically, North America and Europe currently lead, driven by established industrial infrastructure and stringent safety standards. The Asia Pacific region is expected to experience the fastest growth, fueled by rapid industrialization and a burgeoning manufacturing sector adopting advanced safety protocols. Key industry players are actively innovating and expanding their product offerings to capitalize on this expanding market.
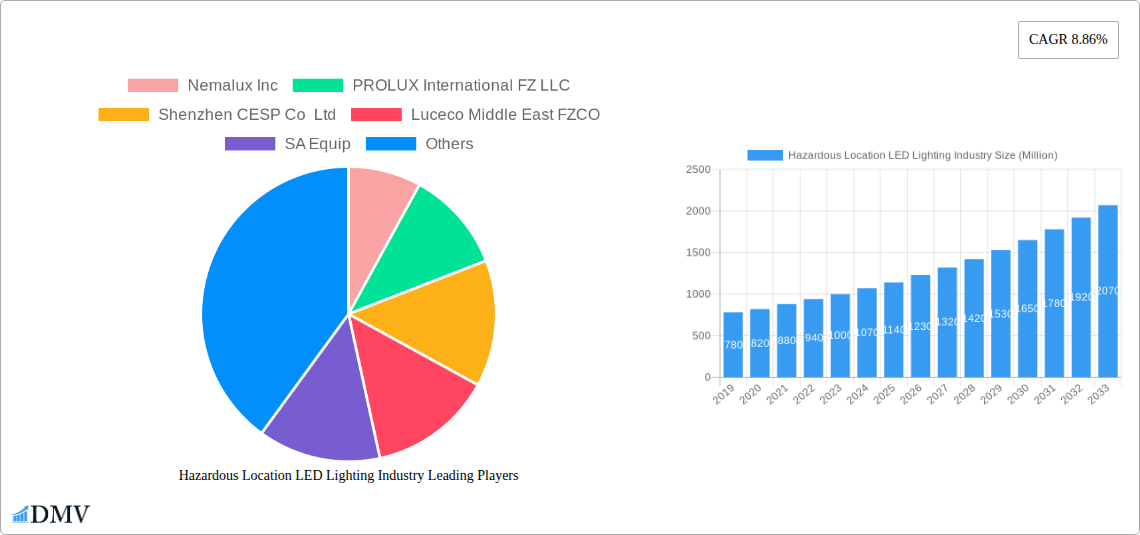
Hazardous Location LED Lighting Industry Company Market Share
Hazardous Location LED Lighting Industry Market Analysis & Forecast 2025-2033
Unlock critical insights into the burgeoning Hazardous Location LED Lighting market with this comprehensive report. Spanning the historical period of 2019–2024 and extending through a robust forecast period of 2025–2033, with 2025 as the base and estimated year, this report delivers an in-depth analysis of a vital sector. Discover market dynamics, technological advancements, regulatory impacts, and growth opportunities crucial for stakeholders navigating explosion-proof lighting, ATEX-certified lights, and intrinsically safe lighting solutions. This study is indispensable for understanding market share, investment strategies, and competitive landscapes in the oil & gas, petrochemical, industrial, and power generation sectors.
Hazardous Location LED Lighting Industry Market Composition & Trends
The Hazardous Location LED Lighting market exhibits a dynamic composition driven by stringent safety regulations and increasing demand for energy-efficient, long-lasting illumination in high-risk environments. Market concentration is moderately fragmented, with several key players vying for dominance. Innovation catalysts include the continuous pursuit of enhanced safety certifications, improved lumen efficacy, and smart lighting integration for remote monitoring and control. The regulatory landscape, particularly ATEX directives in Europe and UL/CSA standards in North America, plays a pivotal role in shaping product development and market entry. Substitute products, primarily traditional incandescent and fluorescent hazardous location fixtures, are progressively being phased out due to their inefficiency and shorter lifespan. End-user profiles are diverse, with the Oil & Gas and Petrochemical industries being primary consumers, followed by Industrial, Power Generation, and Pharmaceutical sectors. Mergers and acquisitions (M&A) activities, while not extensive, are strategically aimed at consolidating market share and expanding technological capabilities. Expected M&A deal values are in the range of $50 Million to $200 Million, indicating a focus on acquiring specialized technologies or expanding geographical reach.
- Market Share Distribution: Leading companies collectively hold approximately 45% of the market share, with the top 5 players dominating approximately 25%.
- Innovation Drivers: Focus on Zone 0, Zone 1, and Zone 21 lighting solutions, extended lifespan exceeding 50,000 hours, and resistance to extreme temperatures and corrosive elements.
- Regulatory Impact: Compliance with IECEx, ATEX, UL, and CSA certifications is a non-negotiable prerequisite for market participation.
- End-User Demands: Need for reduced maintenance costs, energy savings (estimated 40-60% compared to traditional lighting), and enhanced operational safety.
- M&A Focus: Acquisition of companies with strong intellectual property in explosion-proof LED technology and established distribution networks.
Hazardous Location LED Lighting Industry Industry Evolution
The Hazardous Location LED Lighting industry has undergone a significant transformation, evolving from predominantly bulky and inefficient traditional lighting solutions to sophisticated, energy-saving, and intrinsically safer LED technologies. The historical period of 2019–2024 witnessed a steady upward trajectory in market growth, fueled by increasing industrialization, stringent safety mandates, and a growing awareness of the benefits offered by LED lighting. Growth rates during this period averaged between 6% and 8% annually, driven by the inherent advantages of LEDs, such as longer lifespan, reduced energy consumption, and lower maintenance requirements compared to their fluorescent and incandescent predecessors. The adoption of LED technology in hazardous environments has been a gradual but definitive process, propelled by the need to comply with evolving safety standards and the desire to optimize operational efficiency.
The base year of 2025 marks a pivotal point where LED luminaires have largely supplanted older technologies in new installations and significant retrofitting projects. The market is projected to continue its robust expansion through the forecast period of 2025–2033, with an anticipated Compound Annual Growth Rate (CAGR) of approximately 7.5% to 9%. This sustained growth is attributed to several key factors. Firstly, the global expansion of industries that inherently require hazardous location lighting, such as oil & gas exploration and production, petrochemical refining, chemical processing, and mining operations, continues to be a primary demand driver. As these sectors invest in new facilities and upgrade existing infrastructure, the demand for certified hazardous location lighting solutions escalates.
Technological advancements are continuously shaping the industry. Manufacturers are focusing on developing LED luminaires with even higher lumen output, improved color rendering indices (CRIs) for better visibility and safety, and enhanced thermal management systems to ensure optimal performance in extreme temperature conditions. The integration of smart technologies, including IoT connectivity, dimming capabilities, and remote monitoring through sophisticated control systems, is becoming increasingly prevalent. This allows for real-time performance tracking, predictive maintenance, and optimized energy consumption, adding significant value for end-users. For instance, the implementation of intelligent lighting systems can reduce energy expenditure by up to 20% in certain applications.
Furthermore, shifting consumer demands are playing a crucial role. End-users are no longer solely focused on meeting compliance requirements; they are actively seeking lighting solutions that offer a compelling return on investment (ROI) through reduced operational costs, enhanced safety records, and improved productivity. The long operational life of LEDs, often exceeding 50,000 hours, translates into substantial savings on bulb replacement and associated labor costs, a critical consideration in remote or difficult-to-access hazardous locations. The demand for lighting solutions designed for specific hazardous area classifications, such as Zone 0, Zone 1, Zone 2, Zone 20, Zone 21, and Zone 22, as well as various Class I, Class II, and Class III divisions, is also increasing, reflecting the nuanced safety requirements of different industrial settings. The industry's evolution is thus characterized by a synergistic interplay of regulatory pressure, technological innovation, and evolving end-user expectations, all converging to drive sustained growth and adoption of advanced hazardous location LED lighting solutions.
Leading Regions, Countries, or Segments in Hazardous Location LED Lighting Industry
The dominance in the Hazardous Location LED Lighting Industry is significantly influenced by a confluence of regulatory frameworks, industrial concentration, and investment trends. Globally, North America and Europe currently lead in market share, driven by stringent safety regulations and a high concentration of established industries requiring explosion-proof lighting. However, the Middle East and Asia-Pacific regions are exhibiting the most rapid growth, propelled by substantial investments in infrastructure development and the expansion of the oil, gas, and petrochemical sectors.
Within the classification of Device Type, the Zone 1/21 and Zone 2/22 segments are experiencing the highest demand. This is primarily due to their widespread application across a broad spectrum of industrial facilities, including refineries, chemical plants, manufacturing units, and power generation stations, which constitute a significant portion of the hazardous location market. The demand for Zone 0/20 solutions, while critical, is more niche, primarily confined to highly volatile environments with continuous presence of explosive atmospheres.
The End-User Industry segmentation clearly indicates that the Oil & Gas and Petrochemical industries are the primary powerhouses driving market demand. These sectors, by their very nature, operate under conditions that necessitate robust safety measures, including certified hazardous location lighting. The projected growth in global energy demand and continued exploration activities in challenging offshore and onshore environments will sustain this dominance. The Industrial sector, encompassing general manufacturing, chemical processing, and heavy industry, also represents a substantial market, followed by Power Generation and Pharmaceutical facilities, each with specific, albeit less extensive, requirements for explosion-proof lighting.
Key Drivers of Dominance in Leading Segments:
- Regulatory Support: Regions with well-established and rigorously enforced safety standards, such as ATEX in Europe and NEC/CEC in North America, mandate the use of certified hazardous location lighting, thereby fostering market growth. The Middle East's increasing adoption of international safety standards further bolsters demand.
- Investment Trends: Significant capital investments in the expansion and modernization of oil and gas infrastructure, particularly in the Middle East and parts of Asia, are directly translating into increased demand for hazardous location LED lighting. Billions of dollars are being injected into new refinery projects and upstream exploration activities, creating a strong demand pipeline.
- Technological Adoption: The proactive adoption of energy-efficient and advanced LED technologies by key industries in these regions ensures a preference for modern hazardous location lighting solutions. Companies are increasingly seeking luminaires with longer lifespans, lower maintenance, and smart functionalities to improve operational efficiency.
- Industrial Footprint: The sheer scale of industrial operations, especially in petrochemicals and heavy manufacturing within North America, Europe, and emerging economies in Asia, creates a continuous need for certified lighting solutions. For instance, the combined capacity of petrochemical plants in the Middle East is projected to grow by over 15% in the next five years, directly impacting lighting requirements.
- Safety Culture: A heightened safety culture and increased corporate responsibility for worker well-being are compelling companies to invest in the highest safety-rated lighting systems, thereby favoring segments with robust certifications like Zone 1 and Class I.
The market's trajectory indicates a continued strong performance for Zone 1/21 and Zone 2/22 applications within the Oil & Gas and Petrochemical sectors, with significant growth potential in the Asia-Pacific and Middle East regions due to ongoing industrial development and infrastructure upgrades.
Hazardous Location LED Lighting Industry Product Innovations
Recent product innovations in the Hazardous Location LED Lighting industry are focused on enhancing safety, energy efficiency, and operational intelligence. Manufacturers are introducing luminaires with advanced thermal management systems, ensuring reliable performance in extreme ambient temperatures ranging from -50°C to +65°C. Breakthroughs in optical design are yielding higher lumen outputs (exceeding 150 lumens per watt) and improved beam patterns, optimizing visibility and reducing energy consumption. The integration of IoT capabilities allows for real-time monitoring, remote diagnostics, and predictive maintenance, significantly reducing downtime and operational costs. Furthermore, new materials are being utilized to improve corrosion resistance and durability in harsh environments, extending product lifespans to over 100,000 hours, offering a substantial advantage over legacy lighting.
Propelling Factors for Hazardous Location LED Lighting Industry Growth
The Hazardous Location LED Lighting industry's growth is propelled by several key factors, primarily driven by the increasing global demand for enhanced safety and operational efficiency in hazardous environments.
- Stringent Safety Regulations: Growing emphasis on worker safety and environmental protection worldwide necessitates compliance with rigorous standards like ATEX, IECEx, and UL, driving the adoption of certified explosion-proof and intrinsically safe lighting.
- Energy Efficiency Mandates & Cost Savings: The inherent energy efficiency of LED technology, offering up to 70% savings compared to traditional lighting, coupled with global pushes for sustainability and reduced carbon footprints, makes LED solutions highly attractive.
- Technological Advancements in LEDs: Continuous improvements in LED efficacy, lifespan (often exceeding 50,000 hours), durability, and resistance to extreme conditions make them superior to conventional lighting options in hazardous areas.
- Growth in Key End-User Industries: Expansion in the oil & gas, petrochemical, chemical processing, and power generation sectors, particularly in emerging economies, fuels demand for reliable and safe lighting infrastructure.
Obstacles in the Hazardous Location LED Lighting Industry Market
Despite robust growth, the Hazardous Location LED Lighting Industry faces several significant obstacles that can hinder its full potential.
- High Initial Investment Costs: The specialized design and certifications required for hazardous location lighting result in higher upfront costs compared to standard industrial lighting, which can be a deterrent for some businesses.
- Complex Regulatory Compliance: Navigating the diverse and ever-evolving international safety standards and certification processes can be time-consuming and expensive for manufacturers and end-users alike, potentially delaying product adoption.
- Supply Chain Disruptions: Global supply chain vulnerabilities, including raw material availability and logistics challenges, can impact production timelines and cost-effectiveness, especially for specialized components.
- Lack of Awareness and Standardization: In some developing regions, a lack of awareness regarding the benefits of LED technology and the full scope of hazardous location regulations can slow down adoption.
Future Opportunities in Hazardous Location LED Lighting Industry
The future of the Hazardous Location LED Lighting Industry is ripe with opportunities, driven by technological innovation and expanding market needs. The increasing adoption of smart city initiatives and Industry 4.0 principles presents a significant opportunity for the integration of advanced control systems and IoT capabilities into hazardous location lighting, enabling remote monitoring, predictive maintenance, and optimized energy management. Furthermore, the growing demand for specialized lighting solutions for niche hazardous environments, such as offshore wind farms, mining operations, and food processing facilities, opens up new market segments. The development of more compact, lightweight, and easily installable luminaires for confined spaces also represents a promising area for growth.
Major Players in the Hazardous Location LED Lighting Industry Ecosystem
- Nemalux Inc
- PROLUX International FZ LLC
- Shenzhen CESP Co Ltd
- Luceco Middle East FZCO
- SA Equip
- Glamox UK
- ABB Installation Products Inc
- Azz Inc
- Worksite Lighting LLC
- Larson Electronics
- GE Current, Technology Co Ltd
- Hilclare Lighting
- Hubbell Limited
- Dialight PLC
- Emerson FZE (Emerson electric co )
- WAROM Technology MENA FZCO
- Digital Lumens Inc (OSRAM)
- Raytec Ltd
- R Stahl Limited
- Munira Lighting (AL Hatimi Trading FZE)
- DCD Technologies ME FZCO
- IKIO LED Lighting
- Eaton Corporation
Key Developments in Hazardous Location LED Lighting Industry Industry
- Jan 2020: ABB announced plans to launch its smart sensor for rotating machines operating in hazardous areas at Hannover Messe 2020. This new generation of smart sensors may provide high-quality data to enable ABB's advanced analytics to be used in hazardous locations, further extending the existing scope of applications for ABB smart sensors with a new generation design for hazardous areas.
- June 2019: Eaton announced its latest product in industrial and hazardous lighting: Crouse-Hinds series CEAG ExLin linear LEDs, certified for Zone 1 and 2 hazardous area environments. The explosion-protected LED fixture provides reliable, energy efficient lighting that can yield cost savings compared to traditional fluorescent fixtures.
Strategic Hazardous Location LED Lighting Industry Market Forecast
The strategic forecast for the Hazardous Location LED Lighting Industry over the 2025-2033 period indicates a sustained and robust growth trajectory. This expansion will be primarily fueled by the persistent global demand for enhanced safety in industrial operations, coupled with the imperative for energy efficiency. Technological advancements, particularly in smart lighting integration and material science, will continue to drive innovation, offering end-users greater control, reduced operational expenditure, and improved reliability. The expanding presence of key industries like oil & gas and petrochemicals, especially in emerging markets, will create significant opportunities for market penetration. Strategic investments in research and development, along with a focus on meeting diverse regulatory requirements across different regions, will be crucial for companies to capitalize on the projected market potential, which is estimated to reach approximately $2.5 Billion by 2033.
Hazardous Location LED Lighting Industry Segmentation
-
1. Class
- 1.1. Class I
- 1.2. Class II
- 1.3. Class III
-
2. Device Type
- 2.1. Zone 0
- 2.2. Zone 20
- 2.3. Zone 1
- 2.4. Zone 21
- 2.5. Zone 22
-
3. End-User Industry
- 3.1. Oil & Gas
- 3.2. Petrochemical
- 3.3. Industrial
- 3.4. Power Generation
- 3.5. Pharmaceutical
- 3.6. Processing
- 3.7. Other End-user Industries
Hazardous Location LED Lighting Industry Segmentation By Geography
- 1. North America
- 2. Europe
- 3. Asia Pacific
- 4. Latin America
- 5. Middle East and Africa
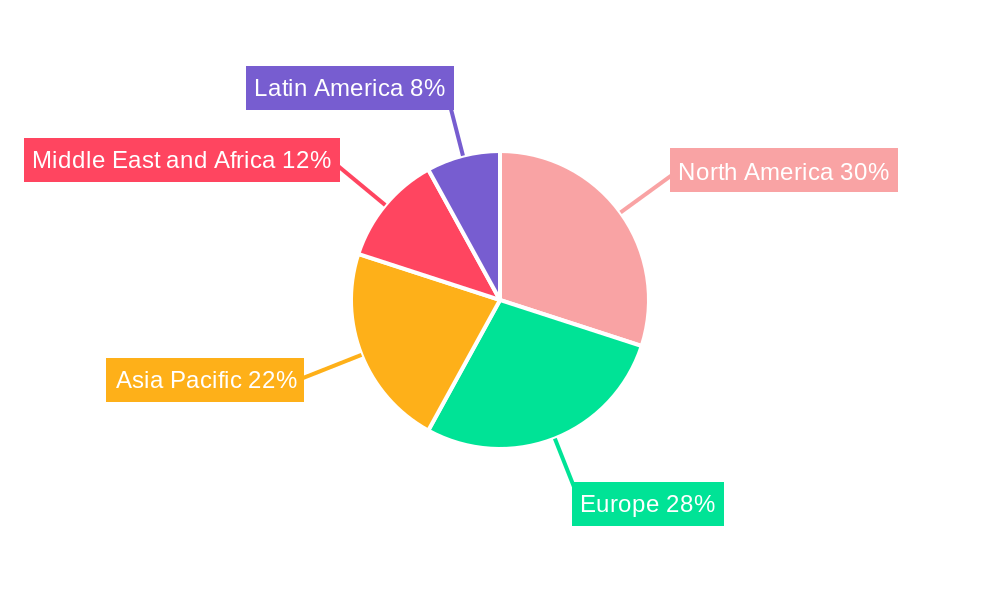
Hazardous Location LED Lighting Industry Regional Market Share
Geographic Coverage of Hazardous Location LED Lighting Industry
Hazardous Location LED Lighting Industry REPORT HIGHLIGHTS
| Aspects | Details |
|---|---|
| Study Period | 2020-2034 |
| Base Year | 2025 |
| Estimated Year | 2026 |
| Forecast Period | 2026-2034 |
| Historical Period | 2020-2025 |
| Growth Rate | CAGR of 8.64% from 2020-2034 |
| Segmentation |
|
Table of Contents
- 1. Introduction
- 1.1. Research Scope
- 1.2. Market Segmentation
- 1.3. Research Objective
- 1.4. Definitions and Assumptions
- 2. Executive Summary
- 2.1. Market Snapshot
- 3. Market Dynamics
- 3.1. Market Drivers
- 3.2. Market Restrains
- 3.3. Market Trends
- 3.4. Market Opportunities
- 4. Market Factor Analysis
- 4.1. Porters Five Forces
- 4.1.1. Bargaining Power of Suppliers
- 4.1.2. Bargaining Power of Buyers
- 4.1.3. Threat of New Entrants
- 4.1.4. Threat of Substitutes
- 4.1.5. Competitive Rivalry
- 4.2. PESTEL analysis
- 4.3. BCG Analysis
- 4.3.1. Stars (High Growth, High Market Share)
- 4.3.2. Cash Cows (Low Growth, High Market Share)
- 4.3.3. Question Mark (High Growth, Low Market Share)
- 4.3.4. Dogs (Low Growth, Low Market Share)
- 4.4. Ansoff Matrix Analysis
- 4.5. Supply Chain Analysis
- 4.6. Regulatory Landscape
- 4.7. Current Market Potential and Opportunity Assessment (TAM–SAM–SOM Framework)
- 4.8. DMV Analyst Note
- 4.1. Porters Five Forces
- 5. Market Analysis, Insights and Forecast 2021-2033
- 5.1. Market Analysis, Insights and Forecast - by Class
- 5.1.1. Class I
- 5.1.2. Class II
- 5.1.3. Class III
- 5.2. Market Analysis, Insights and Forecast - by Device Type
- 5.2.1. Zone 0
- 5.2.2. Zone 20
- 5.2.3. Zone 1
- 5.2.4. Zone 21
- 5.2.5. Zone 22
- 5.3. Market Analysis, Insights and Forecast - by End-User Industry
- 5.3.1. Oil & Gas
- 5.3.2. Petrochemical
- 5.3.3. Industrial
- 5.3.4. Power Generation
- 5.3.5. Pharmaceutical
- 5.3.6. Processing
- 5.3.7. Other End-user Industries
- 5.4. Market Analysis, Insights and Forecast - by Region
- 5.4.1. North America
- 5.4.2. Europe
- 5.4.3. Asia Pacific
- 5.4.4. Latin America
- 5.4.5. Middle East and Africa
- 5.1. Market Analysis, Insights and Forecast - by Class
- 6. Global Hazardous Location LED Lighting Industry Analysis, Insights and Forecast, 2021-2033
- 6.1. Market Analysis, Insights and Forecast - by Class
- 6.1.1. Class I
- 6.1.2. Class II
- 6.1.3. Class III
- 6.2. Market Analysis, Insights and Forecast - by Device Type
- 6.2.1. Zone 0
- 6.2.2. Zone 20
- 6.2.3. Zone 1
- 6.2.4. Zone 21
- 6.2.5. Zone 22
- 6.3. Market Analysis, Insights and Forecast - by End-User Industry
- 6.3.1. Oil & Gas
- 6.3.2. Petrochemical
- 6.3.3. Industrial
- 6.3.4. Power Generation
- 6.3.5. Pharmaceutical
- 6.3.6. Processing
- 6.3.7. Other End-user Industries
- 6.1. Market Analysis, Insights and Forecast - by Class
- 7. North America Hazardous Location LED Lighting Industry Analysis, Insights and Forecast, 2020-2032
- 7.1. Market Analysis, Insights and Forecast - by Class
- 7.1.1. Class I
- 7.1.2. Class II
- 7.1.3. Class III
- 7.2. Market Analysis, Insights and Forecast - by Device Type
- 7.2.1. Zone 0
- 7.2.2. Zone 20
- 7.2.3. Zone 1
- 7.2.4. Zone 21
- 7.2.5. Zone 22
- 7.3. Market Analysis, Insights and Forecast - by End-User Industry
- 7.3.1. Oil & Gas
- 7.3.2. Petrochemical
- 7.3.3. Industrial
- 7.3.4. Power Generation
- 7.3.5. Pharmaceutical
- 7.3.6. Processing
- 7.3.7. Other End-user Industries
- 7.1. Market Analysis, Insights and Forecast - by Class
- 8. Europe Hazardous Location LED Lighting Industry Analysis, Insights and Forecast, 2020-2032
- 8.1. Market Analysis, Insights and Forecast - by Class
- 8.1.1. Class I
- 8.1.2. Class II
- 8.1.3. Class III
- 8.2. Market Analysis, Insights and Forecast - by Device Type
- 8.2.1. Zone 0
- 8.2.2. Zone 20
- 8.2.3. Zone 1
- 8.2.4. Zone 21
- 8.2.5. Zone 22
- 8.3. Market Analysis, Insights and Forecast - by End-User Industry
- 8.3.1. Oil & Gas
- 8.3.2. Petrochemical
- 8.3.3. Industrial
- 8.3.4. Power Generation
- 8.3.5. Pharmaceutical
- 8.3.6. Processing
- 8.3.7. Other End-user Industries
- 8.1. Market Analysis, Insights and Forecast - by Class
- 9. Asia Pacific Hazardous Location LED Lighting Industry Analysis, Insights and Forecast, 2020-2032
- 9.1. Market Analysis, Insights and Forecast - by Class
- 9.1.1. Class I
- 9.1.2. Class II
- 9.1.3. Class III
- 9.2. Market Analysis, Insights and Forecast - by Device Type
- 9.2.1. Zone 0
- 9.2.2. Zone 20
- 9.2.3. Zone 1
- 9.2.4. Zone 21
- 9.2.5. Zone 22
- 9.3. Market Analysis, Insights and Forecast - by End-User Industry
- 9.3.1. Oil & Gas
- 9.3.2. Petrochemical
- 9.3.3. Industrial
- 9.3.4. Power Generation
- 9.3.5. Pharmaceutical
- 9.3.6. Processing
- 9.3.7. Other End-user Industries
- 9.1. Market Analysis, Insights and Forecast - by Class
- 10. Latin America Hazardous Location LED Lighting Industry Analysis, Insights and Forecast, 2020-2032
- 10.1. Market Analysis, Insights and Forecast - by Class
- 10.1.1. Class I
- 10.1.2. Class II
- 10.1.3. Class III
- 10.2. Market Analysis, Insights and Forecast - by Device Type
- 10.2.1. Zone 0
- 10.2.2. Zone 20
- 10.2.3. Zone 1
- 10.2.4. Zone 21
- 10.2.5. Zone 22
- 10.3. Market Analysis, Insights and Forecast - by End-User Industry
- 10.3.1. Oil & Gas
- 10.3.2. Petrochemical
- 10.3.3. Industrial
- 10.3.4. Power Generation
- 10.3.5. Pharmaceutical
- 10.3.6. Processing
- 10.3.7. Other End-user Industries
- 10.1. Market Analysis, Insights and Forecast - by Class
- 11. Middle East and Africa Hazardous Location LED Lighting Industry Analysis, Insights and Forecast, 2020-2032
- 11.1. Market Analysis, Insights and Forecast - by Class
- 11.1.1. Class I
- 11.1.2. Class II
- 11.1.3. Class III
- 11.2. Market Analysis, Insights and Forecast - by Device Type
- 11.2.1. Zone 0
- 11.2.2. Zone 20
- 11.2.3. Zone 1
- 11.2.4. Zone 21
- 11.2.5. Zone 22
- 11.3. Market Analysis, Insights and Forecast - by End-User Industry
- 11.3.1. Oil & Gas
- 11.3.2. Petrochemical
- 11.3.3. Industrial
- 11.3.4. Power Generation
- 11.3.5. Pharmaceutical
- 11.3.6. Processing
- 11.3.7. Other End-user Industries
- 11.1. Market Analysis, Insights and Forecast - by Class
- 12. Competitive Analysis
- 12.1. Company Profiles
- 12.1.1 Nemalux Inc
- 12.1.1.1. Company Overview
- 12.1.1.2. Products
- 12.1.1.3. Company Financials
- 12.1.1.4. SWOT Analysis
- 12.1.2 PROLUX International FZ LLC
- 12.1.2.1. Company Overview
- 12.1.2.2. Products
- 12.1.2.3. Company Financials
- 12.1.2.4. SWOT Analysis
- 12.1.3 Shenzhen CESP Co Ltd
- 12.1.3.1. Company Overview
- 12.1.3.2. Products
- 12.1.3.3. Company Financials
- 12.1.3.4. SWOT Analysis
- 12.1.4 Luceco Middle East FZCO
- 12.1.4.1. Company Overview
- 12.1.4.2. Products
- 12.1.4.3. Company Financials
- 12.1.4.4. SWOT Analysis
- 12.1.5 SA Equip
- 12.1.5.1. Company Overview
- 12.1.5.2. Products
- 12.1.5.3. Company Financials
- 12.1.5.4. SWOT Analysis
- 12.1.6 Glamox UK
- 12.1.6.1. Company Overview
- 12.1.6.2. Products
- 12.1.6.3. Company Financials
- 12.1.6.4. SWOT Analysis
- 12.1.7 ABB Installation Products Inc
- 12.1.7.1. Company Overview
- 12.1.7.2. Products
- 12.1.7.3. Company Financials
- 12.1.7.4. SWOT Analysis
- 12.1.8 Azz Inc
- 12.1.8.1. Company Overview
- 12.1.8.2. Products
- 12.1.8.3. Company Financials
- 12.1.8.4. SWOT Analysis
- 12.1.9 Worksite Lighting LLC
- 12.1.9.1. Company Overview
- 12.1.9.2. Products
- 12.1.9.3. Company Financials
- 12.1.9.4. SWOT Analysis
- 12.1.10 Larson Electronics
- 12.1.10.1. Company Overview
- 12.1.10.2. Products
- 12.1.10.3. Company Financials
- 12.1.10.4. SWOT Analysis
- 12.1.11 GE Current
- 12.1.11.1. Company Overview
- 12.1.11.2. Products
- 12.1.11.3. Company Financials
- 12.1.11.4. SWOT Analysis
- 12.1.12 Technology Co Ltd
- 12.1.12.1. Company Overview
- 12.1.12.2. Products
- 12.1.12.3. Company Financials
- 12.1.12.4. SWOT Analysis
- 12.1.13 Hilclare Lighting
- 12.1.13.1. Company Overview
- 12.1.13.2. Products
- 12.1.13.3. Company Financials
- 12.1.13.4. SWOT Analysis
- 12.1.14 Hubbell Limited
- 12.1.14.1. Company Overview
- 12.1.14.2. Products
- 12.1.14.3. Company Financials
- 12.1.14.4. SWOT Analysis
- 12.1.15 Dialight PLC
- 12.1.15.1. Company Overview
- 12.1.15.2. Products
- 12.1.15.3. Company Financials
- 12.1.15.4. SWOT Analysis
- 12.1.16 Emerson FZE (Emerson electric co )
- 12.1.16.1. Company Overview
- 12.1.16.2. Products
- 12.1.16.3. Company Financials
- 12.1.16.4. SWOT Analysis
- 12.1.17 WAROM Technology MENA FZCO
- 12.1.17.1. Company Overview
- 12.1.17.2. Products
- 12.1.17.3. Company Financials
- 12.1.17.4. SWOT Analysis
- 12.1.18 Digital Lumens Inc (OSRAM)
- 12.1.18.1. Company Overview
- 12.1.18.2. Products
- 12.1.18.3. Company Financials
- 12.1.18.4. SWOT Analysis
- 12.1.19 Raytec Ltd
- 12.1.19.1. Company Overview
- 12.1.19.2. Products
- 12.1.19.3. Company Financials
- 12.1.19.4. SWOT Analysis
- 12.1.20 R Stahl Limited
- 12.1.20.1. Company Overview
- 12.1.20.2. Products
- 12.1.20.3. Company Financials
- 12.1.20.4. SWOT Analysis
- 12.1.21 Munira Lighting (AL Hatimi Trading FZE)
- 12.1.21.1. Company Overview
- 12.1.21.2. Products
- 12.1.21.3. Company Financials
- 12.1.21.4. SWOT Analysis
- 12.1.22 DCD Technologies ME FZCO
- 12.1.22.1. Company Overview
- 12.1.22.2. Products
- 12.1.22.3. Company Financials
- 12.1.22.4. SWOT Analysis
- 12.1.23 IKIO LED Lighting
- 12.1.23.1. Company Overview
- 12.1.23.2. Products
- 12.1.23.3. Company Financials
- 12.1.23.4. SWOT Analysis
- 12.1.24 Eaton Corporation
- 12.1.24.1. Company Overview
- 12.1.24.2. Products
- 12.1.24.3. Company Financials
- 12.1.24.4. SWOT Analysis
- 12.1.1 Nemalux Inc
- 12.2. Market Entropy
- 12.2.1 Company's Key Areas Served
- 12.2.2 Recent Developments
- 12.3. Company Market Share Analysis 2025
- 12.3.1 Top 5 Companies Market Share Analysis
- 12.3.2 Top 3 Companies Market Share Analysis
- 12.4. List of Potential Customers
- 13. Research Methodology
List of Figures
- Figure 1: Global Hazardous Location LED Lighting Industry Revenue Breakdown (billion, %) by Region 2025 & 2033
- Figure 2: North America Hazardous Location LED Lighting Industry Revenue (billion), by Class 2025 & 2033
- Figure 3: North America Hazardous Location LED Lighting Industry Revenue Share (%), by Class 2025 & 2033
- Figure 4: North America Hazardous Location LED Lighting Industry Revenue (billion), by Device Type 2025 & 2033
- Figure 5: North America Hazardous Location LED Lighting Industry Revenue Share (%), by Device Type 2025 & 2033
- Figure 6: North America Hazardous Location LED Lighting Industry Revenue (billion), by End-User Industry 2025 & 2033
- Figure 7: North America Hazardous Location LED Lighting Industry Revenue Share (%), by End-User Industry 2025 & 2033
- Figure 8: North America Hazardous Location LED Lighting Industry Revenue (billion), by Country 2025 & 2033
- Figure 9: North America Hazardous Location LED Lighting Industry Revenue Share (%), by Country 2025 & 2033
- Figure 10: Europe Hazardous Location LED Lighting Industry Revenue (billion), by Class 2025 & 2033
- Figure 11: Europe Hazardous Location LED Lighting Industry Revenue Share (%), by Class 2025 & 2033
- Figure 12: Europe Hazardous Location LED Lighting Industry Revenue (billion), by Device Type 2025 & 2033
- Figure 13: Europe Hazardous Location LED Lighting Industry Revenue Share (%), by Device Type 2025 & 2033
- Figure 14: Europe Hazardous Location LED Lighting Industry Revenue (billion), by End-User Industry 2025 & 2033
- Figure 15: Europe Hazardous Location LED Lighting Industry Revenue Share (%), by End-User Industry 2025 & 2033
- Figure 16: Europe Hazardous Location LED Lighting Industry Revenue (billion), by Country 2025 & 2033
- Figure 17: Europe Hazardous Location LED Lighting Industry Revenue Share (%), by Country 2025 & 2033
- Figure 18: Asia Pacific Hazardous Location LED Lighting Industry Revenue (billion), by Class 2025 & 2033
- Figure 19: Asia Pacific Hazardous Location LED Lighting Industry Revenue Share (%), by Class 2025 & 2033
- Figure 20: Asia Pacific Hazardous Location LED Lighting Industry Revenue (billion), by Device Type 2025 & 2033
- Figure 21: Asia Pacific Hazardous Location LED Lighting Industry Revenue Share (%), by Device Type 2025 & 2033
- Figure 22: Asia Pacific Hazardous Location LED Lighting Industry Revenue (billion), by End-User Industry 2025 & 2033
- Figure 23: Asia Pacific Hazardous Location LED Lighting Industry Revenue Share (%), by End-User Industry 2025 & 2033
- Figure 24: Asia Pacific Hazardous Location LED Lighting Industry Revenue (billion), by Country 2025 & 2033
- Figure 25: Asia Pacific Hazardous Location LED Lighting Industry Revenue Share (%), by Country 2025 & 2033
- Figure 26: Latin America Hazardous Location LED Lighting Industry Revenue (billion), by Class 2025 & 2033
- Figure 27: Latin America Hazardous Location LED Lighting Industry Revenue Share (%), by Class 2025 & 2033
- Figure 28: Latin America Hazardous Location LED Lighting Industry Revenue (billion), by Device Type 2025 & 2033
- Figure 29: Latin America Hazardous Location LED Lighting Industry Revenue Share (%), by Device Type 2025 & 2033
- Figure 30: Latin America Hazardous Location LED Lighting Industry Revenue (billion), by End-User Industry 2025 & 2033
- Figure 31: Latin America Hazardous Location LED Lighting Industry Revenue Share (%), by End-User Industry 2025 & 2033
- Figure 32: Latin America Hazardous Location LED Lighting Industry Revenue (billion), by Country 2025 & 2033
- Figure 33: Latin America Hazardous Location LED Lighting Industry Revenue Share (%), by Country 2025 & 2033
- Figure 34: Middle East and Africa Hazardous Location LED Lighting Industry Revenue (billion), by Class 2025 & 2033
- Figure 35: Middle East and Africa Hazardous Location LED Lighting Industry Revenue Share (%), by Class 2025 & 2033
- Figure 36: Middle East and Africa Hazardous Location LED Lighting Industry Revenue (billion), by Device Type 2025 & 2033
- Figure 37: Middle East and Africa Hazardous Location LED Lighting Industry Revenue Share (%), by Device Type 2025 & 2033
- Figure 38: Middle East and Africa Hazardous Location LED Lighting Industry Revenue (billion), by End-User Industry 2025 & 2033
- Figure 39: Middle East and Africa Hazardous Location LED Lighting Industry Revenue Share (%), by End-User Industry 2025 & 2033
- Figure 40: Middle East and Africa Hazardous Location LED Lighting Industry Revenue (billion), by Country 2025 & 2033
- Figure 41: Middle East and Africa Hazardous Location LED Lighting Industry Revenue Share (%), by Country 2025 & 2033
List of Tables
- Table 1: Global Hazardous Location LED Lighting Industry Revenue billion Forecast, by Class 2020 & 2033
- Table 2: Global Hazardous Location LED Lighting Industry Revenue billion Forecast, by Device Type 2020 & 2033
- Table 3: Global Hazardous Location LED Lighting Industry Revenue billion Forecast, by End-User Industry 2020 & 2033
- Table 4: Global Hazardous Location LED Lighting Industry Revenue billion Forecast, by Region 2020 & 2033
- Table 5: Global Hazardous Location LED Lighting Industry Revenue billion Forecast, by Class 2020 & 2033
- Table 6: Global Hazardous Location LED Lighting Industry Revenue billion Forecast, by Device Type 2020 & 2033
- Table 7: Global Hazardous Location LED Lighting Industry Revenue billion Forecast, by End-User Industry 2020 & 2033
- Table 8: Global Hazardous Location LED Lighting Industry Revenue billion Forecast, by Country 2020 & 2033
- Table 9: Global Hazardous Location LED Lighting Industry Revenue billion Forecast, by Class 2020 & 2033
- Table 10: Global Hazardous Location LED Lighting Industry Revenue billion Forecast, by Device Type 2020 & 2033
- Table 11: Global Hazardous Location LED Lighting Industry Revenue billion Forecast, by End-User Industry 2020 & 2033
- Table 12: Global Hazardous Location LED Lighting Industry Revenue billion Forecast, by Country 2020 & 2033
- Table 13: Global Hazardous Location LED Lighting Industry Revenue billion Forecast, by Class 2020 & 2033
- Table 14: Global Hazardous Location LED Lighting Industry Revenue billion Forecast, by Device Type 2020 & 2033
- Table 15: Global Hazardous Location LED Lighting Industry Revenue billion Forecast, by End-User Industry 2020 & 2033
- Table 16: Global Hazardous Location LED Lighting Industry Revenue billion Forecast, by Country 2020 & 2033
- Table 17: Global Hazardous Location LED Lighting Industry Revenue billion Forecast, by Class 2020 & 2033
- Table 18: Global Hazardous Location LED Lighting Industry Revenue billion Forecast, by Device Type 2020 & 2033
- Table 19: Global Hazardous Location LED Lighting Industry Revenue billion Forecast, by End-User Industry 2020 & 2033
- Table 20: Global Hazardous Location LED Lighting Industry Revenue billion Forecast, by Country 2020 & 2033
- Table 21: Global Hazardous Location LED Lighting Industry Revenue billion Forecast, by Class 2020 & 2033
- Table 22: Global Hazardous Location LED Lighting Industry Revenue billion Forecast, by Device Type 2020 & 2033
- Table 23: Global Hazardous Location LED Lighting Industry Revenue billion Forecast, by End-User Industry 2020 & 2033
- Table 24: Global Hazardous Location LED Lighting Industry Revenue billion Forecast, by Country 2020 & 2033
Frequently Asked Questions
1. What is the projected Compound Annual Growth Rate (CAGR) of the Hazardous Location LED Lighting Industry?
The projected CAGR is approximately 8.64%.
2. Which companies are prominent players in the Hazardous Location LED Lighting Industry?
Key companies in the market include Nemalux Inc, PROLUX International FZ LLC, Shenzhen CESP Co Ltd, Luceco Middle East FZCO, SA Equip, Glamox UK, ABB Installation Products Inc, Azz Inc, Worksite Lighting LLC, Larson Electronics, GE Current, Technology Co Ltd, Hilclare Lighting, Hubbell Limited, Dialight PLC, Emerson FZE (Emerson electric co ), WAROM Technology MENA FZCO, Digital Lumens Inc (OSRAM), Raytec Ltd, R Stahl Limited, Munira Lighting (AL Hatimi Trading FZE), DCD Technologies ME FZCO, IKIO LED Lighting, Eaton Corporation.
3. What are the main segments of the Hazardous Location LED Lighting Industry?
The market segments include Class, Device Type , End-User Industry .
4. Can you provide details about the market size?
The market size is estimated to be USD 9.13 billion as of 2022.
5. What are some drivers contributing to market growth?
Regulations Promoting Proper Lighting for Worker Safety in Hazardous Locations; Rising Demand for Cost-effective and Energy-efficient LED Lighting Solutions.
6. What are the notable trends driving market growth?
Rising Demand for Cost-effective and Energy-efficient LED Lighting Solutions will Drive the Market Growth.
7. Are there any restraints impacting market growth?
High Costs of Equipment.
8. Can you provide examples of recent developments in the market?
Jan 2020 - ABB announced plans to launch its smart sensor for rotating machines operating in hazardous areas at Hannover Messe 2020. This new generation of smart sensors may provide high-quality data to enable ABB's advanced analytics to be used in hazardous locations. This product launch may further extend the existing scope of applications for ABB smart sensors with a new generation design for hazardous areas.
9. What pricing options are available for accessing the report?
Pricing options include single-user, multi-user, and enterprise licenses priced at USD 4750, USD 5250, and USD 8750 respectively.
10. Is the market size provided in terms of value or volume?
The market size is provided in terms of value, measured in billion.
11. Are there any specific market keywords associated with the report?
Yes, the market keyword associated with the report is "Hazardous Location LED Lighting Industry," which aids in identifying and referencing the specific market segment covered.
12. How do I determine which pricing option suits my needs best?
The pricing options vary based on user requirements and access needs. Individual users may opt for single-user licenses, while businesses requiring broader access may choose multi-user or enterprise licenses for cost-effective access to the report.
13. Are there any additional resources or data provided in the Hazardous Location LED Lighting Industry report?
While the report offers comprehensive insights, it's advisable to review the specific contents or supplementary materials provided to ascertain if additional resources or data are available.
14. How can I stay updated on further developments or reports in the Hazardous Location LED Lighting Industry?
To stay informed about further developments, trends, and reports in the Hazardous Location LED Lighting Industry, consider subscribing to industry newsletters, following relevant companies and organizations, or regularly checking reputable industry news sources and publications.
Methodology
Step 1 - Identification of Relevant Samples Size from Population Database


Step 2 - Approaches for Defining Global Market Size (Value, Volume* & Price*)

Note*: In applicable scenarios
Step 3 - Data Sources
Primary Research
- Web Analytics
- Survey Reports
- Research Institute
- Latest Research Reports
- Opinion Leaders
Secondary Research
- Annual Reports
- White Paper
- Latest Press Release
- Industry Association
- Paid Database
- Investor Presentations

Step 4 - Data Triangulation
Involves using different sources of information in order to increase the validity of a study
These sources are likely to be stakeholders in a program - participants, other researchers, program staff, other community members, and so on.
Then we put all data in single framework & apply various statistical tools to find out the dynamic on the market.
During the analysis stage, feedback from the stakeholder groups would be compared to determine areas of agreement as well as areas of divergence