

Key Insights
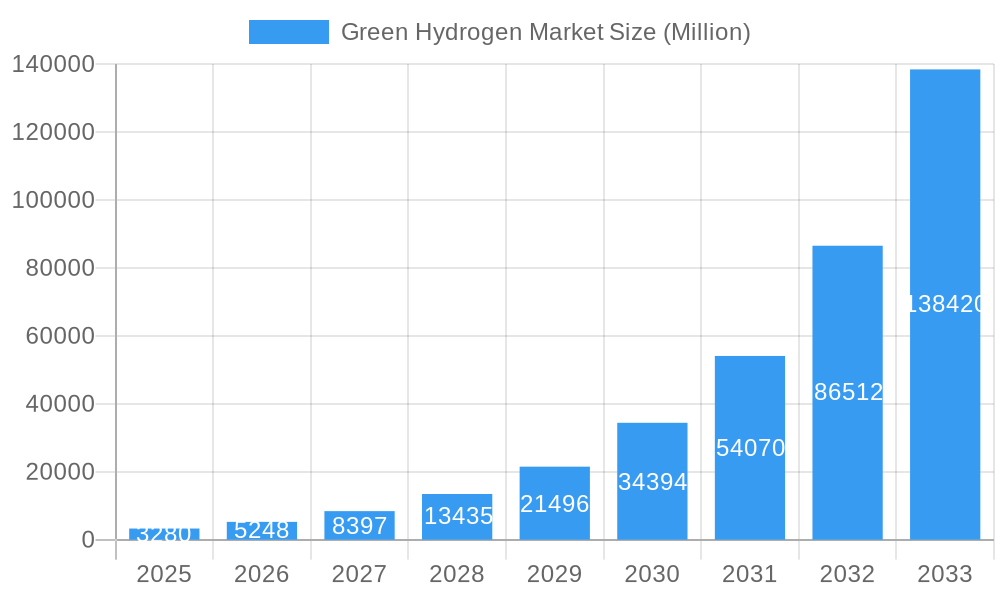
The green hydrogen market is experiencing explosive growth, projected to reach a market size of $3.28 billion in 2025 and exhibiting a remarkable Compound Annual Growth Rate (CAGR) exceeding 60%. This surge is driven by several key factors. Firstly, the escalating global demand for clean energy solutions, coupled with stringent environmental regulations aimed at reducing carbon emissions, is creating a strong impetus for the adoption of green hydrogen as a sustainable alternative to fossil fuels. Secondly, technological advancements in electrolysis, the primary method for green hydrogen production, are continuously improving efficiency and reducing costs. Furthermore, significant investments from governments and private entities are fueling research and development, accelerating the deployment of green hydrogen infrastructure, including production facilities, storage solutions, and distribution networks. The refining, chemicals, iron and steel, and transportation sectors are leading adopters, leveraging green hydrogen for decarbonizing their operations.
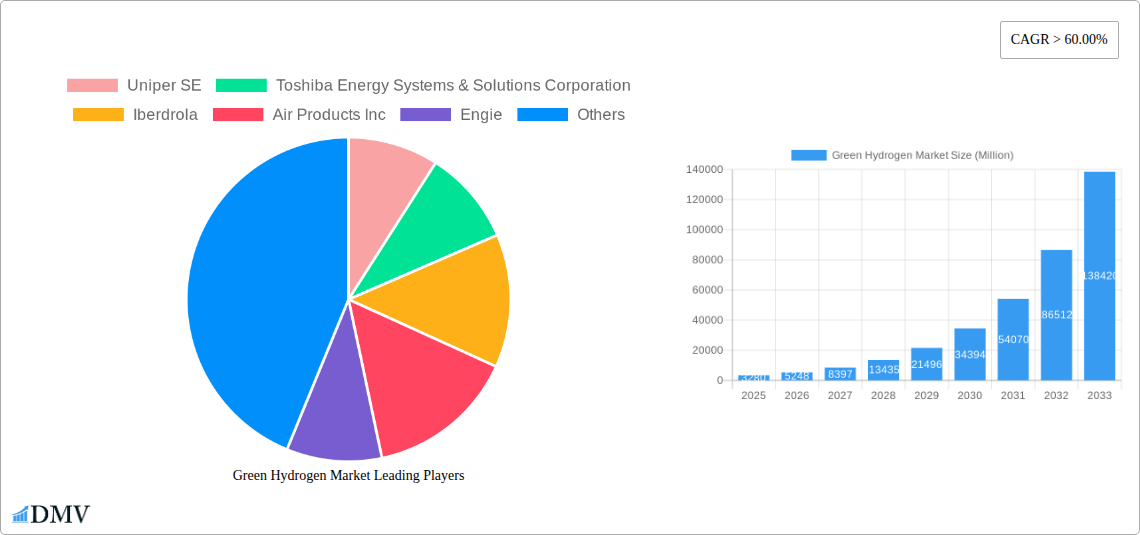
Green Hydrogen Market Market Size (In Billion)
However, the market also faces certain challenges. High initial capital expenditures associated with green hydrogen production plants remain a significant barrier to entry for many players. The intermittent nature of renewable energy sources used for electrolysis, like solar and wind power, poses challenges in terms of consistent hydrogen production. Finally, the lack of established and widespread hydrogen refueling infrastructure in many regions is hindering widespread adoption, especially in the transportation sector. Despite these restraints, the long-term outlook for the green hydrogen market remains exceptionally positive. The ongoing commitment to decarbonization globally, coupled with technological innovation and supportive policy frameworks, strongly suggests continued robust growth throughout the forecast period (2025-2033). The substantial presence of major players like Uniper SE, Toshiba Energy Systems & Solutions Corporation, and Air Liquide, amongst others, further solidifies the market's potential.
Green Hydrogen Market Company Market Share
Green Hydrogen Market: A Comprehensive Report (2019-2033)
This insightful report provides a detailed analysis of the Green Hydrogen Market, encompassing market trends, leading players, technological advancements, and future growth projections from 2019 to 2033. The study period covers the historical period (2019-2024), the base year (2025), and the forecast period (2025-2033). This comprehensive analysis is crucial for stakeholders seeking to navigate the evolving landscape of this rapidly expanding sector. The report's findings are based on rigorous research and data analysis, providing actionable insights for strategic decision-making. The total market size is predicted to reach xx Million by 2033.
Green Hydrogen Market Market Composition & Trends
This section delves into the intricate dynamics of the green hydrogen market, examining market concentration, innovation drivers, regulatory frameworks, substitute products, end-user profiles, and mergers and acquisitions (M&A) activities. The analysis provides a granular understanding of market share distribution amongst key players and the financial implications of significant M&A deals.
Market Concentration: The market exhibits a moderately concentrated landscape with key players like Uniper SE, Toshiba Energy Systems & Solutions Corporation, Iberdrola, and Air Products Inc holding significant market shares. However, a considerable number of smaller players are also actively participating, fostering competition and innovation. The estimated market share of the top 5 players in 2025 is approximately xx%.
Innovation Catalysts: Advancements in electrolysis technology, particularly in alkaline and PEM electrolyzers, are driving down production costs and enhancing efficiency. Furthermore, increasing government support for renewable energy initiatives and supportive policies are fostering innovation within the green hydrogen sector.
Regulatory Landscape: Government regulations and policies promoting renewable energy adoption and carbon emission reduction are crucial in driving market growth. The evolving regulatory landscape, with varying policies across different regions, significantly impacts market dynamics.
Substitute Products: While green hydrogen faces competition from grey and blue hydrogen, its environmental benefits and potential for carbon neutrality are key differentiating factors. The report meticulously assesses the competitive landscape considering substitute products and their market implications.
End-User Profiles: The report profiles end-user industries, including refining, chemicals, iron and steel, transportation, and other end-user industries, highlighting their individual growth trajectories and hydrogen consumption patterns.
M&A Activities: The section analyzes notable M&A activities in the green hydrogen market, including deal values and their impact on market consolidation and technological advancements. The total value of M&A deals in the period 2019-2024 is estimated to be xx Million.
Green Hydrogen Market Industry Evolution
This section presents a comprehensive analysis of the green hydrogen market's evolutionary trajectory, focusing on market growth rates, technological progress, and evolving consumer preferences. We examine the factors influencing market expansion, technological breakthroughs, and shifts in consumer demand for sustainable energy solutions. Detailed analysis includes growth rate projections for different segments and adoption metrics for key technologies. The market is projected to witness a Compound Annual Growth Rate (CAGR) of xx% during the forecast period (2025-2033). This growth is largely driven by increasing investments in renewable energy infrastructure, supportive government policies, and growing awareness of climate change. Technological advancements such as improved electrolyzer efficiency and reduced production costs are further accelerating market adoption. The increasing demand for decarbonization across various sectors, especially in transportation and industry, is another key factor driving market growth.
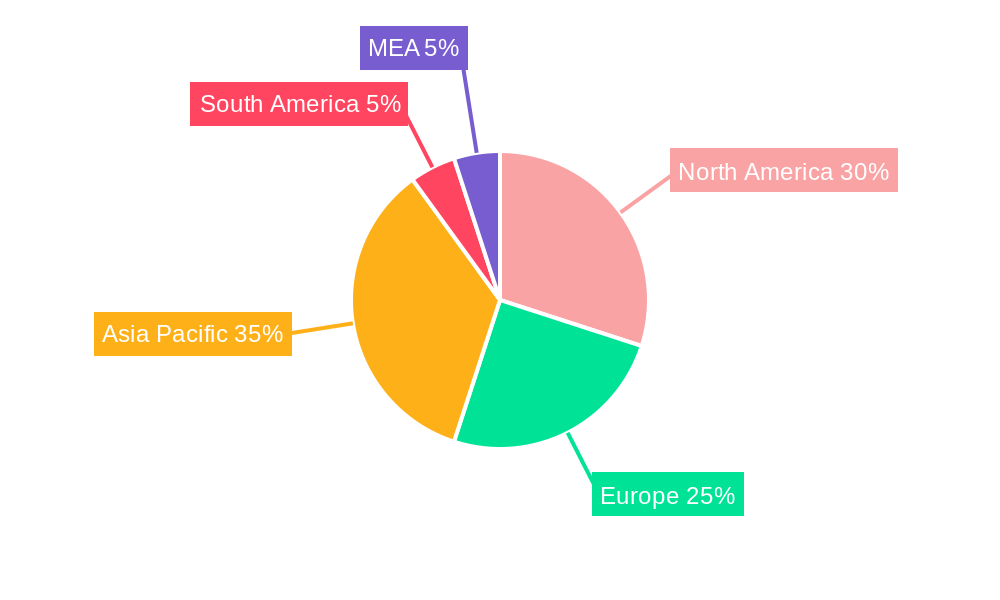
Leading Regions, Countries, or Segments in Green Hydrogen Market
This section identifies the dominant regions, countries, and end-user segments within the green hydrogen market. Detailed analysis explores the underlying factors contributing to their dominance.
Europe: Europe is currently a leading region due to strong government support for renewable energy, ambitious climate targets, and significant investments in green hydrogen projects.
Key Drivers in Europe:
- Significant investments in green hydrogen projects from both public and private sectors.
- Stringent environmental regulations pushing for decarbonization.
- Abundant renewable energy resources, particularly wind and solar power.
- Presence of established industrial clusters consuming large quantities of hydrogen.
Other Regions: While Europe currently leads, other regions such as North America and Asia-Pacific are also experiencing significant growth, driven by increasing investment and supportive policies. The report analyzes these regions and their specific growth drivers. The detailed analysis of other regions and countries includes data on investment levels, regulatory frameworks, and industry adoption rates.
Green Hydrogen Market Product Innovations
The green hydrogen market is characterized by continuous innovation in electrolyzer technologies, leading to enhanced efficiency, reduced costs, and improved scalability. Significant advancements include the development of high-efficiency electrolyzers, improved materials, and advanced control systems. These innovations are expanding the range of applications for green hydrogen, leading to its increased adoption across various industries. The development of compact and modular electrolyzers is making green hydrogen production more accessible to a wider range of users.
Propelling Factors for Green Hydrogen Market Growth
Several factors contribute to the market's growth trajectory. These include technological advancements driving down production costs, supportive government policies incentivizing renewable energy adoption, and increasing demand for decarbonization across various industrial sectors. The falling cost of renewable energy sources like solar and wind power is making green hydrogen production more economically viable.
Obstacles in the Green Hydrogen Market Market
Despite its significant potential, the green hydrogen market faces several challenges. These include the high initial investment costs associated with green hydrogen production facilities, the need for significant infrastructure development for storage and transportation, and the intermittent nature of renewable energy sources. Furthermore, competition from existing fossil fuel-based hydrogen production methods and technological hurdles related to efficient hydrogen storage and transportation pose significant obstacles.
Future Opportunities in Green Hydrogen Market
The green hydrogen market presents numerous future opportunities. Expansion into new applications such as long-haul transportation and heavy industry, further advancements in electrolysis technology, and the development of innovative storage solutions hold immense potential. The integration of green hydrogen with existing energy infrastructure, such as natural gas pipelines, offers significant opportunities for scalability and market expansion.
Major Players in the Green Hydrogen Market Ecosystem
Key Developments in Green Hydrogen Market Industry
- June 2022: Siemens Energy announced a joint venture with Air Liquide to produce industrial-scale renewable hydrogen electrolyzers in Europe.
- September 2022: ENGIE announced the final investment decision for a large-scale renewable hydrogen project in Western Australia, aiming to build a 'Pilbara Green Hydrogen Hub'.
- September 2022: Siemens commissioned one of Germany's largest green hydrogen generation plants, showcasing advancements in digital planning and execution.
- January 2023: Nel and Statkraft signed a contract for the delivery of 40 MW electrolyzers, collaborating to establish a robust value chain for green hydrogen production in Norway.
Strategic Green Hydrogen Market Market Forecast
The green hydrogen market is poised for substantial growth, driven by technological advancements, supportive government policies, and increasing demand for sustainable energy solutions. The market is expected to experience significant expansion over the forecast period, with opportunities across various segments and geographical regions. Continued innovation in electrolyzer technology, coupled with large-scale infrastructure development, will be crucial in realizing the market's full potential and ensuring a rapid transition towards a sustainable energy future.
Green Hydrogen Market Segmentation
-
1. End-user Industry
- 1.1. Refining
- 1.2. Chemicals
- 1.3. Iron and Steel
- 1.4. Transportation
- 1.5. Power and Other End-user Industries
Green Hydrogen Market Segmentation By Geography
-
1. Asia Pacific
- 1.1. China
- 1.2. India
- 1.3. Japan
- 1.4. South Korea
- 1.5. Rest of Asia Pacific
-
2. North America
- 2.1. United States
- 2.2. Canada
- 2.3. Mexico
-
3. Europe
- 3.1. Germany
- 3.2. United Kingdom
- 3.3. France
- 3.4. Italy
- 3.5. Rest of Europe
-
4. Rest of the World
- 4.1. South America
- 4.2. Middle East and Africa
Green Hydrogen Market Regional Market Share
Geographic Coverage of Green Hydrogen Market
Green Hydrogen Market REPORT HIGHLIGHTS
| Aspects | Details |
|---|---|
| Study Period | 2020-2034 |
| Base Year | 2025 |
| Estimated Year | 2026 |
| Forecast Period | 2026-2034 |
| Historical Period | 2020-2025 |
| Growth Rate | CAGR of > 60.00% from 2020-2034 |
| Segmentation |
|
Table of Contents
- 1. Introduction
- 1.1. Research Scope
- 1.2. Market Segmentation
- 1.3. Research Methodology
- 1.4. Definitions and Assumptions
- 2. Executive Summary
- 2.1. Introduction
- 3. Market Dynamics
- 3.1. Introduction
- 3.2. Market Drivers
- 3.2.1. Surging Demand in the Chemical Industry; Growing Environmental Concerns Regarding Carbon Emissions
- 3.3. Market Restrains
- 3.3.1. High Cost of Green Hydrogen; Other Market Restraints
- 3.4. Market Trends
- 3.4.1. Surging Demand in the Chemical Industry
- 4. Market Factor Analysis
- 4.1. Porters Five Forces
- 4.2. Supply/Value Chain
- 4.3. PESTEL analysis
- 4.4. Market Entropy
- 4.5. Patent/Trademark Analysis
- 5. Global Green Hydrogen Market Analysis, Insights and Forecast, 2020-2032
- 5.1. Market Analysis, Insights and Forecast - by End-user Industry
- 5.1.1. Refining
- 5.1.2. Chemicals
- 5.1.3. Iron and Steel
- 5.1.4. Transportation
- 5.1.5. Power and Other End-user Industries
- 5.2. Market Analysis, Insights and Forecast - by Region
- 5.2.1. Asia Pacific
- 5.2.2. North America
- 5.2.3. Europe
- 5.2.4. Rest of the World
- 5.1. Market Analysis, Insights and Forecast - by End-user Industry
- 6. Asia Pacific Green Hydrogen Market Analysis, Insights and Forecast, 2020-2032
- 6.1. Market Analysis, Insights and Forecast - by End-user Industry
- 6.1.1. Refining
- 6.1.2. Chemicals
- 6.1.3. Iron and Steel
- 6.1.4. Transportation
- 6.1.5. Power and Other End-user Industries
- 6.1. Market Analysis, Insights and Forecast - by End-user Industry
- 7. North America Green Hydrogen Market Analysis, Insights and Forecast, 2020-2032
- 7.1. Market Analysis, Insights and Forecast - by End-user Industry
- 7.1.1. Refining
- 7.1.2. Chemicals
- 7.1.3. Iron and Steel
- 7.1.4. Transportation
- 7.1.5. Power and Other End-user Industries
- 7.1. Market Analysis, Insights and Forecast - by End-user Industry
- 8. Europe Green Hydrogen Market Analysis, Insights and Forecast, 2020-2032
- 8.1. Market Analysis, Insights and Forecast - by End-user Industry
- 8.1.1. Refining
- 8.1.2. Chemicals
- 8.1.3. Iron and Steel
- 8.1.4. Transportation
- 8.1.5. Power and Other End-user Industries
- 8.1. Market Analysis, Insights and Forecast - by End-user Industry
- 9. Rest of the World Green Hydrogen Market Analysis, Insights and Forecast, 2020-2032
- 9.1. Market Analysis, Insights and Forecast - by End-user Industry
- 9.1.1. Refining
- 9.1.2. Chemicals
- 9.1.3. Iron and Steel
- 9.1.4. Transportation
- 9.1.5. Power and Other End-user Industries
- 9.1. Market Analysis, Insights and Forecast - by End-user Industry
- 10. Competitive Analysis
- 10.1. Global Market Share Analysis 2025
- 10.2. Company Profiles
- 10.2.1 Uniper SE
- 10.2.1.1. Overview
- 10.2.1.2. Products
- 10.2.1.3. SWOT Analysis
- 10.2.1.4. Recent Developments
- 10.2.1.5. Financials (Based on Availability)
- 10.2.2 Toshiba Energy Systems & Solutions Corporation
- 10.2.2.1. Overview
- 10.2.2.2. Products
- 10.2.2.3. SWOT Analysis
- 10.2.2.4. Recent Developments
- 10.2.2.5. Financials (Based on Availability)
- 10.2.3 Iberdrola
- 10.2.3.1. Overview
- 10.2.3.2. Products
- 10.2.3.3. SWOT Analysis
- 10.2.3.4. Recent Developments
- 10.2.3.5. Financials (Based on Availability)
- 10.2.4 Air Products Inc
- 10.2.4.1. Overview
- 10.2.4.2. Products
- 10.2.4.3. SWOT Analysis
- 10.2.4.4. Recent Developments
- 10.2.4.5. Financials (Based on Availability)
- 10.2.5 Engie
- 10.2.5.1. Overview
- 10.2.5.2. Products
- 10.2.5.3. SWOT Analysis
- 10.2.5.4. Recent Developments
- 10.2.5.5. Financials (Based on Availability)
- 10.2.6 Yara International*List Not Exhaustive
- 10.2.6.1. Overview
- 10.2.6.2. Products
- 10.2.6.3. SWOT Analysis
- 10.2.6.4. Recent Developments
- 10.2.6.5. Financials (Based on Availability)
- 10.2.7 Lhyfe
- 10.2.7.1. Overview
- 10.2.7.2. Products
- 10.2.7.3. SWOT Analysis
- 10.2.7.4. Recent Developments
- 10.2.7.5. Financials (Based on Availability)
- 10.2.8 Linde plc
- 10.2.8.1. Overview
- 10.2.8.2. Products
- 10.2.8.3. SWOT Analysis
- 10.2.8.4. Recent Developments
- 10.2.8.5. Financials (Based on Availability)
- 10.2.9 Cummins Inc
- 10.2.9.1. Overview
- 10.2.9.2. Products
- 10.2.9.3. SWOT Analysis
- 10.2.9.4. Recent Developments
- 10.2.9.5. Financials (Based on Availability)
- 10.2.10 Siemens Energy
- 10.2.10.1. Overview
- 10.2.10.2. Products
- 10.2.10.3. SWOT Analysis
- 10.2.10.4. Recent Developments
- 10.2.10.5. Financials (Based on Availability)
- 10.2.11 Air Liquide
- 10.2.11.1. Overview
- 10.2.11.2. Products
- 10.2.11.3. SWOT Analysis
- 10.2.11.4. Recent Developments
- 10.2.11.5. Financials (Based on Availability)
- 10.2.12 Nel ASA
- 10.2.12.1. Overview
- 10.2.12.2. Products
- 10.2.12.3. SWOT Analysis
- 10.2.12.4. Recent Developments
- 10.2.12.5. Financials (Based on Availability)
- 10.2.13 Bloom Energy
- 10.2.13.1. Overview
- 10.2.13.2. Products
- 10.2.13.3. SWOT Analysis
- 10.2.13.4. Recent Developments
- 10.2.13.5. Financials (Based on Availability)
- 10.2.1 Uniper SE
List of Figures
- Figure 1: Global Green Hydrogen Market Revenue Breakdown (Million, %) by Region 2025 & 2033
- Figure 2: Global Green Hydrogen Market Volume Breakdown (K Tons, %) by Region 2025 & 2033
- Figure 3: Asia Pacific Green Hydrogen Market Revenue (Million), by End-user Industry 2025 & 2033
- Figure 4: Asia Pacific Green Hydrogen Market Volume (K Tons), by End-user Industry 2025 & 2033
- Figure 5: Asia Pacific Green Hydrogen Market Revenue Share (%), by End-user Industry 2025 & 2033
- Figure 6: Asia Pacific Green Hydrogen Market Volume Share (%), by End-user Industry 2025 & 2033
- Figure 7: Asia Pacific Green Hydrogen Market Revenue (Million), by Country 2025 & 2033
- Figure 8: Asia Pacific Green Hydrogen Market Volume (K Tons), by Country 2025 & 2033
- Figure 9: Asia Pacific Green Hydrogen Market Revenue Share (%), by Country 2025 & 2033
- Figure 10: Asia Pacific Green Hydrogen Market Volume Share (%), by Country 2025 & 2033
- Figure 11: North America Green Hydrogen Market Revenue (Million), by End-user Industry 2025 & 2033
- Figure 12: North America Green Hydrogen Market Volume (K Tons), by End-user Industry 2025 & 2033
- Figure 13: North America Green Hydrogen Market Revenue Share (%), by End-user Industry 2025 & 2033
- Figure 14: North America Green Hydrogen Market Volume Share (%), by End-user Industry 2025 & 2033
- Figure 15: North America Green Hydrogen Market Revenue (Million), by Country 2025 & 2033
- Figure 16: North America Green Hydrogen Market Volume (K Tons), by Country 2025 & 2033
- Figure 17: North America Green Hydrogen Market Revenue Share (%), by Country 2025 & 2033
- Figure 18: North America Green Hydrogen Market Volume Share (%), by Country 2025 & 2033
- Figure 19: Europe Green Hydrogen Market Revenue (Million), by End-user Industry 2025 & 2033
- Figure 20: Europe Green Hydrogen Market Volume (K Tons), by End-user Industry 2025 & 2033
- Figure 21: Europe Green Hydrogen Market Revenue Share (%), by End-user Industry 2025 & 2033
- Figure 22: Europe Green Hydrogen Market Volume Share (%), by End-user Industry 2025 & 2033
- Figure 23: Europe Green Hydrogen Market Revenue (Million), by Country 2025 & 2033
- Figure 24: Europe Green Hydrogen Market Volume (K Tons), by Country 2025 & 2033
- Figure 25: Europe Green Hydrogen Market Revenue Share (%), by Country 2025 & 2033
- Figure 26: Europe Green Hydrogen Market Volume Share (%), by Country 2025 & 2033
- Figure 27: Rest of the World Green Hydrogen Market Revenue (Million), by End-user Industry 2025 & 2033
- Figure 28: Rest of the World Green Hydrogen Market Volume (K Tons), by End-user Industry 2025 & 2033
- Figure 29: Rest of the World Green Hydrogen Market Revenue Share (%), by End-user Industry 2025 & 2033
- Figure 30: Rest of the World Green Hydrogen Market Volume Share (%), by End-user Industry 2025 & 2033
- Figure 31: Rest of the World Green Hydrogen Market Revenue (Million), by Country 2025 & 2033
- Figure 32: Rest of the World Green Hydrogen Market Volume (K Tons), by Country 2025 & 2033
- Figure 33: Rest of the World Green Hydrogen Market Revenue Share (%), by Country 2025 & 2033
- Figure 34: Rest of the World Green Hydrogen Market Volume Share (%), by Country 2025 & 2033
List of Tables
- Table 1: Global Green Hydrogen Market Revenue Million Forecast, by End-user Industry 2020 & 2033
- Table 2: Global Green Hydrogen Market Volume K Tons Forecast, by End-user Industry 2020 & 2033
- Table 3: Global Green Hydrogen Market Revenue Million Forecast, by Region 2020 & 2033
- Table 4: Global Green Hydrogen Market Volume K Tons Forecast, by Region 2020 & 2033
- Table 5: Global Green Hydrogen Market Revenue Million Forecast, by End-user Industry 2020 & 2033
- Table 6: Global Green Hydrogen Market Volume K Tons Forecast, by End-user Industry 2020 & 2033
- Table 7: Global Green Hydrogen Market Revenue Million Forecast, by Country 2020 & 2033
- Table 8: Global Green Hydrogen Market Volume K Tons Forecast, by Country 2020 & 2033
- Table 9: China Green Hydrogen Market Revenue (Million) Forecast, by Application 2020 & 2033
- Table 10: China Green Hydrogen Market Volume (K Tons) Forecast, by Application 2020 & 2033
- Table 11: India Green Hydrogen Market Revenue (Million) Forecast, by Application 2020 & 2033
- Table 12: India Green Hydrogen Market Volume (K Tons) Forecast, by Application 2020 & 2033
- Table 13: Japan Green Hydrogen Market Revenue (Million) Forecast, by Application 2020 & 2033
- Table 14: Japan Green Hydrogen Market Volume (K Tons) Forecast, by Application 2020 & 2033
- Table 15: South Korea Green Hydrogen Market Revenue (Million) Forecast, by Application 2020 & 2033
- Table 16: South Korea Green Hydrogen Market Volume (K Tons) Forecast, by Application 2020 & 2033
- Table 17: Rest of Asia Pacific Green Hydrogen Market Revenue (Million) Forecast, by Application 2020 & 2033
- Table 18: Rest of Asia Pacific Green Hydrogen Market Volume (K Tons) Forecast, by Application 2020 & 2033
- Table 19: Global Green Hydrogen Market Revenue Million Forecast, by End-user Industry 2020 & 2033
- Table 20: Global Green Hydrogen Market Volume K Tons Forecast, by End-user Industry 2020 & 2033
- Table 21: Global Green Hydrogen Market Revenue Million Forecast, by Country 2020 & 2033
- Table 22: Global Green Hydrogen Market Volume K Tons Forecast, by Country 2020 & 2033
- Table 23: United States Green Hydrogen Market Revenue (Million) Forecast, by Application 2020 & 2033
- Table 24: United States Green Hydrogen Market Volume (K Tons) Forecast, by Application 2020 & 2033
- Table 25: Canada Green Hydrogen Market Revenue (Million) Forecast, by Application 2020 & 2033
- Table 26: Canada Green Hydrogen Market Volume (K Tons) Forecast, by Application 2020 & 2033
- Table 27: Mexico Green Hydrogen Market Revenue (Million) Forecast, by Application 2020 & 2033
- Table 28: Mexico Green Hydrogen Market Volume (K Tons) Forecast, by Application 2020 & 2033
- Table 29: Global Green Hydrogen Market Revenue Million Forecast, by End-user Industry 2020 & 2033
- Table 30: Global Green Hydrogen Market Volume K Tons Forecast, by End-user Industry 2020 & 2033
- Table 31: Global Green Hydrogen Market Revenue Million Forecast, by Country 2020 & 2033
- Table 32: Global Green Hydrogen Market Volume K Tons Forecast, by Country 2020 & 2033
- Table 33: Germany Green Hydrogen Market Revenue (Million) Forecast, by Application 2020 & 2033
- Table 34: Germany Green Hydrogen Market Volume (K Tons) Forecast, by Application 2020 & 2033
- Table 35: United Kingdom Green Hydrogen Market Revenue (Million) Forecast, by Application 2020 & 2033
- Table 36: United Kingdom Green Hydrogen Market Volume (K Tons) Forecast, by Application 2020 & 2033
- Table 37: France Green Hydrogen Market Revenue (Million) Forecast, by Application 2020 & 2033
- Table 38: France Green Hydrogen Market Volume (K Tons) Forecast, by Application 2020 & 2033
- Table 39: Italy Green Hydrogen Market Revenue (Million) Forecast, by Application 2020 & 2033
- Table 40: Italy Green Hydrogen Market Volume (K Tons) Forecast, by Application 2020 & 2033
- Table 41: Rest of Europe Green Hydrogen Market Revenue (Million) Forecast, by Application 2020 & 2033
- Table 42: Rest of Europe Green Hydrogen Market Volume (K Tons) Forecast, by Application 2020 & 2033
- Table 43: Global Green Hydrogen Market Revenue Million Forecast, by End-user Industry 2020 & 2033
- Table 44: Global Green Hydrogen Market Volume K Tons Forecast, by End-user Industry 2020 & 2033
- Table 45: Global Green Hydrogen Market Revenue Million Forecast, by Country 2020 & 2033
- Table 46: Global Green Hydrogen Market Volume K Tons Forecast, by Country 2020 & 2033
- Table 47: South America Green Hydrogen Market Revenue (Million) Forecast, by Application 2020 & 2033
- Table 48: South America Green Hydrogen Market Volume (K Tons) Forecast, by Application 2020 & 2033
- Table 49: Middle East and Africa Green Hydrogen Market Revenue (Million) Forecast, by Application 2020 & 2033
- Table 50: Middle East and Africa Green Hydrogen Market Volume (K Tons) Forecast, by Application 2020 & 2033
Frequently Asked Questions
1. What is the projected Compound Annual Growth Rate (CAGR) of the Green Hydrogen Market?
The projected CAGR is approximately > 60.00%.
2. Which companies are prominent players in the Green Hydrogen Market?
Key companies in the market include Uniper SE, Toshiba Energy Systems & Solutions Corporation, Iberdrola, Air Products Inc, Engie, Yara International*List Not Exhaustive, Lhyfe, Linde plc, Cummins Inc, Siemens Energy, Air Liquide, Nel ASA, Bloom Energy.
3. What are the main segments of the Green Hydrogen Market?
The market segments include End-user Industry.
4. Can you provide details about the market size?
The market size is estimated to be USD 3.28 Million as of 2022.
5. What are some drivers contributing to market growth?
Surging Demand in the Chemical Industry; Growing Environmental Concerns Regarding Carbon Emissions.
6. What are the notable trends driving market growth?
Surging Demand in the Chemical Industry.
7. Are there any restraints impacting market growth?
High Cost of Green Hydrogen; Other Market Restraints.
8. Can you provide examples of recent developments in the market?
January 2023: Nel and Statkraft, Europe's largest supplier of renewable energy, signed a contract for delivery of 40 MW electrolyzers and will thus collaborate to create a strong value chain for the production of green hydrogen in Norway.
9. What pricing options are available for accessing the report?
Pricing options include single-user, multi-user, and enterprise licenses priced at USD 4750, USD 5250, and USD 8750 respectively.
10. Is the market size provided in terms of value or volume?
The market size is provided in terms of value, measured in Million and volume, measured in K Tons.
11. Are there any specific market keywords associated with the report?
Yes, the market keyword associated with the report is "Green Hydrogen Market," which aids in identifying and referencing the specific market segment covered.
12. How do I determine which pricing option suits my needs best?
The pricing options vary based on user requirements and access needs. Individual users may opt for single-user licenses, while businesses requiring broader access may choose multi-user or enterprise licenses for cost-effective access to the report.
13. Are there any additional resources or data provided in the Green Hydrogen Market report?
While the report offers comprehensive insights, it's advisable to review the specific contents or supplementary materials provided to ascertain if additional resources or data are available.
14. How can I stay updated on further developments or reports in the Green Hydrogen Market?
To stay informed about further developments, trends, and reports in the Green Hydrogen Market, consider subscribing to industry newsletters, following relevant companies and organizations, or regularly checking reputable industry news sources and publications.
Methodology
Step 1 - Identification of Relevant Samples Size from Population Database


Step 2 - Approaches for Defining Global Market Size (Value, Volume* & Price*)

Note*: In applicable scenarios
Step 3 - Data Sources
Primary Research
- Web Analytics
- Survey Reports
- Research Institute
- Latest Research Reports
- Opinion Leaders
Secondary Research
- Annual Reports
- White Paper
- Latest Press Release
- Industry Association
- Paid Database
- Investor Presentations

Step 4 - Data Triangulation
Involves using different sources of information in order to increase the validity of a study
These sources are likely to be stakeholders in a program - participants, other researchers, program staff, other community members, and so on.
Then we put all data in single framework & apply various statistical tools to find out the dynamic on the market.
During the analysis stage, feedback from the stakeholder groups would be compared to determine areas of agreement as well as areas of divergence