

Key Insights
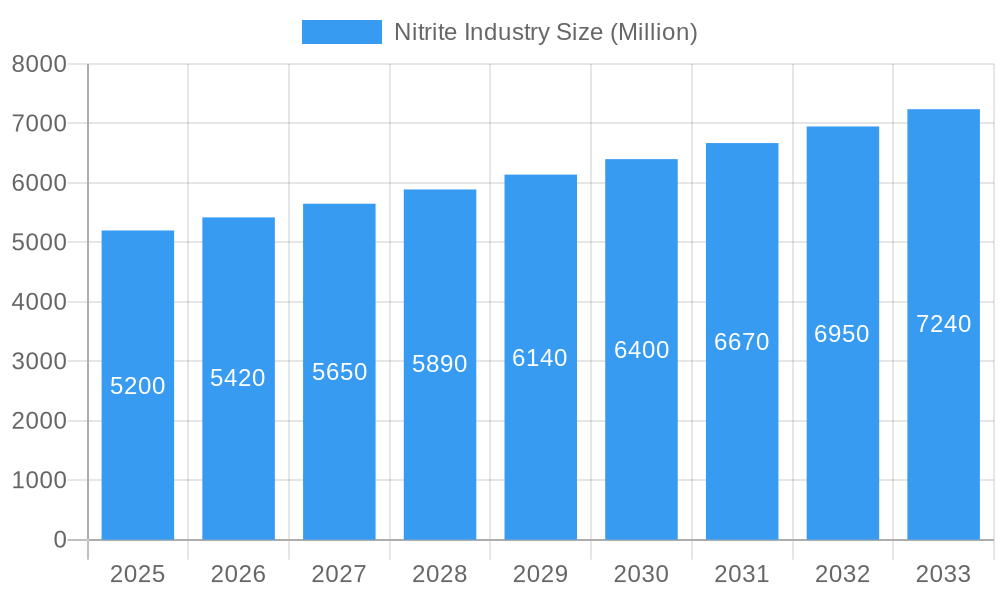
The global Nitrite Industry is poised for robust expansion, with an estimated market size of approximately USD 5,200 million in 2025. Driven by a Compound Annual Growth Rate (CAGR) exceeding 4.00%, the market is projected to reach significant valuations by 2033. This growth is underpinned by diverse and expanding applications across key sectors. The agriculture segment is witnessing increased demand for nitrites as effective fertilizers, enhancing crop yields and soil health. Simultaneously, the food and beverage industry continues to rely on nitrites for their preservative qualities, ensuring product safety and extending shelf life, particularly in processed meats and cured products. Furthermore, the healthcare and pharmaceutical sectors are exploring and utilizing nitrites in various therapeutic applications and diagnostic tools, contributing to market uplift. The construction industry is also a notable contributor, leveraging nitrites in cement additives to control setting times and improve concrete performance.
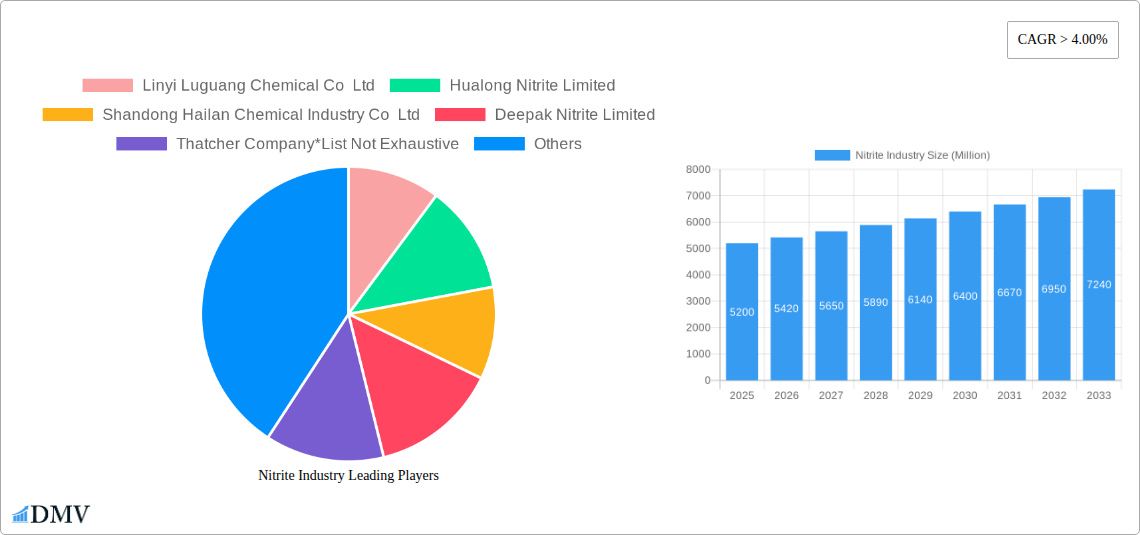
Nitrite Industry Market Size (In Billion)
Emerging trends, such as advancements in nitrite synthesis technologies leading to higher purity and more sustainable production, are expected to fuel further market penetration. Innovations in specialized nitrite formulations for niche applications, including metallurgy for surface treatment and corrosion inhibition, are also gaining traction. However, the market faces certain restraints, primarily revolving around evolving regulatory landscapes concerning nitrite usage, particularly in food products, and the ongoing research into safer alternatives. Public perception and consumer demand for "clean label" products can also influence market dynamics. Despite these challenges, the inherent utility and cost-effectiveness of nitrites in various industrial processes, coupled with ongoing research and development, suggest a strong and resilient growth trajectory for the global Nitrite Industry. Key players like Linyi Luguang Chemical Co Ltd, Hualong Nitrite Limited, and Deepak Nitrite Limited are actively investing in expanding their production capacities and exploring new application areas to capitalize on this market growth.
Nitrite Industry Company Market Share
Nitrite Industry Market Composition & Trends
The global nitrite industry showcases a dynamic market composition, characterized by a moderate level of concentration among key players and an increasing emphasis on innovation and sustainability. Companies like Linyi Luguang Chemical Co Ltd, Hualong Nitrite Limited, Shandong Hailan Chemical Industry Co Ltd, Deepak Nitrite Limited, Thatcher Company, Finoric LLC, Forbes Pharmaceutical, Anmol Chemicals Group, Surpass Chemical Company Inc, MUBY CHEMICALS, Linyi Kemele Chemical Co Ltd, and BASF SE are pivotal in shaping market dynamics. Market share distribution is influenced by production capacities, technological expertise, and strategic partnerships. For instance, BASF's significant investments in sustainable solutions and its collaborative ventures are expected to command a larger share in the coming years. Regulatory landscapes, particularly concerning food safety and environmental impact, are stringent, driving the adoption of high-purity nitrites and the development of eco-friendly production methods. The threat of substitute products remains relatively low due to the specific chemical properties and essential applications of nitrites in various sectors, though ongoing research into alternative preservation methods exists. End-user profiles are diverse, spanning agriculture, food and beverages, healthcare, construction, pharmaceutical, and metallurgy. Mergers and acquisitions (M&A) activities are anticipated to rise as larger entities seek to consolidate market presence and acquire innovative technologies. For example, the acquisition of smaller, specialized nitrite manufacturers by established chemical giants could see M&A deal values reaching hundreds of millions of dollars, further influencing market concentration. Innovation catalysts include the demand for enhanced food preservation, the development of advanced fertilizers, and the growing pharmaceutical and healthcare sectors, all contributing to a projected market growth of over 8% annually.
Nitrite Industry Industry Evolution
The nitrite industry has undergone a significant evolution from its historical roots to its current sophisticated market landscape, driven by technological advancements, shifting consumer demands, and critical industry developments. The historical period from 2019–2024 saw steady growth, primarily fueled by the established applications of sodium nitrite in food preservation and potassium nitrite in industrial processes. During this time, market growth trajectories were largely dictated by the expansion of the food and beverage sector and the consistent demand from the pharmaceutical industry. Key technological advancements included incremental improvements in production efficiency and purity levels of existing nitrite types, such as Calcium Nitrite, Potassium Nitrite, and Sodium Nitrite. Consumer demand began to pivot towards cleaner labels and natural preservatives, creating an impetus for research into alternative applications and potentially more sustainable nitrite production methods, though the inherent properties of nitrites maintained their dominance in specific applications.
The base year of 2025 marks a pivotal point, with significant investments in greenfield projects poised to reshape the industry. For instance, Deepak Nitrite Ltd and Deepak Phenolics Ltd's investment of USD 18.18 million in producing high-value solvents crucial for life sciences, especially in pharmaceuticals and agrochemicals, exemplifies this shift. This strategic move not only diversifies their product portfolio but also directly contributes to the growth of the nitrite market by increasing the demand for precursors and byproducts. Furthermore, the forecast period of 2025–2033 is expected to witness accelerated growth, propelled by innovative initiatives like BASF's "climate-smart meat" pilot project. This project, aiming to reduce nitrous oxide emissions by up to 50% through the use of nitrification inhibitors in feed crop cultivation, translates to a 3-5% reduction in the carbon footprint per kilogram of pork. Such groundbreaking efforts, involving 84 farmers across more than 20,000 hectares in Denmark, are set to become significant market drivers. This underscores a paradigm shift towards environmentally conscious applications and the integration of nitrites into broader sustainability initiatives. The adoption of these advanced applications is projected to reach over 15% of the total fertilizer market by the end of the forecast period. The collaboration between BASF SE and Häffner GmbH & Co. KG as a distribution partner for Sodium Nitrate and Nitrite below 20 tonnes also highlights a growing segment of specialized distribution channels catering to niche market needs, indicating a maturing and segmenting nitrite market. The overall industry evolution reflects a move from basic chemical supply to value-added solutions and sustainable practices, with an estimated compound annual growth rate (CAGR) of approximately 7.5% during the forecast period.
Leading Regions, Countries, or Segments in Nitrite Industry
The nitrite industry's dominance is a multifaceted phenomenon, with specific regions, countries, and segments exhibiting pronounced leadership. Among the Type segments, Sodium Nitrite consistently leads due to its widespread application in the food and beverage industry as a preservative and color fixative, and its critical role in the pharmaceutical sector. Its established production infrastructure and cost-effectiveness contribute significantly to its market share, which is estimated to be over 40% of the total nitrite market in 2025. Potassium Nitrite follows, primarily driven by its use in industrial applications, including metallurgy and specialized chemical synthesis. Calcium Nitrite is gaining traction, particularly in the construction sector as a concrete admixture for corrosion protection, with its market share projected to grow at a CAGR of 9% during the forecast period.
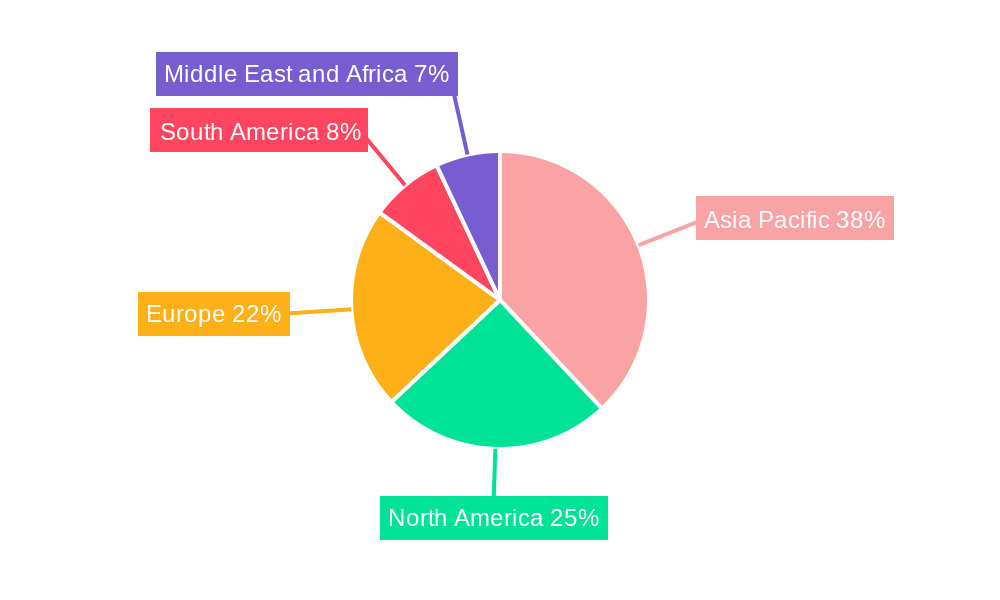
Geographically, Asia Pacific is emerging as the dominant region, propelled by rapid industrialization, a burgeoning food processing industry, and significant investments in infrastructure and healthcare across countries like China and India. Key drivers in this region include robust government support for manufacturing sectors, a large consumer base demanding processed foods, and increasing healthcare expenditures. The region's market share is expected to exceed 35% by 2033. Within Asia Pacific, China, with its vast chemical manufacturing capabilities and extensive domestic market, stands out as the leading country. Its production capacity for various nitrite types, especially Sodium Nitrite, is substantial, catering to both domestic and international demand. Investment trends in China show a strong focus on expanding production facilities and enhancing technological capabilities to meet higher purity standards.
In terms of Application, the Food and Beverages segment remains the largest consumer of nitrites, accounting for an estimated 50% of the total market demand in 2025. This is driven by the global demand for processed meats, cheeses, and other food products where nitrites are essential for preservation, safety, and visual appeal. The Pharmaceutical and Healthcare segments are the second-largest drivers, utilizing nitrites in the synthesis of active pharmaceutical ingredients (APIs), as diagnostic reagents, and in various medical treatments. The growth in this segment is supported by increasing global health awareness and the expansion of the pharmaceutical manufacturing base in emerging economies. The Construction segment, with the growing adoption of Calcium Nitrite as a concrete additive, presents a significant growth opportunity, projected to expand at a CAGR of 10% from 2025 to 2033. Regulatory support for enhancing food safety standards and the increasing demand for durable construction materials worldwide further bolster the dominance of these leading segments and regions.
Nitrite Industry Product Innovations
The nitrite industry is witnessing exciting product innovations focused on enhancing performance, sustainability, and safety across various applications. A key development is the creation of high-purity Sodium Nitrite and Potassium Nitrite grades, specifically tailored for the pharmaceutical industry, enabling more precise drug synthesis and reduced impurity profiles. In the agricultural sector, advancements in Calcium Nitrite formulations have led to improved nitrification inhibitors, significantly reducing nitrous oxide emissions from fertilizers, as demonstrated by BASF's "climate-smart meat" initiative. These innovations offer a 3-5% reduction in the carbon footprint of agricultural products. Furthermore, research is underway to develop novel nitrite derivatives with enhanced antimicrobial properties for food preservation, aiming to extend shelf life while meeting stringent regulatory requirements and consumer preferences for cleaner labels. Performance metrics like improved efficiency in nitrogen retention for fertilizers and enhanced stability in pharmaceutical intermediates are key selling propositions for these novel products.
Propelling Factors for Nitrite Industry Growth
Several key factors are propelling the growth of the nitrite industry. Technologically, advancements in production processes are leading to higher purity levels and more sustainable manufacturing, exemplified by initiatives to reduce emissions and enhance resource efficiency. Economically, the expanding global population and the rising demand for processed foods are driving the consumption of nitrites, particularly Sodium Nitrite, for preservation and color enhancement. The growth of the pharmaceutical sector, with its increasing need for nitrites as intermediates and reagents, also presents a significant growth catalyst. Regulatory influences, while sometimes stringent, also contribute by setting higher standards for food safety and environmental impact, thus favoring producers who invest in advanced technologies and compliance. For instance, the increasing focus on reducing agricultural emissions through nitrification inhibitors directly fuels demand for specialized nitrite derivatives.
Obstacles in the Nitrite Industry Market
Despite its growth, the nitrite industry faces several obstacles. Regulatory challenges, particularly regarding the perceived health risks associated with nitrites in food products, can lead to consumer apprehension and calls for stricter regulations or bans, impacting demand. Supply chain disruptions, stemming from geopolitical events or raw material availability, can affect production costs and lead times, posing a significant challenge to consistent market supply. Competitive pressures from alternative preservation methods, while not yet a direct threat to core nitrite applications, are a growing concern, particularly in the food industry. For example, the development of natural antimicrobials could incrementally erode market share in specific food categories. Quantifiable impacts include potential price volatility due to raw material fluctuations and increased compliance costs associated with evolving environmental and safety standards.
Future Opportunities in Nitrite Industry
The nitrite industry is poised for significant future opportunities. Emerging markets in developing economies present a vast untapped potential for nitrite applications in food processing, agriculture, and healthcare. Technological advancements in sustainable production methods, such as green chemistry approaches to nitrite synthesis, offer opportunities to reduce environmental impact and enhance market appeal. The growing trend towards precision agriculture presents a niche opportunity for advanced nitrification inhibitors derived from nitrites, improving fertilizer efficiency and reducing greenhouse gas emissions. Furthermore, the expanding pharmaceutical and biotechnology sectors are likely to drive demand for specialized nitrite compounds with unique functionalities, opening doors for innovation and value-added product development. The increasing focus on food security and safety globally will continue to underpin the demand for effective preservatives.
Major Players in the Nitrite Industry Ecosystem
- Linyi Luguang Chemical Co Ltd
- Hualong Nitrite Limited
- Shandong Hailan Chemical Industry Co Ltd
- Deepak Nitrite Limited
- Thatcher Company
- Finoric LLC
- Forbes Pharmaceutical
- Anmol Chemicals Group
- Surpass Chemical Company Inc
- MUBY CHEMICALS
- Linyi Kemele Chemical Co Ltd
- BASF SE
Key Developments in Nitrite Industry Industry
- May 2023: BASF initiated a pilot project named "climate-smart meat" in collaboration with Danish Crown, Europe's leading producer of pork products. The aim is to showcase that BASF's nitrification inhibitors can decrease nitrous oxide emissions by as much as 50% when used in fertilizer for cultivating feed crops. This innovation results in a 3-5% reduction in the carbon footprint per kilogram of pork. The project involves 84 farmers across more than 20,000 hectares in Denmark, which is expected to drive the nitrite market during the forecast period.
- July 2022: BASF SE collaborated with Häffner GmbH & Co. KG to serve as a distribution partner for marketing Sodium Nitrate and Nitrite in quantities below 20 tonnes.
- July 2022: Deepak Nitrite Ltd and Deepak Phenolics Ltd invested USD 18.18 million in greenfield projects focused on producing high-value solvents crucial for life sciences, especially in pharmaceuticals and agrochemicals, thereby driving the nitrite market.
Strategic Nitrite Industry Market Forecast
The strategic Nitrite Industry market forecast indicates robust growth driven by an increasing global demand for processed foods, a burgeoning pharmaceutical sector, and a growing emphasis on sustainable agricultural practices. Key growth catalysts include technological advancements in producing high-purity nitrites and the development of eco-friendly nitrification inhibitors, which are expected to significantly reduce agricultural emissions. The expansion of emerging economies and their increasing adoption of modern food preservation techniques will further fuel market penetration. Furthermore, the pharmaceutical industry's continuous need for nitrites as essential chemical intermediates presents a stable and growing demand base. Strategic investments in greenfield projects and collaborative efforts among major players will bolster production capacities and drive innovation, positioning the nitrite market for a projected CAGR of approximately 7.5% throughout the forecast period of 2025–2033. The market potential is substantial, with opportunities in developing advanced applications in construction and healthcare sectors.
Nitrite Industry Segmentation
-
1. Type
- 1.1. Calcium Nitrite
- 1.2. Potassium Nitrite
- 1.3. Sodium Nitrite
- 1.4. Other Ty
-
2. Application
- 2.1. Agriculture
- 2.2. Food and Beverages
- 2.3. Healthcare
- 2.4. Construction
- 2.5. Pharmaceutical
- 2.6. Metallurgy
- 2.7. Other Ap
Nitrite Industry Segmentation By Geography
-
1. Asia Pacific
- 1.1. China
- 1.2. India
- 1.3. Japan
- 1.4. South Korea
- 1.5. Rest of Asia Pacific
-
2. North America
- 2.1. United States
- 2.2. Canada
- 2.3. Mexico
-
3. Europe
- 3.1. Germany
- 3.2. United Kingdom
- 3.3. France
- 3.4. Italy
- 3.5. Rest of Europe
-
4. South America
- 4.1. Brazil
- 4.2. Argentina
- 4.3. Rest of South America
-
5. Middle East and Africa
- 5.1. Saudi Arabia
- 5.2. South Africa
- 5.3. Rest of Middle East and Africa
Nitrite Industry Regional Market Share
Geographic Coverage of Nitrite Industry
Nitrite Industry REPORT HIGHLIGHTS
| Aspects | Details |
|---|---|
| Study Period | 2020-2034 |
| Base Year | 2025 |
| Estimated Year | 2026 |
| Forecast Period | 2026-2034 |
| Historical Period | 2020-2025 |
| Growth Rate | CAGR of 4.6% from 2020-2034 |
| Segmentation |
|
Table of Contents
- 1. Introduction
- 1.1. Research Scope
- 1.2. Market Segmentation
- 1.3. Research Objective
- 1.4. Definitions and Assumptions
- 2. Executive Summary
- 2.1. Market Snapshot
- 3. Market Dynamics
- 3.1. Market Drivers
- 3.2. Market Restrains
- 3.3. Market Trends
- 3.4. Market Opportunities
- 4. Market Factor Analysis
- 4.1. Porters Five Forces
- 4.1.1. Bargaining Power of Suppliers
- 4.1.2. Bargaining Power of Buyers
- 4.1.3. Threat of New Entrants
- 4.1.4. Threat of Substitutes
- 4.1.5. Competitive Rivalry
- 4.2. PESTEL analysis
- 4.3. BCG Analysis
- 4.3.1. Stars (High Growth, High Market Share)
- 4.3.2. Cash Cows (Low Growth, High Market Share)
- 4.3.3. Question Mark (High Growth, Low Market Share)
- 4.3.4. Dogs (Low Growth, Low Market Share)
- 4.4. Ansoff Matrix Analysis
- 4.5. Supply Chain Analysis
- 4.6. Regulatory Landscape
- 4.7. Current Market Potential and Opportunity Assessment (TAM–SAM–SOM Framework)
- 4.8. DMV Analyst Note
- 4.1. Porters Five Forces
- 5. Market Analysis, Insights and Forecast 2021-2033
- 5.1. Market Analysis, Insights and Forecast - by Type
- 5.1.1. Calcium Nitrite
- 5.1.2. Potassium Nitrite
- 5.1.3. Sodium Nitrite
- 5.1.4. Other Ty
- 5.2. Market Analysis, Insights and Forecast - by Application
- 5.2.1. Agriculture
- 5.2.2. Food and Beverages
- 5.2.3. Healthcare
- 5.2.4. Construction
- 5.2.5. Pharmaceutical
- 5.2.6. Metallurgy
- 5.2.7. Other Ap
- 5.3. Market Analysis, Insights and Forecast - by Region
- 5.3.1. Asia Pacific
- 5.3.2. North America
- 5.3.3. Europe
- 5.3.4. South America
- 5.3.5. Middle East and Africa
- 5.1. Market Analysis, Insights and Forecast - by Type
- 6. Global Nitrite Industry Analysis, Insights and Forecast, 2021-2033
- 6.1. Market Analysis, Insights and Forecast - by Type
- 6.1.1. Calcium Nitrite
- 6.1.2. Potassium Nitrite
- 6.1.3. Sodium Nitrite
- 6.1.4. Other Ty
- 6.2. Market Analysis, Insights and Forecast - by Application
- 6.2.1. Agriculture
- 6.2.2. Food and Beverages
- 6.2.3. Healthcare
- 6.2.4. Construction
- 6.2.5. Pharmaceutical
- 6.2.6. Metallurgy
- 6.2.7. Other Ap
- 6.1. Market Analysis, Insights and Forecast - by Type
- 7. Asia Pacific Nitrite Industry Analysis, Insights and Forecast, 2020-2032
- 7.1. Market Analysis, Insights and Forecast - by Type
- 7.1.1. Calcium Nitrite
- 7.1.2. Potassium Nitrite
- 7.1.3. Sodium Nitrite
- 7.1.4. Other Ty
- 7.2. Market Analysis, Insights and Forecast - by Application
- 7.2.1. Agriculture
- 7.2.2. Food and Beverages
- 7.2.3. Healthcare
- 7.2.4. Construction
- 7.2.5. Pharmaceutical
- 7.2.6. Metallurgy
- 7.2.7. Other Ap
- 7.1. Market Analysis, Insights and Forecast - by Type
- 8. North America Nitrite Industry Analysis, Insights and Forecast, 2020-2032
- 8.1. Market Analysis, Insights and Forecast - by Type
- 8.1.1. Calcium Nitrite
- 8.1.2. Potassium Nitrite
- 8.1.3. Sodium Nitrite
- 8.1.4. Other Ty
- 8.2. Market Analysis, Insights and Forecast - by Application
- 8.2.1. Agriculture
- 8.2.2. Food and Beverages
- 8.2.3. Healthcare
- 8.2.4. Construction
- 8.2.5. Pharmaceutical
- 8.2.6. Metallurgy
- 8.2.7. Other Ap
- 8.1. Market Analysis, Insights and Forecast - by Type
- 9. Europe Nitrite Industry Analysis, Insights and Forecast, 2020-2032
- 9.1. Market Analysis, Insights and Forecast - by Type
- 9.1.1. Calcium Nitrite
- 9.1.2. Potassium Nitrite
- 9.1.3. Sodium Nitrite
- 9.1.4. Other Ty
- 9.2. Market Analysis, Insights and Forecast - by Application
- 9.2.1. Agriculture
- 9.2.2. Food and Beverages
- 9.2.3. Healthcare
- 9.2.4. Construction
- 9.2.5. Pharmaceutical
- 9.2.6. Metallurgy
- 9.2.7. Other Ap
- 9.1. Market Analysis, Insights and Forecast - by Type
- 10. South America Nitrite Industry Analysis, Insights and Forecast, 2020-2032
- 10.1. Market Analysis, Insights and Forecast - by Type
- 10.1.1. Calcium Nitrite
- 10.1.2. Potassium Nitrite
- 10.1.3. Sodium Nitrite
- 10.1.4. Other Ty
- 10.2. Market Analysis, Insights and Forecast - by Application
- 10.2.1. Agriculture
- 10.2.2. Food and Beverages
- 10.2.3. Healthcare
- 10.2.4. Construction
- 10.2.5. Pharmaceutical
- 10.2.6. Metallurgy
- 10.2.7. Other Ap
- 10.1. Market Analysis, Insights and Forecast - by Type
- 11. Middle East and Africa Nitrite Industry Analysis, Insights and Forecast, 2020-2032
- 11.1. Market Analysis, Insights and Forecast - by Type
- 11.1.1. Calcium Nitrite
- 11.1.2. Potassium Nitrite
- 11.1.3. Sodium Nitrite
- 11.1.4. Other Ty
- 11.2. Market Analysis, Insights and Forecast - by Application
- 11.2.1. Agriculture
- 11.2.2. Food and Beverages
- 11.2.3. Healthcare
- 11.2.4. Construction
- 11.2.5. Pharmaceutical
- 11.2.6. Metallurgy
- 11.2.7. Other Ap
- 11.1. Market Analysis, Insights and Forecast - by Type
- 12. Competitive Analysis
- 12.1. Company Profiles
- 12.1.1 Linyi Luguang Chemical Co Ltd
- 12.1.1.1. Company Overview
- 12.1.1.2. Products
- 12.1.1.3. Company Financials
- 12.1.1.4. SWOT Analysis
- 12.1.2 Hualong Nitrite Limited
- 12.1.2.1. Company Overview
- 12.1.2.2. Products
- 12.1.2.3. Company Financials
- 12.1.2.4. SWOT Analysis
- 12.1.3 Shandong Hailan Chemical Industry Co Ltd
- 12.1.3.1. Company Overview
- 12.1.3.2. Products
- 12.1.3.3. Company Financials
- 12.1.3.4. SWOT Analysis
- 12.1.4 Deepak Nitrite Limited
- 12.1.4.1. Company Overview
- 12.1.4.2. Products
- 12.1.4.3. Company Financials
- 12.1.4.4. SWOT Analysis
- 12.1.5 Thatcher Company*List Not Exhaustive
- 12.1.5.1. Company Overview
- 12.1.5.2. Products
- 12.1.5.3. Company Financials
- 12.1.5.4. SWOT Analysis
- 12.1.6 Finoric LLC
- 12.1.6.1. Company Overview
- 12.1.6.2. Products
- 12.1.6.3. Company Financials
- 12.1.6.4. SWOT Analysis
- 12.1.7 Forbes Pharmaceutical
- 12.1.7.1. Company Overview
- 12.1.7.2. Products
- 12.1.7.3. Company Financials
- 12.1.7.4. SWOT Analysis
- 12.1.8 Anmol Chemicals Group
- 12.1.8.1. Company Overview
- 12.1.8.2. Products
- 12.1.8.3. Company Financials
- 12.1.8.4. SWOT Analysis
- 12.1.9 Surpass Chemical Company Inc
- 12.1.9.1. Company Overview
- 12.1.9.2. Products
- 12.1.9.3. Company Financials
- 12.1.9.4. SWOT Analysis
- 12.1.10 MUBY CHEMICALS
- 12.1.10.1. Company Overview
- 12.1.10.2. Products
- 12.1.10.3. Company Financials
- 12.1.10.4. SWOT Analysis
- 12.1.11 Linyi Kemele Chemical Co Ltd
- 12.1.11.1. Company Overview
- 12.1.11.2. Products
- 12.1.11.3. Company Financials
- 12.1.11.4. SWOT Analysis
- 12.1.12 BASF SE
- 12.1.12.1. Company Overview
- 12.1.12.2. Products
- 12.1.12.3. Company Financials
- 12.1.12.4. SWOT Analysis
- 12.1.1 Linyi Luguang Chemical Co Ltd
- 12.2. Market Entropy
- 12.2.1 Company's Key Areas Served
- 12.2.2 Recent Developments
- 12.3. Company Market Share Analysis 2025
- 12.3.1 Top 5 Companies Market Share Analysis
- 12.3.2 Top 3 Companies Market Share Analysis
- 12.4. List of Potential Customers
- 13. Research Methodology
List of Figures
- Figure 1: Global Nitrite Industry Revenue Breakdown (million, %) by Region 2025 & 2033
- Figure 2: Global Nitrite Industry Volume Breakdown (Million, %) by Region 2025 & 2033
- Figure 3: Asia Pacific Nitrite Industry Revenue (million), by Type 2025 & 2033
- Figure 4: Asia Pacific Nitrite Industry Volume (Million), by Type 2025 & 2033
- Figure 5: Asia Pacific Nitrite Industry Revenue Share (%), by Type 2025 & 2033
- Figure 6: Asia Pacific Nitrite Industry Volume Share (%), by Type 2025 & 2033
- Figure 7: Asia Pacific Nitrite Industry Revenue (million), by Application 2025 & 2033
- Figure 8: Asia Pacific Nitrite Industry Volume (Million), by Application 2025 & 2033
- Figure 9: Asia Pacific Nitrite Industry Revenue Share (%), by Application 2025 & 2033
- Figure 10: Asia Pacific Nitrite Industry Volume Share (%), by Application 2025 & 2033
- Figure 11: Asia Pacific Nitrite Industry Revenue (million), by Country 2025 & 2033
- Figure 12: Asia Pacific Nitrite Industry Volume (Million), by Country 2025 & 2033
- Figure 13: Asia Pacific Nitrite Industry Revenue Share (%), by Country 2025 & 2033
- Figure 14: Asia Pacific Nitrite Industry Volume Share (%), by Country 2025 & 2033
- Figure 15: North America Nitrite Industry Revenue (million), by Type 2025 & 2033
- Figure 16: North America Nitrite Industry Volume (Million), by Type 2025 & 2033
- Figure 17: North America Nitrite Industry Revenue Share (%), by Type 2025 & 2033
- Figure 18: North America Nitrite Industry Volume Share (%), by Type 2025 & 2033
- Figure 19: North America Nitrite Industry Revenue (million), by Application 2025 & 2033
- Figure 20: North America Nitrite Industry Volume (Million), by Application 2025 & 2033
- Figure 21: North America Nitrite Industry Revenue Share (%), by Application 2025 & 2033
- Figure 22: North America Nitrite Industry Volume Share (%), by Application 2025 & 2033
- Figure 23: North America Nitrite Industry Revenue (million), by Country 2025 & 2033
- Figure 24: North America Nitrite Industry Volume (Million), by Country 2025 & 2033
- Figure 25: North America Nitrite Industry Revenue Share (%), by Country 2025 & 2033
- Figure 26: North America Nitrite Industry Volume Share (%), by Country 2025 & 2033
- Figure 27: Europe Nitrite Industry Revenue (million), by Type 2025 & 2033
- Figure 28: Europe Nitrite Industry Volume (Million), by Type 2025 & 2033
- Figure 29: Europe Nitrite Industry Revenue Share (%), by Type 2025 & 2033
- Figure 30: Europe Nitrite Industry Volume Share (%), by Type 2025 & 2033
- Figure 31: Europe Nitrite Industry Revenue (million), by Application 2025 & 2033
- Figure 32: Europe Nitrite Industry Volume (Million), by Application 2025 & 2033
- Figure 33: Europe Nitrite Industry Revenue Share (%), by Application 2025 & 2033
- Figure 34: Europe Nitrite Industry Volume Share (%), by Application 2025 & 2033
- Figure 35: Europe Nitrite Industry Revenue (million), by Country 2025 & 2033
- Figure 36: Europe Nitrite Industry Volume (Million), by Country 2025 & 2033
- Figure 37: Europe Nitrite Industry Revenue Share (%), by Country 2025 & 2033
- Figure 38: Europe Nitrite Industry Volume Share (%), by Country 2025 & 2033
- Figure 39: South America Nitrite Industry Revenue (million), by Type 2025 & 2033
- Figure 40: South America Nitrite Industry Volume (Million), by Type 2025 & 2033
- Figure 41: South America Nitrite Industry Revenue Share (%), by Type 2025 & 2033
- Figure 42: South America Nitrite Industry Volume Share (%), by Type 2025 & 2033
- Figure 43: South America Nitrite Industry Revenue (million), by Application 2025 & 2033
- Figure 44: South America Nitrite Industry Volume (Million), by Application 2025 & 2033
- Figure 45: South America Nitrite Industry Revenue Share (%), by Application 2025 & 2033
- Figure 46: South America Nitrite Industry Volume Share (%), by Application 2025 & 2033
- Figure 47: South America Nitrite Industry Revenue (million), by Country 2025 & 2033
- Figure 48: South America Nitrite Industry Volume (Million), by Country 2025 & 2033
- Figure 49: South America Nitrite Industry Revenue Share (%), by Country 2025 & 2033
- Figure 50: South America Nitrite Industry Volume Share (%), by Country 2025 & 2033
- Figure 51: Middle East and Africa Nitrite Industry Revenue (million), by Type 2025 & 2033
- Figure 52: Middle East and Africa Nitrite Industry Volume (Million), by Type 2025 & 2033
- Figure 53: Middle East and Africa Nitrite Industry Revenue Share (%), by Type 2025 & 2033
- Figure 54: Middle East and Africa Nitrite Industry Volume Share (%), by Type 2025 & 2033
- Figure 55: Middle East and Africa Nitrite Industry Revenue (million), by Application 2025 & 2033
- Figure 56: Middle East and Africa Nitrite Industry Volume (Million), by Application 2025 & 2033
- Figure 57: Middle East and Africa Nitrite Industry Revenue Share (%), by Application 2025 & 2033
- Figure 58: Middle East and Africa Nitrite Industry Volume Share (%), by Application 2025 & 2033
- Figure 59: Middle East and Africa Nitrite Industry Revenue (million), by Country 2025 & 2033
- Figure 60: Middle East and Africa Nitrite Industry Volume (Million), by Country 2025 & 2033
- Figure 61: Middle East and Africa Nitrite Industry Revenue Share (%), by Country 2025 & 2033
- Figure 62: Middle East and Africa Nitrite Industry Volume Share (%), by Country 2025 & 2033
List of Tables
- Table 1: Global Nitrite Industry Revenue million Forecast, by Type 2020 & 2033
- Table 2: Global Nitrite Industry Volume Million Forecast, by Type 2020 & 2033
- Table 3: Global Nitrite Industry Revenue million Forecast, by Application 2020 & 2033
- Table 4: Global Nitrite Industry Volume Million Forecast, by Application 2020 & 2033
- Table 5: Global Nitrite Industry Revenue million Forecast, by Region 2020 & 2033
- Table 6: Global Nitrite Industry Volume Million Forecast, by Region 2020 & 2033
- Table 7: Global Nitrite Industry Revenue million Forecast, by Type 2020 & 2033
- Table 8: Global Nitrite Industry Volume Million Forecast, by Type 2020 & 2033
- Table 9: Global Nitrite Industry Revenue million Forecast, by Application 2020 & 2033
- Table 10: Global Nitrite Industry Volume Million Forecast, by Application 2020 & 2033
- Table 11: Global Nitrite Industry Revenue million Forecast, by Country 2020 & 2033
- Table 12: Global Nitrite Industry Volume Million Forecast, by Country 2020 & 2033
- Table 13: China Nitrite Industry Revenue (million) Forecast, by Application 2020 & 2033
- Table 14: China Nitrite Industry Volume (Million) Forecast, by Application 2020 & 2033
- Table 15: India Nitrite Industry Revenue (million) Forecast, by Application 2020 & 2033
- Table 16: India Nitrite Industry Volume (Million) Forecast, by Application 2020 & 2033
- Table 17: Japan Nitrite Industry Revenue (million) Forecast, by Application 2020 & 2033
- Table 18: Japan Nitrite Industry Volume (Million) Forecast, by Application 2020 & 2033
- Table 19: South Korea Nitrite Industry Revenue (million) Forecast, by Application 2020 & 2033
- Table 20: South Korea Nitrite Industry Volume (Million) Forecast, by Application 2020 & 2033
- Table 21: Rest of Asia Pacific Nitrite Industry Revenue (million) Forecast, by Application 2020 & 2033
- Table 22: Rest of Asia Pacific Nitrite Industry Volume (Million) Forecast, by Application 2020 & 2033
- Table 23: Global Nitrite Industry Revenue million Forecast, by Type 2020 & 2033
- Table 24: Global Nitrite Industry Volume Million Forecast, by Type 2020 & 2033
- Table 25: Global Nitrite Industry Revenue million Forecast, by Application 2020 & 2033
- Table 26: Global Nitrite Industry Volume Million Forecast, by Application 2020 & 2033
- Table 27: Global Nitrite Industry Revenue million Forecast, by Country 2020 & 2033
- Table 28: Global Nitrite Industry Volume Million Forecast, by Country 2020 & 2033
- Table 29: United States Nitrite Industry Revenue (million) Forecast, by Application 2020 & 2033
- Table 30: United States Nitrite Industry Volume (Million) Forecast, by Application 2020 & 2033
- Table 31: Canada Nitrite Industry Revenue (million) Forecast, by Application 2020 & 2033
- Table 32: Canada Nitrite Industry Volume (Million) Forecast, by Application 2020 & 2033
- Table 33: Mexico Nitrite Industry Revenue (million) Forecast, by Application 2020 & 2033
- Table 34: Mexico Nitrite Industry Volume (Million) Forecast, by Application 2020 & 2033
- Table 35: Global Nitrite Industry Revenue million Forecast, by Type 2020 & 2033
- Table 36: Global Nitrite Industry Volume Million Forecast, by Type 2020 & 2033
- Table 37: Global Nitrite Industry Revenue million Forecast, by Application 2020 & 2033
- Table 38: Global Nitrite Industry Volume Million Forecast, by Application 2020 & 2033
- Table 39: Global Nitrite Industry Revenue million Forecast, by Country 2020 & 2033
- Table 40: Global Nitrite Industry Volume Million Forecast, by Country 2020 & 2033
- Table 41: Germany Nitrite Industry Revenue (million) Forecast, by Application 2020 & 2033
- Table 42: Germany Nitrite Industry Volume (Million) Forecast, by Application 2020 & 2033
- Table 43: United Kingdom Nitrite Industry Revenue (million) Forecast, by Application 2020 & 2033
- Table 44: United Kingdom Nitrite Industry Volume (Million) Forecast, by Application 2020 & 2033
- Table 45: France Nitrite Industry Revenue (million) Forecast, by Application 2020 & 2033
- Table 46: France Nitrite Industry Volume (Million) Forecast, by Application 2020 & 2033
- Table 47: Italy Nitrite Industry Revenue (million) Forecast, by Application 2020 & 2033
- Table 48: Italy Nitrite Industry Volume (Million) Forecast, by Application 2020 & 2033
- Table 49: Rest of Europe Nitrite Industry Revenue (million) Forecast, by Application 2020 & 2033
- Table 50: Rest of Europe Nitrite Industry Volume (Million) Forecast, by Application 2020 & 2033
- Table 51: Global Nitrite Industry Revenue million Forecast, by Type 2020 & 2033
- Table 52: Global Nitrite Industry Volume Million Forecast, by Type 2020 & 2033
- Table 53: Global Nitrite Industry Revenue million Forecast, by Application 2020 & 2033
- Table 54: Global Nitrite Industry Volume Million Forecast, by Application 2020 & 2033
- Table 55: Global Nitrite Industry Revenue million Forecast, by Country 2020 & 2033
- Table 56: Global Nitrite Industry Volume Million Forecast, by Country 2020 & 2033
- Table 57: Brazil Nitrite Industry Revenue (million) Forecast, by Application 2020 & 2033
- Table 58: Brazil Nitrite Industry Volume (Million) Forecast, by Application 2020 & 2033
- Table 59: Argentina Nitrite Industry Revenue (million) Forecast, by Application 2020 & 2033
- Table 60: Argentina Nitrite Industry Volume (Million) Forecast, by Application 2020 & 2033
- Table 61: Rest of South America Nitrite Industry Revenue (million) Forecast, by Application 2020 & 2033
- Table 62: Rest of South America Nitrite Industry Volume (Million) Forecast, by Application 2020 & 2033
- Table 63: Global Nitrite Industry Revenue million Forecast, by Type 2020 & 2033
- Table 64: Global Nitrite Industry Volume Million Forecast, by Type 2020 & 2033
- Table 65: Global Nitrite Industry Revenue million Forecast, by Application 2020 & 2033
- Table 66: Global Nitrite Industry Volume Million Forecast, by Application 2020 & 2033
- Table 67: Global Nitrite Industry Revenue million Forecast, by Country 2020 & 2033
- Table 68: Global Nitrite Industry Volume Million Forecast, by Country 2020 & 2033
- Table 69: Saudi Arabia Nitrite Industry Revenue (million) Forecast, by Application 2020 & 2033
- Table 70: Saudi Arabia Nitrite Industry Volume (Million) Forecast, by Application 2020 & 2033
- Table 71: South Africa Nitrite Industry Revenue (million) Forecast, by Application 2020 & 2033
- Table 72: South Africa Nitrite Industry Volume (Million) Forecast, by Application 2020 & 2033
- Table 73: Rest of Middle East and Africa Nitrite Industry Revenue (million) Forecast, by Application 2020 & 2033
- Table 74: Rest of Middle East and Africa Nitrite Industry Volume (Million) Forecast, by Application 2020 & 2033
Frequently Asked Questions
1. What is the projected Compound Annual Growth Rate (CAGR) of the Nitrite Industry?
The projected CAGR is approximately 4.6%.
2. Which companies are prominent players in the Nitrite Industry?
Key companies in the market include Linyi Luguang Chemical Co Ltd, Hualong Nitrite Limited, Shandong Hailan Chemical Industry Co Ltd, Deepak Nitrite Limited, Thatcher Company*List Not Exhaustive, Finoric LLC, Forbes Pharmaceutical, Anmol Chemicals Group, Surpass Chemical Company Inc, MUBY CHEMICALS, Linyi Kemele Chemical Co Ltd, BASF SE.
3. What are the main segments of the Nitrite Industry?
The market segments include Type, Application.
4. Can you provide details about the market size?
The market size is estimated to be USD 445.4 million as of 2022.
5. What are some drivers contributing to market growth?
Growing Demand from the Agriculture Sector; Increasing Demand for Industrial Applications Like Chemical Synthesis. Construction. Metallurgy. and Pharmaceuticals; Increasing Need for Meat Preservation.
6. What are the notable trends driving market growth?
Agriculture Sector to Dominate the Market.
7. Are there any restraints impacting market growth?
Negative Effects of Nitrite; Threat of Substitutes Like Natural or Organic in Few Applications.
8. Can you provide examples of recent developments in the market?
May 2023: BASF initiated a pilot project named "climate-smart meat" in collaboration with Danish Crown, Europe's leading producer of pork products. The aim is to showcase that BASF's nitrification inhibitors can decrease nitrous oxide emissions by as much as 50% when used in fertilizer for cultivating feed crops. This innovation results in a 3-5% reduction in the carbon footprint per kilogram of pork. The project involves 84 farmers across more than 20,000 hectares in Denmark, which is expected to drive the nitrite market during the forecast period.
9. What pricing options are available for accessing the report?
Pricing options include single-user, multi-user, and enterprise licenses priced at USD 4750, USD 5250, and USD 8750 respectively.
10. Is the market size provided in terms of value or volume?
The market size is provided in terms of value, measured in million and volume, measured in Million.
11. Are there any specific market keywords associated with the report?
Yes, the market keyword associated with the report is "Nitrite Industry," which aids in identifying and referencing the specific market segment covered.
12. How do I determine which pricing option suits my needs best?
The pricing options vary based on user requirements and access needs. Individual users may opt for single-user licenses, while businesses requiring broader access may choose multi-user or enterprise licenses for cost-effective access to the report.
13. Are there any additional resources or data provided in the Nitrite Industry report?
While the report offers comprehensive insights, it's advisable to review the specific contents or supplementary materials provided to ascertain if additional resources or data are available.
14. How can I stay updated on further developments or reports in the Nitrite Industry?
To stay informed about further developments, trends, and reports in the Nitrite Industry, consider subscribing to industry newsletters, following relevant companies and organizations, or regularly checking reputable industry news sources and publications.
Methodology
Step 1 - Identification of Relevant Samples Size from Population Database


Step 2 - Approaches for Defining Global Market Size (Value, Volume* & Price*)

Note*: In applicable scenarios
Step 3 - Data Sources
Primary Research
- Web Analytics
- Survey Reports
- Research Institute
- Latest Research Reports
- Opinion Leaders
Secondary Research
- Annual Reports
- White Paper
- Latest Press Release
- Industry Association
- Paid Database
- Investor Presentations

Step 4 - Data Triangulation
Involves using different sources of information in order to increase the validity of a study
These sources are likely to be stakeholders in a program - participants, other researchers, program staff, other community members, and so on.
Then we put all data in single framework & apply various statistical tools to find out the dynamic on the market.
During the analysis stage, feedback from the stakeholder groups would be compared to determine areas of agreement as well as areas of divergence