

Key Insights
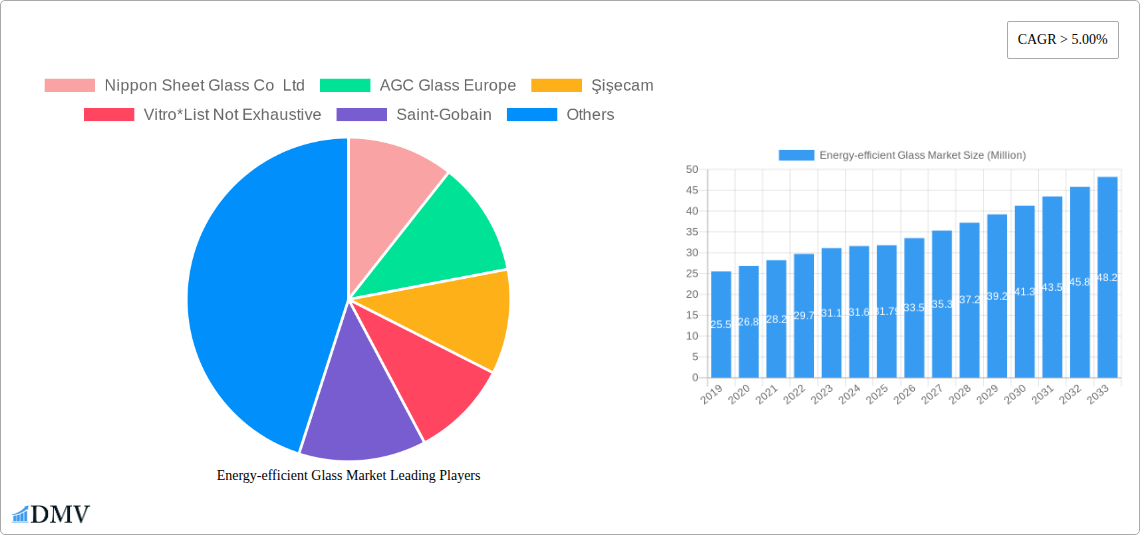
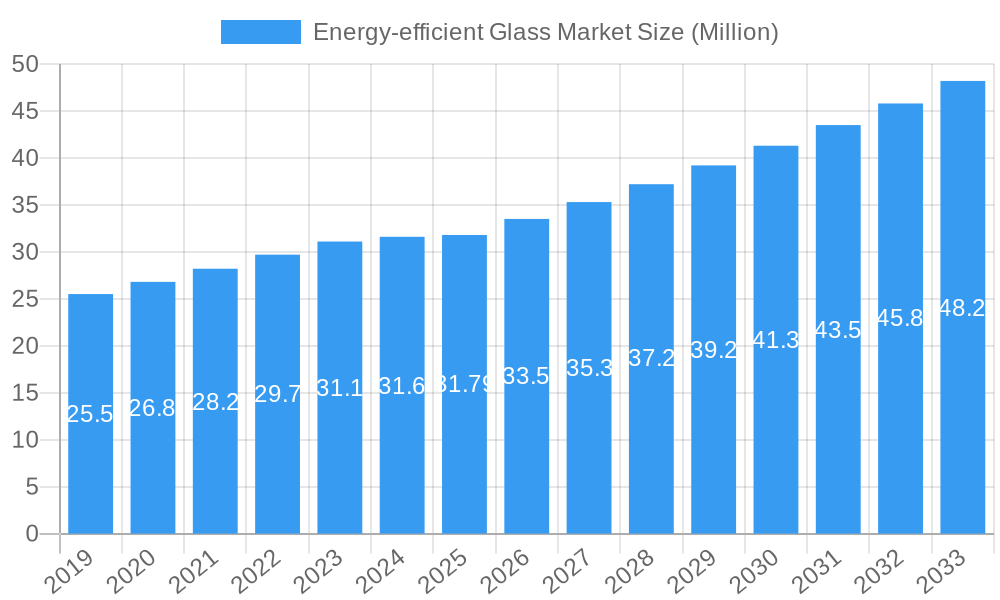
The global Energy-efficient Glass market is poised for robust growth, projected to reach a substantial market size of $31.79 million by 2025, with an impressive Compound Annual Growth Rate (CAGR) exceeding 5.00% throughout the forecast period. This sustained expansion is primarily driven by increasing global awareness of climate change and the urgent need for sustainable building practices. Escalating energy costs worldwide further amplify the demand for energy-efficient solutions, making advanced glass technologies a critical component in reducing operational expenses for buildings and other end-user industries. The market's momentum is fueled by governmental regulations and incentives promoting energy conservation in new construction and renovation projects. Furthermore, technological advancements in glass manufacturing, leading to enhanced thermal insulation and light transmission properties, are key enablers of this market's upward trajectory.
Energy-efficient Glass Market Market Size (In Million)
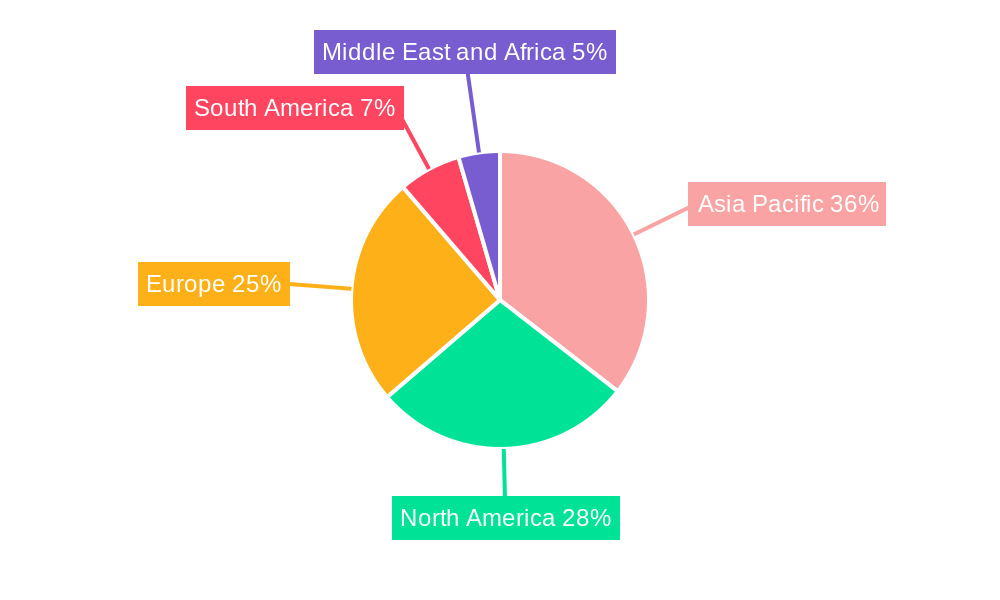
The diverse segments within the energy-efficient glass market are all contributing to its overall dynamism. The demand for advanced glazing types, including double and triple glazing, is accelerating as their superior insulation capabilities become increasingly recognized. Similarly, the development and application of specialized coatings, such as hard and soft coatings, are enhancing glass performance, offering solutions for glare reduction, UV protection, and improved thermal efficiency. The Building and Construction sector remains the dominant end-user industry, driven by the burgeoning demand for green buildings and stringent energy efficiency standards. The Automotive and Solar Panel industries also represent significant growth areas, as manufacturers increasingly integrate energy-efficient glass to improve vehicle fuel economy and optimize solar energy generation. Emerging economies in the Asia Pacific region, particularly China and India, are anticipated to be significant growth engines, owing to rapid urbanization and substantial investments in infrastructure development, alongside supportive government policies for energy-efficient materials.
Energy-efficient Glass Market Company Market Share
This in-depth report offers a detailed examination of the global Energy-efficient Glass Market, covering the historical period from 2019 to 2024, with a base year of 2025 and a comprehensive forecast extending to 2033. We delve into market composition, industry evolution, leading segments, product innovations, growth drivers, obstacles, and future opportunities, providing actionable insights for stakeholders. The analysis includes key players, significant industry developments, and strategic market forecasts, leveraging high-ranking keywords such as "low-e glass," "insulating glass," "sustainable building materials," and "energy savings."
Energy-efficient Glass Market Market Composition & Trends
The Energy-efficient Glass Market exhibits a dynamic and evolving landscape, characterized by moderate concentration with key players like Saint-Gobain, AGC Glass Europe, and Guardian Industries Holdings holding significant market share. Innovation catalysts primarily stem from stringent environmental regulations, a growing consumer demand for sustainable building solutions, and advancements in material science, particularly in coating technologies. The regulatory landscape is increasingly favoring products that reduce energy consumption in buildings and vehicles, driving adoption rates. Substitute products, while present, often fall short in delivering the same level of thermal performance and aesthetic appeal as advanced energy-efficient glass solutions. End-user profiles highlight a strong preference for cost-effectiveness, durability, and enhanced comfort, with the Building and Construction sector being the largest consumer, followed by Automotive and Solar Panel applications. Mergers and acquisitions (M&A) activities are sporadic but strategic, aimed at consolidating market presence and expanding technological capabilities. For instance, the acquisition of smaller coating specialists by larger glass manufacturers aims to integrate innovative technologies and expand product portfolios. The overall market is witnessing a steady increase in adoption, driven by a combination of technological advancements and policy support, with a projected market valuation of over $50,000 million by 2033.
Energy-efficient Glass Market Industry Evolution
The Energy-efficient Glass Market has undergone a significant transformation over the study period (2019–2033), driven by a confluence of technological innovation, escalating energy costs, and a global imperative for sustainability. Early in the historical period (2019-2021), the market was primarily influenced by building codes and standards focusing on basic thermal insulation. However, a noticeable shift occurred from 2022 onwards, propelled by advancements in low-emissivity (low-e) coatings and advancements in glazing technologies. Double and triple glazing have become mainstream, offering substantial improvements in U-values and solar heat gain coefficients, leading to a projected average annual growth rate (AAGR) of approximately 6.5% during the forecast period. The adoption of energy-efficient glass in the building and construction sector has seen a remarkable surge, accounting for over 70% of the market share in 2024, as architects and developers increasingly prioritize green building certifications and long-term operational cost savings. In the automotive sector, the integration of advanced glazing solutions, such as panoramic roofs with solar control properties, is gaining traction, driven by the growing demand for electric vehicles (EVs) that benefit from reduced energy load for climate control. This evolution is further fueled by governmental incentives for energy-efficient retrofits and new constructions, stimulating investment and research into next-generation glass technologies.
Leading Regions, Countries, or Segments in Energy-efficient Glass Market
The Building and Construction end-user industry stands as the dominant segment within the Energy-efficient Glass Market, projecting continued leadership throughout the forecast period. This dominance is underpinned by several key drivers. Firstly, regulatory support in major economies like North America and Europe mandates higher energy performance standards for new buildings and encourages retrofitting of existing structures. For instance, stringent building codes in the United States and the European Union require the use of high-performance glazing to minimize heat loss and gain, thereby reducing HVAC energy consumption. Secondly, investment trends in green building and sustainable development are significantly boosting demand. Global investments in sustainable construction reached over $700,000 million in 2024, with energy-efficient glass being a crucial component. Thirdly, consumer awareness regarding the benefits of energy-efficient homes, including reduced utility bills and enhanced comfort, is on the rise. The Building and Construction segment is expected to contribute more than 65% of the total market revenue by 2033.
Key drivers for this segment's dominance include:
- Stringent Building Codes and Energy Efficiency Standards: Governments worldwide are implementing and enforcing stricter regulations that mandate the use of energy-efficient windows and facade systems.
- Growing Green Building Initiatives: The increasing popularity of certifications like LEED and BREEAM encourages the adoption of sustainable materials and technologies, with energy-efficient glass being a cornerstone.
- Long-Term Cost Savings: Homeowners and commercial property owners are recognizing the significant long-term savings on energy bills achieved through the installation of energy-efficient glazing.
- Enhanced Occupant Comfort and Well-being: Energy-efficient glass contributes to more stable indoor temperatures, reduces drafts, and improves acoustic insulation, leading to a more comfortable living and working environment.
- Urbanization and Infrastructure Development: Rapid urbanization in emerging economies is driving substantial construction activity, with a growing emphasis on energy-efficient designs.
Within glazing types, Double Glazing currently leads, offering a balanced performance and cost-effectiveness. However, Triple Glazing is experiencing a significant growth trajectory due to its superior insulating properties, especially in colder climates, and is projected to capture a larger market share by 2033.
Energy-efficient Glass Market Product Innovations
Product innovations in the Energy-efficient Glass Market are revolutionizing building and vehicle efficiency. The development of advanced low-emissivity (low-e) coatings, both hard-coat and soft-coat variants, is a key advancement, significantly reducing heat transfer while allowing optimal visible light transmission. Innovations also extend to spectrally selective coatings that block unwanted solar heat while admitting daylight, and smart glass technologies that can dynamically adjust their tint or opacity in response to external stimuli. These advancements contribute to substantial energy savings, improved thermal comfort, and reduced greenhouse gas emissions. For instance, the integration of low-e coatings in windows can reduce heating and cooling costs by up to 30%.
Propelling Factors for Energy-efficient Glass Market Growth
The Energy-efficient Glass Market is propelled by several interconnected factors. Stringent government regulations mandating energy efficiency in buildings and vehicles are a primary driver, pushing manufacturers and consumers towards sustainable solutions. The increasing global focus on climate change mitigation and carbon footprint reduction further amplifies demand for products that conserve energy. Technological advancements in coating technologies and glazing systems offer enhanced performance, making energy-efficient glass more accessible and effective. Furthermore, rising energy prices make the long-term cost savings associated with energy-efficient glass increasingly attractive for both residential and commercial consumers. The growing trend of green building and sustainable construction also plays a pivotal role, with certifications like LEED and BREEAM actively promoting the adoption of such materials.
Obstacles in the Energy-efficient Glass Market Market
Despite its robust growth, the Energy-efficient Glass Market faces several obstacles. The higher initial cost of advanced energy-efficient glass compared to conventional options can be a deterrent for some consumers and developers, especially in price-sensitive markets. Lack of awareness and understanding regarding the long-term benefits and return on investment can hinder adoption rates. Supply chain complexities and raw material availability, particularly for specialized coatings, can also pose challenges, leading to potential price volatility. Furthermore, installation complexities and the need for skilled labor can add to the overall project cost and timeline. Regulatory fragmentation across different regions can also create hurdles for global market expansion.
Future Opportunities in Energy-efficient Glass Market
The future of the Energy-efficient Glass Market is brimming with opportunities. The rapid growth of the solar panel industry presents a significant avenue, with demand for specialized photovoltaic glass expected to surge. Smart cities initiatives and the increasing adoption of IoT devices in buildings will drive demand for smart glass with integrated functionalities. The renovation and retrofitting market for existing buildings offers substantial potential as governments and property owners seek to upgrade their energy performance. Emerging economies, with their burgeoning construction sectors and increasing environmental awareness, represent a key growth frontier. Innovations in dynamic glazing and self-healing glass technologies will further expand the application scope and market appeal.
Major Players in the Energy-efficient Glass Market Ecosystem
- Nippon Sheet Glass Co Ltd
- AGC Glass Europe
- Şişecam
- Vitro
- Saint-Gobain
- Morley Glass & Glazing Ltd
- Tuffx Glass
- Cardinal Glass Industries Inc
- Abrisa Technologies
- SCHOTT AG
- Guardian Industries Holdings
- Central Glass Co Ltd
Key Developments in Energy-efficient Glass Market Industry
- August 2022: NSG Group unveiled its expansion plan for TCO (transparent conductive oxide) coated glass production in Malaysia. The initiative involves the installation of a new float line at the Johor Bahru facility of Malaysian Sheet Glass SDN BHD, a member of the NSG Group. This expansion will incorporate online coating capacity and is set to commence TCO glass production for solar panel manufacturers by the close of 2024.
- May 2022: AGC Inc. successfully developed a light-control panoramic roof glass featuring Low-E coating. This innovative glass technology has been incorporated into the LEXUS RZ, a dedicated Battery Electric Vehicle (BEV) model set to be launched by Toyota at the end of 2022. The glass, known for its high solar control and heat-insulating capabilities, allows the panoramic roof to create an open cabin environment while maintaining a comfortable interior temperature. Notably, the absence of a sunshade contributes to a lighter overall vehicle body.
Strategic Energy-efficient Glass Market Market Forecast
The strategic forecast for the Energy-efficient Glass Market indicates sustained and robust growth through 2033, driven by an intensifying global commitment to sustainability and energy conservation. Future opportunities lie in the expansion of smart glass technologies, the growing demand for specialized glass in renewable energy sectors like solar, and the substantial potential within the building renovation market. The increasing adoption of energy-efficient building standards and policies worldwide will continue to be a significant catalyst. Investments in research and development for next-generation coatings and insulating glass units will further enhance product performance and market competitiveness, solidifying energy-efficient glass as an indispensable component of modern sustainable infrastructure. The market is projected to reach over $75,000 million by 2033, exhibiting a CAGR of approximately 7.0%.
Energy-efficient Glass Market Segmentation
-
1. Coating Type
- 1.1. Hard
- 1.2. Soft
-
2. Glazing Type
- 2.1. Single
- 2.2. Double
- 2.3. Triple
-
3. End-user Industry
- 3.1. Building and Construction
- 3.2. Automotive
- 3.3. Solar Panel
- 3.4. Other End-user Industries (Industrial, etc.)
Energy-efficient Glass Market Segmentation By Geography
-
1. Asia Pacific
- 1.1. China
- 1.2. India
- 1.3. Japan
- 1.4. South Korea
- 1.5. Rest of Asia Pacific
-
2. North America
- 2.1. United States
- 2.2. Canada
- 2.3. Mexico
-
3. Europe
- 3.1. Germany
- 3.2. United Kingdom
- 3.3. France
- 3.4. Italy
- 3.5. Rest of Europe
-
4. South America
- 4.1. Brazil
- 4.2. Argentina
- 4.3. Rest of South America
-
5. Middle East and Africa
- 5.1. Saudi Arabia
- 5.2. South Africa
- 5.3. Rest of Middle East and Africa
Energy-efficient Glass Market Regional Market Share
Geographic Coverage of Energy-efficient Glass Market
Energy-efficient Glass Market REPORT HIGHLIGHTS
| Aspects | Details |
|---|---|
| Study Period | 2020-2034 |
| Base Year | 2025 |
| Estimated Year | 2026 |
| Forecast Period | 2026-2034 |
| Historical Period | 2020-2025 |
| Growth Rate | CAGR of > 5.00% from 2020-2034 |
| Segmentation |
|
Table of Contents
- 1. Introduction
- 1.1. Research Scope
- 1.2. Market Segmentation
- 1.3. Research Objective
- 1.4. Definitions and Assumptions
- 2. Executive Summary
- 2.1. Market Snapshot
- 3. Market Dynamics
- 3.1. Market Drivers
- 3.2. Market Restrains
- 3.3. Market Trends
- 3.4. Market Opportunities
- 4. Market Factor Analysis
- 4.1. Porters Five Forces
- 4.1.1. Bargaining Power of Suppliers
- 4.1.2. Bargaining Power of Buyers
- 4.1.3. Threat of New Entrants
- 4.1.4. Threat of Substitutes
- 4.1.5. Competitive Rivalry
- 4.2. PESTEL analysis
- 4.3. BCG Analysis
- 4.3.1. Stars (High Growth, High Market Share)
- 4.3.2. Cash Cows (Low Growth, High Market Share)
- 4.3.3. Question Mark (High Growth, Low Market Share)
- 4.3.4. Dogs (Low Growth, Low Market Share)
- 4.4. Ansoff Matrix Analysis
- 4.5. Supply Chain Analysis
- 4.6. Regulatory Landscape
- 4.7. Current Market Potential and Opportunity Assessment (TAM–SAM–SOM Framework)
- 4.8. DMV Analyst Note
- 4.1. Porters Five Forces
- 5. Market Analysis, Insights and Forecast 2021-2033
- 5.1. Market Analysis, Insights and Forecast - by Coating Type
- 5.1.1. Hard
- 5.1.2. Soft
- 5.2. Market Analysis, Insights and Forecast - by Glazing Type
- 5.2.1. Single
- 5.2.2. Double
- 5.2.3. Triple
- 5.3. Market Analysis, Insights and Forecast - by End-user Industry
- 5.3.1. Building and Construction
- 5.3.2. Automotive
- 5.3.3. Solar Panel
- 5.3.4. Other End-user Industries (Industrial, etc.)
- 5.4. Market Analysis, Insights and Forecast - by Region
- 5.4.1. Asia Pacific
- 5.4.2. North America
- 5.4.3. Europe
- 5.4.4. South America
- 5.4.5. Middle East and Africa
- 5.1. Market Analysis, Insights and Forecast - by Coating Type
- 6. Global Energy-efficient Glass Market Analysis, Insights and Forecast, 2021-2033
- 6.1. Market Analysis, Insights and Forecast - by Coating Type
- 6.1.1. Hard
- 6.1.2. Soft
- 6.2. Market Analysis, Insights and Forecast - by Glazing Type
- 6.2.1. Single
- 6.2.2. Double
- 6.2.3. Triple
- 6.3. Market Analysis, Insights and Forecast - by End-user Industry
- 6.3.1. Building and Construction
- 6.3.2. Automotive
- 6.3.3. Solar Panel
- 6.3.4. Other End-user Industries (Industrial, etc.)
- 6.1. Market Analysis, Insights and Forecast - by Coating Type
- 7. Asia Pacific Energy-efficient Glass Market Analysis, Insights and Forecast, 2020-2032
- 7.1. Market Analysis, Insights and Forecast - by Coating Type
- 7.1.1. Hard
- 7.1.2. Soft
- 7.2. Market Analysis, Insights and Forecast - by Glazing Type
- 7.2.1. Single
- 7.2.2. Double
- 7.2.3. Triple
- 7.3. Market Analysis, Insights and Forecast - by End-user Industry
- 7.3.1. Building and Construction
- 7.3.2. Automotive
- 7.3.3. Solar Panel
- 7.3.4. Other End-user Industries (Industrial, etc.)
- 7.1. Market Analysis, Insights and Forecast - by Coating Type
- 8. North America Energy-efficient Glass Market Analysis, Insights and Forecast, 2020-2032
- 8.1. Market Analysis, Insights and Forecast - by Coating Type
- 8.1.1. Hard
- 8.1.2. Soft
- 8.2. Market Analysis, Insights and Forecast - by Glazing Type
- 8.2.1. Single
- 8.2.2. Double
- 8.2.3. Triple
- 8.3. Market Analysis, Insights and Forecast - by End-user Industry
- 8.3.1. Building and Construction
- 8.3.2. Automotive
- 8.3.3. Solar Panel
- 8.3.4. Other End-user Industries (Industrial, etc.)
- 8.1. Market Analysis, Insights and Forecast - by Coating Type
- 9. Europe Energy-efficient Glass Market Analysis, Insights and Forecast, 2020-2032
- 9.1. Market Analysis, Insights and Forecast - by Coating Type
- 9.1.1. Hard
- 9.1.2. Soft
- 9.2. Market Analysis, Insights and Forecast - by Glazing Type
- 9.2.1. Single
- 9.2.2. Double
- 9.2.3. Triple
- 9.3. Market Analysis, Insights and Forecast - by End-user Industry
- 9.3.1. Building and Construction
- 9.3.2. Automotive
- 9.3.3. Solar Panel
- 9.3.4. Other End-user Industries (Industrial, etc.)
- 9.1. Market Analysis, Insights and Forecast - by Coating Type
- 10. South America Energy-efficient Glass Market Analysis, Insights and Forecast, 2020-2032
- 10.1. Market Analysis, Insights and Forecast - by Coating Type
- 10.1.1. Hard
- 10.1.2. Soft
- 10.2. Market Analysis, Insights and Forecast - by Glazing Type
- 10.2.1. Single
- 10.2.2. Double
- 10.2.3. Triple
- 10.3. Market Analysis, Insights and Forecast - by End-user Industry
- 10.3.1. Building and Construction
- 10.3.2. Automotive
- 10.3.3. Solar Panel
- 10.3.4. Other End-user Industries (Industrial, etc.)
- 10.1. Market Analysis, Insights and Forecast - by Coating Type
- 11. Middle East and Africa Energy-efficient Glass Market Analysis, Insights and Forecast, 2020-2032
- 11.1. Market Analysis, Insights and Forecast - by Coating Type
- 11.1.1. Hard
- 11.1.2. Soft
- 11.2. Market Analysis, Insights and Forecast - by Glazing Type
- 11.2.1. Single
- 11.2.2. Double
- 11.2.3. Triple
- 11.3. Market Analysis, Insights and Forecast - by End-user Industry
- 11.3.1. Building and Construction
- 11.3.2. Automotive
- 11.3.3. Solar Panel
- 11.3.4. Other End-user Industries (Industrial, etc.)
- 11.1. Market Analysis, Insights and Forecast - by Coating Type
- 12. Competitive Analysis
- 12.1. Company Profiles
- 12.1.1 Nippon Sheet Glass Co Ltd
- 12.1.1.1. Company Overview
- 12.1.1.2. Products
- 12.1.1.3. Company Financials
- 12.1.1.4. SWOT Analysis
- 12.1.2 AGC Glass Europe
- 12.1.2.1. Company Overview
- 12.1.2.2. Products
- 12.1.2.3. Company Financials
- 12.1.2.4. SWOT Analysis
- 12.1.3 Şişecam
- 12.1.3.1. Company Overview
- 12.1.3.2. Products
- 12.1.3.3. Company Financials
- 12.1.3.4. SWOT Analysis
- 12.1.4 Vitro*List Not Exhaustive
- 12.1.4.1. Company Overview
- 12.1.4.2. Products
- 12.1.4.3. Company Financials
- 12.1.4.4. SWOT Analysis
- 12.1.5 Saint-Gobain
- 12.1.5.1. Company Overview
- 12.1.5.2. Products
- 12.1.5.3. Company Financials
- 12.1.5.4. SWOT Analysis
- 12.1.6 Morley Glass & Glazing Ltd
- 12.1.6.1. Company Overview
- 12.1.6.2. Products
- 12.1.6.3. Company Financials
- 12.1.6.4. SWOT Analysis
- 12.1.7 Tuffx Glass
- 12.1.7.1. Company Overview
- 12.1.7.2. Products
- 12.1.7.3. Company Financials
- 12.1.7.4. SWOT Analysis
- 12.1.8 Cardinal Glass Industries Inc
- 12.1.8.1. Company Overview
- 12.1.8.2. Products
- 12.1.8.3. Company Financials
- 12.1.8.4. SWOT Analysis
- 12.1.9 Abrisa Technologies
- 12.1.9.1. Company Overview
- 12.1.9.2. Products
- 12.1.9.3. Company Financials
- 12.1.9.4. SWOT Analysis
- 12.1.10 SCHOTT AG
- 12.1.10.1. Company Overview
- 12.1.10.2. Products
- 12.1.10.3. Company Financials
- 12.1.10.4. SWOT Analysis
- 12.1.11 Guardian Industries Holdings
- 12.1.11.1. Company Overview
- 12.1.11.2. Products
- 12.1.11.3. Company Financials
- 12.1.11.4. SWOT Analysis
- 12.1.12 Central Glass Co Ltd
- 12.1.12.1. Company Overview
- 12.1.12.2. Products
- 12.1.12.3. Company Financials
- 12.1.12.4. SWOT Analysis
- 12.1.1 Nippon Sheet Glass Co Ltd
- 12.2. Market Entropy
- 12.2.1 Company's Key Areas Served
- 12.2.2 Recent Developments
- 12.3. Company Market Share Analysis 2025
- 12.3.1 Top 5 Companies Market Share Analysis
- 12.3.2 Top 3 Companies Market Share Analysis
- 12.4. List of Potential Customers
- 13. Research Methodology
List of Figures
- Figure 1: Global Energy-efficient Glass Market Revenue Breakdown (Million, %) by Region 2025 & 2033
- Figure 2: Global Energy-efficient Glass Market Volume Breakdown (Kiloton, %) by Region 2025 & 2033
- Figure 3: Asia Pacific Energy-efficient Glass Market Revenue (Million), by Coating Type 2025 & 2033
- Figure 4: Asia Pacific Energy-efficient Glass Market Volume (Kiloton), by Coating Type 2025 & 2033
- Figure 5: Asia Pacific Energy-efficient Glass Market Revenue Share (%), by Coating Type 2025 & 2033
- Figure 6: Asia Pacific Energy-efficient Glass Market Volume Share (%), by Coating Type 2025 & 2033
- Figure 7: Asia Pacific Energy-efficient Glass Market Revenue (Million), by Glazing Type 2025 & 2033
- Figure 8: Asia Pacific Energy-efficient Glass Market Volume (Kiloton), by Glazing Type 2025 & 2033
- Figure 9: Asia Pacific Energy-efficient Glass Market Revenue Share (%), by Glazing Type 2025 & 2033
- Figure 10: Asia Pacific Energy-efficient Glass Market Volume Share (%), by Glazing Type 2025 & 2033
- Figure 11: Asia Pacific Energy-efficient Glass Market Revenue (Million), by End-user Industry 2025 & 2033
- Figure 12: Asia Pacific Energy-efficient Glass Market Volume (Kiloton), by End-user Industry 2025 & 2033
- Figure 13: Asia Pacific Energy-efficient Glass Market Revenue Share (%), by End-user Industry 2025 & 2033
- Figure 14: Asia Pacific Energy-efficient Glass Market Volume Share (%), by End-user Industry 2025 & 2033
- Figure 15: Asia Pacific Energy-efficient Glass Market Revenue (Million), by Country 2025 & 2033
- Figure 16: Asia Pacific Energy-efficient Glass Market Volume (Kiloton), by Country 2025 & 2033
- Figure 17: Asia Pacific Energy-efficient Glass Market Revenue Share (%), by Country 2025 & 2033
- Figure 18: Asia Pacific Energy-efficient Glass Market Volume Share (%), by Country 2025 & 2033
- Figure 19: North America Energy-efficient Glass Market Revenue (Million), by Coating Type 2025 & 2033
- Figure 20: North America Energy-efficient Glass Market Volume (Kiloton), by Coating Type 2025 & 2033
- Figure 21: North America Energy-efficient Glass Market Revenue Share (%), by Coating Type 2025 & 2033
- Figure 22: North America Energy-efficient Glass Market Volume Share (%), by Coating Type 2025 & 2033
- Figure 23: North America Energy-efficient Glass Market Revenue (Million), by Glazing Type 2025 & 2033
- Figure 24: North America Energy-efficient Glass Market Volume (Kiloton), by Glazing Type 2025 & 2033
- Figure 25: North America Energy-efficient Glass Market Revenue Share (%), by Glazing Type 2025 & 2033
- Figure 26: North America Energy-efficient Glass Market Volume Share (%), by Glazing Type 2025 & 2033
- Figure 27: North America Energy-efficient Glass Market Revenue (Million), by End-user Industry 2025 & 2033
- Figure 28: North America Energy-efficient Glass Market Volume (Kiloton), by End-user Industry 2025 & 2033
- Figure 29: North America Energy-efficient Glass Market Revenue Share (%), by End-user Industry 2025 & 2033
- Figure 30: North America Energy-efficient Glass Market Volume Share (%), by End-user Industry 2025 & 2033
- Figure 31: North America Energy-efficient Glass Market Revenue (Million), by Country 2025 & 2033
- Figure 32: North America Energy-efficient Glass Market Volume (Kiloton), by Country 2025 & 2033
- Figure 33: North America Energy-efficient Glass Market Revenue Share (%), by Country 2025 & 2033
- Figure 34: North America Energy-efficient Glass Market Volume Share (%), by Country 2025 & 2033
- Figure 35: Europe Energy-efficient Glass Market Revenue (Million), by Coating Type 2025 & 2033
- Figure 36: Europe Energy-efficient Glass Market Volume (Kiloton), by Coating Type 2025 & 2033
- Figure 37: Europe Energy-efficient Glass Market Revenue Share (%), by Coating Type 2025 & 2033
- Figure 38: Europe Energy-efficient Glass Market Volume Share (%), by Coating Type 2025 & 2033
- Figure 39: Europe Energy-efficient Glass Market Revenue (Million), by Glazing Type 2025 & 2033
- Figure 40: Europe Energy-efficient Glass Market Volume (Kiloton), by Glazing Type 2025 & 2033
- Figure 41: Europe Energy-efficient Glass Market Revenue Share (%), by Glazing Type 2025 & 2033
- Figure 42: Europe Energy-efficient Glass Market Volume Share (%), by Glazing Type 2025 & 2033
- Figure 43: Europe Energy-efficient Glass Market Revenue (Million), by End-user Industry 2025 & 2033
- Figure 44: Europe Energy-efficient Glass Market Volume (Kiloton), by End-user Industry 2025 & 2033
- Figure 45: Europe Energy-efficient Glass Market Revenue Share (%), by End-user Industry 2025 & 2033
- Figure 46: Europe Energy-efficient Glass Market Volume Share (%), by End-user Industry 2025 & 2033
- Figure 47: Europe Energy-efficient Glass Market Revenue (Million), by Country 2025 & 2033
- Figure 48: Europe Energy-efficient Glass Market Volume (Kiloton), by Country 2025 & 2033
- Figure 49: Europe Energy-efficient Glass Market Revenue Share (%), by Country 2025 & 2033
- Figure 50: Europe Energy-efficient Glass Market Volume Share (%), by Country 2025 & 2033
- Figure 51: South America Energy-efficient Glass Market Revenue (Million), by Coating Type 2025 & 2033
- Figure 52: South America Energy-efficient Glass Market Volume (Kiloton), by Coating Type 2025 & 2033
- Figure 53: South America Energy-efficient Glass Market Revenue Share (%), by Coating Type 2025 & 2033
- Figure 54: South America Energy-efficient Glass Market Volume Share (%), by Coating Type 2025 & 2033
- Figure 55: South America Energy-efficient Glass Market Revenue (Million), by Glazing Type 2025 & 2033
- Figure 56: South America Energy-efficient Glass Market Volume (Kiloton), by Glazing Type 2025 & 2033
- Figure 57: South America Energy-efficient Glass Market Revenue Share (%), by Glazing Type 2025 & 2033
- Figure 58: South America Energy-efficient Glass Market Volume Share (%), by Glazing Type 2025 & 2033
- Figure 59: South America Energy-efficient Glass Market Revenue (Million), by End-user Industry 2025 & 2033
- Figure 60: South America Energy-efficient Glass Market Volume (Kiloton), by End-user Industry 2025 & 2033
- Figure 61: South America Energy-efficient Glass Market Revenue Share (%), by End-user Industry 2025 & 2033
- Figure 62: South America Energy-efficient Glass Market Volume Share (%), by End-user Industry 2025 & 2033
- Figure 63: South America Energy-efficient Glass Market Revenue (Million), by Country 2025 & 2033
- Figure 64: South America Energy-efficient Glass Market Volume (Kiloton), by Country 2025 & 2033
- Figure 65: South America Energy-efficient Glass Market Revenue Share (%), by Country 2025 & 2033
- Figure 66: South America Energy-efficient Glass Market Volume Share (%), by Country 2025 & 2033
- Figure 67: Middle East and Africa Energy-efficient Glass Market Revenue (Million), by Coating Type 2025 & 2033
- Figure 68: Middle East and Africa Energy-efficient Glass Market Volume (Kiloton), by Coating Type 2025 & 2033
- Figure 69: Middle East and Africa Energy-efficient Glass Market Revenue Share (%), by Coating Type 2025 & 2033
- Figure 70: Middle East and Africa Energy-efficient Glass Market Volume Share (%), by Coating Type 2025 & 2033
- Figure 71: Middle East and Africa Energy-efficient Glass Market Revenue (Million), by Glazing Type 2025 & 2033
- Figure 72: Middle East and Africa Energy-efficient Glass Market Volume (Kiloton), by Glazing Type 2025 & 2033
- Figure 73: Middle East and Africa Energy-efficient Glass Market Revenue Share (%), by Glazing Type 2025 & 2033
- Figure 74: Middle East and Africa Energy-efficient Glass Market Volume Share (%), by Glazing Type 2025 & 2033
- Figure 75: Middle East and Africa Energy-efficient Glass Market Revenue (Million), by End-user Industry 2025 & 2033
- Figure 76: Middle East and Africa Energy-efficient Glass Market Volume (Kiloton), by End-user Industry 2025 & 2033
- Figure 77: Middle East and Africa Energy-efficient Glass Market Revenue Share (%), by End-user Industry 2025 & 2033
- Figure 78: Middle East and Africa Energy-efficient Glass Market Volume Share (%), by End-user Industry 2025 & 2033
- Figure 79: Middle East and Africa Energy-efficient Glass Market Revenue (Million), by Country 2025 & 2033
- Figure 80: Middle East and Africa Energy-efficient Glass Market Volume (Kiloton), by Country 2025 & 2033
- Figure 81: Middle East and Africa Energy-efficient Glass Market Revenue Share (%), by Country 2025 & 2033
- Figure 82: Middle East and Africa Energy-efficient Glass Market Volume Share (%), by Country 2025 & 2033
List of Tables
- Table 1: Global Energy-efficient Glass Market Revenue Million Forecast, by Coating Type 2020 & 2033
- Table 2: Global Energy-efficient Glass Market Volume Kiloton Forecast, by Coating Type 2020 & 2033
- Table 3: Global Energy-efficient Glass Market Revenue Million Forecast, by Glazing Type 2020 & 2033
- Table 4: Global Energy-efficient Glass Market Volume Kiloton Forecast, by Glazing Type 2020 & 2033
- Table 5: Global Energy-efficient Glass Market Revenue Million Forecast, by End-user Industry 2020 & 2033
- Table 6: Global Energy-efficient Glass Market Volume Kiloton Forecast, by End-user Industry 2020 & 2033
- Table 7: Global Energy-efficient Glass Market Revenue Million Forecast, by Region 2020 & 2033
- Table 8: Global Energy-efficient Glass Market Volume Kiloton Forecast, by Region 2020 & 2033
- Table 9: Global Energy-efficient Glass Market Revenue Million Forecast, by Coating Type 2020 & 2033
- Table 10: Global Energy-efficient Glass Market Volume Kiloton Forecast, by Coating Type 2020 & 2033
- Table 11: Global Energy-efficient Glass Market Revenue Million Forecast, by Glazing Type 2020 & 2033
- Table 12: Global Energy-efficient Glass Market Volume Kiloton Forecast, by Glazing Type 2020 & 2033
- Table 13: Global Energy-efficient Glass Market Revenue Million Forecast, by End-user Industry 2020 & 2033
- Table 14: Global Energy-efficient Glass Market Volume Kiloton Forecast, by End-user Industry 2020 & 2033
- Table 15: Global Energy-efficient Glass Market Revenue Million Forecast, by Country 2020 & 2033
- Table 16: Global Energy-efficient Glass Market Volume Kiloton Forecast, by Country 2020 & 2033
- Table 17: China Energy-efficient Glass Market Revenue (Million) Forecast, by Application 2020 & 2033
- Table 18: China Energy-efficient Glass Market Volume (Kiloton) Forecast, by Application 2020 & 2033
- Table 19: India Energy-efficient Glass Market Revenue (Million) Forecast, by Application 2020 & 2033
- Table 20: India Energy-efficient Glass Market Volume (Kiloton) Forecast, by Application 2020 & 2033
- Table 21: Japan Energy-efficient Glass Market Revenue (Million) Forecast, by Application 2020 & 2033
- Table 22: Japan Energy-efficient Glass Market Volume (Kiloton) Forecast, by Application 2020 & 2033
- Table 23: South Korea Energy-efficient Glass Market Revenue (Million) Forecast, by Application 2020 & 2033
- Table 24: South Korea Energy-efficient Glass Market Volume (Kiloton) Forecast, by Application 2020 & 2033
- Table 25: Rest of Asia Pacific Energy-efficient Glass Market Revenue (Million) Forecast, by Application 2020 & 2033
- Table 26: Rest of Asia Pacific Energy-efficient Glass Market Volume (Kiloton) Forecast, by Application 2020 & 2033
- Table 27: Global Energy-efficient Glass Market Revenue Million Forecast, by Coating Type 2020 & 2033
- Table 28: Global Energy-efficient Glass Market Volume Kiloton Forecast, by Coating Type 2020 & 2033
- Table 29: Global Energy-efficient Glass Market Revenue Million Forecast, by Glazing Type 2020 & 2033
- Table 30: Global Energy-efficient Glass Market Volume Kiloton Forecast, by Glazing Type 2020 & 2033
- Table 31: Global Energy-efficient Glass Market Revenue Million Forecast, by End-user Industry 2020 & 2033
- Table 32: Global Energy-efficient Glass Market Volume Kiloton Forecast, by End-user Industry 2020 & 2033
- Table 33: Global Energy-efficient Glass Market Revenue Million Forecast, by Country 2020 & 2033
- Table 34: Global Energy-efficient Glass Market Volume Kiloton Forecast, by Country 2020 & 2033
- Table 35: United States Energy-efficient Glass Market Revenue (Million) Forecast, by Application 2020 & 2033
- Table 36: United States Energy-efficient Glass Market Volume (Kiloton) Forecast, by Application 2020 & 2033
- Table 37: Canada Energy-efficient Glass Market Revenue (Million) Forecast, by Application 2020 & 2033
- Table 38: Canada Energy-efficient Glass Market Volume (Kiloton) Forecast, by Application 2020 & 2033
- Table 39: Mexico Energy-efficient Glass Market Revenue (Million) Forecast, by Application 2020 & 2033
- Table 40: Mexico Energy-efficient Glass Market Volume (Kiloton) Forecast, by Application 2020 & 2033
- Table 41: Global Energy-efficient Glass Market Revenue Million Forecast, by Coating Type 2020 & 2033
- Table 42: Global Energy-efficient Glass Market Volume Kiloton Forecast, by Coating Type 2020 & 2033
- Table 43: Global Energy-efficient Glass Market Revenue Million Forecast, by Glazing Type 2020 & 2033
- Table 44: Global Energy-efficient Glass Market Volume Kiloton Forecast, by Glazing Type 2020 & 2033
- Table 45: Global Energy-efficient Glass Market Revenue Million Forecast, by End-user Industry 2020 & 2033
- Table 46: Global Energy-efficient Glass Market Volume Kiloton Forecast, by End-user Industry 2020 & 2033
- Table 47: Global Energy-efficient Glass Market Revenue Million Forecast, by Country 2020 & 2033
- Table 48: Global Energy-efficient Glass Market Volume Kiloton Forecast, by Country 2020 & 2033
- Table 49: Germany Energy-efficient Glass Market Revenue (Million) Forecast, by Application 2020 & 2033
- Table 50: Germany Energy-efficient Glass Market Volume (Kiloton) Forecast, by Application 2020 & 2033
- Table 51: United Kingdom Energy-efficient Glass Market Revenue (Million) Forecast, by Application 2020 & 2033
- Table 52: United Kingdom Energy-efficient Glass Market Volume (Kiloton) Forecast, by Application 2020 & 2033
- Table 53: France Energy-efficient Glass Market Revenue (Million) Forecast, by Application 2020 & 2033
- Table 54: France Energy-efficient Glass Market Volume (Kiloton) Forecast, by Application 2020 & 2033
- Table 55: Italy Energy-efficient Glass Market Revenue (Million) Forecast, by Application 2020 & 2033
- Table 56: Italy Energy-efficient Glass Market Volume (Kiloton) Forecast, by Application 2020 & 2033
- Table 57: Rest of Europe Energy-efficient Glass Market Revenue (Million) Forecast, by Application 2020 & 2033
- Table 58: Rest of Europe Energy-efficient Glass Market Volume (Kiloton) Forecast, by Application 2020 & 2033
- Table 59: Global Energy-efficient Glass Market Revenue Million Forecast, by Coating Type 2020 & 2033
- Table 60: Global Energy-efficient Glass Market Volume Kiloton Forecast, by Coating Type 2020 & 2033
- Table 61: Global Energy-efficient Glass Market Revenue Million Forecast, by Glazing Type 2020 & 2033
- Table 62: Global Energy-efficient Glass Market Volume Kiloton Forecast, by Glazing Type 2020 & 2033
- Table 63: Global Energy-efficient Glass Market Revenue Million Forecast, by End-user Industry 2020 & 2033
- Table 64: Global Energy-efficient Glass Market Volume Kiloton Forecast, by End-user Industry 2020 & 2033
- Table 65: Global Energy-efficient Glass Market Revenue Million Forecast, by Country 2020 & 2033
- Table 66: Global Energy-efficient Glass Market Volume Kiloton Forecast, by Country 2020 & 2033
- Table 67: Brazil Energy-efficient Glass Market Revenue (Million) Forecast, by Application 2020 & 2033
- Table 68: Brazil Energy-efficient Glass Market Volume (Kiloton) Forecast, by Application 2020 & 2033
- Table 69: Argentina Energy-efficient Glass Market Revenue (Million) Forecast, by Application 2020 & 2033
- Table 70: Argentina Energy-efficient Glass Market Volume (Kiloton) Forecast, by Application 2020 & 2033
- Table 71: Rest of South America Energy-efficient Glass Market Revenue (Million) Forecast, by Application 2020 & 2033
- Table 72: Rest of South America Energy-efficient Glass Market Volume (Kiloton) Forecast, by Application 2020 & 2033
- Table 73: Global Energy-efficient Glass Market Revenue Million Forecast, by Coating Type 2020 & 2033
- Table 74: Global Energy-efficient Glass Market Volume Kiloton Forecast, by Coating Type 2020 & 2033
- Table 75: Global Energy-efficient Glass Market Revenue Million Forecast, by Glazing Type 2020 & 2033
- Table 76: Global Energy-efficient Glass Market Volume Kiloton Forecast, by Glazing Type 2020 & 2033
- Table 77: Global Energy-efficient Glass Market Revenue Million Forecast, by End-user Industry 2020 & 2033
- Table 78: Global Energy-efficient Glass Market Volume Kiloton Forecast, by End-user Industry 2020 & 2033
- Table 79: Global Energy-efficient Glass Market Revenue Million Forecast, by Country 2020 & 2033
- Table 80: Global Energy-efficient Glass Market Volume Kiloton Forecast, by Country 2020 & 2033
- Table 81: Saudi Arabia Energy-efficient Glass Market Revenue (Million) Forecast, by Application 2020 & 2033
- Table 82: Saudi Arabia Energy-efficient Glass Market Volume (Kiloton) Forecast, by Application 2020 & 2033
- Table 83: South Africa Energy-efficient Glass Market Revenue (Million) Forecast, by Application 2020 & 2033
- Table 84: South Africa Energy-efficient Glass Market Volume (Kiloton) Forecast, by Application 2020 & 2033
- Table 85: Rest of Middle East and Africa Energy-efficient Glass Market Revenue (Million) Forecast, by Application 2020 & 2033
- Table 86: Rest of Middle East and Africa Energy-efficient Glass Market Volume (Kiloton) Forecast, by Application 2020 & 2033
Frequently Asked Questions
1. What is the projected Compound Annual Growth Rate (CAGR) of the Energy-efficient Glass Market?
The projected CAGR is approximately > 5.00%.
2. Which companies are prominent players in the Energy-efficient Glass Market?
Key companies in the market include Nippon Sheet Glass Co Ltd, AGC Glass Europe, Şişecam, Vitro*List Not Exhaustive, Saint-Gobain, Morley Glass & Glazing Ltd, Tuffx Glass, Cardinal Glass Industries Inc, Abrisa Technologies, SCHOTT AG, Guardian Industries Holdings, Central Glass Co Ltd.
3. What are the main segments of the Energy-efficient Glass Market?
The market segments include Coating Type, Glazing Type, End-user Industry.
4. Can you provide details about the market size?
The market size is estimated to be USD 31.79 Million as of 2022.
5. What are some drivers contributing to market growth?
Increasing Application in the Building and Construction Sector; Growing Concern about High Carbon Emissions; Other Drivers.
6. What are the notable trends driving market growth?
Growing Demand from the Building and Construction Sector.
7. Are there any restraints impacting market growth?
High Price Bar of Energy-efficient Glass; Other Restraints.
8. Can you provide examples of recent developments in the market?
August 2022: NSG Group unveiled its expansion plan for TCO (transparent conductive oxide) coated glass production in Malaysia. The initiative involves the installation of a new float line at the Johor Bahru facility of Malaysian Sheet Glass SDN BHD, a member of the NSG Group. This expansion will incorporate online coating capacity and is set to commence TCO glass production for solar panel manufacturers by the close of 2024.
9. What pricing options are available for accessing the report?
Pricing options include single-user, multi-user, and enterprise licenses priced at USD 4750, USD 5250, and USD 8750 respectively.
10. Is the market size provided in terms of value or volume?
The market size is provided in terms of value, measured in Million and volume, measured in Kiloton.
11. Are there any specific market keywords associated with the report?
Yes, the market keyword associated with the report is "Energy-efficient Glass Market," which aids in identifying and referencing the specific market segment covered.
12. How do I determine which pricing option suits my needs best?
The pricing options vary based on user requirements and access needs. Individual users may opt for single-user licenses, while businesses requiring broader access may choose multi-user or enterprise licenses for cost-effective access to the report.
13. Are there any additional resources or data provided in the Energy-efficient Glass Market report?
While the report offers comprehensive insights, it's advisable to review the specific contents or supplementary materials provided to ascertain if additional resources or data are available.
14. How can I stay updated on further developments or reports in the Energy-efficient Glass Market?
To stay informed about further developments, trends, and reports in the Energy-efficient Glass Market, consider subscribing to industry newsletters, following relevant companies and organizations, or regularly checking reputable industry news sources and publications.
Methodology
Step 1 - Identification of Relevant Samples Size from Population Database


Step 2 - Approaches for Defining Global Market Size (Value, Volume* & Price*)

Note*: In applicable scenarios
Step 3 - Data Sources
Primary Research
- Web Analytics
- Survey Reports
- Research Institute
- Latest Research Reports
- Opinion Leaders
Secondary Research
- Annual Reports
- White Paper
- Latest Press Release
- Industry Association
- Paid Database
- Investor Presentations

Step 4 - Data Triangulation
Involves using different sources of information in order to increase the validity of a study
These sources are likely to be stakeholders in a program - participants, other researchers, program staff, other community members, and so on.
Then we put all data in single framework & apply various statistical tools to find out the dynamic on the market.
During the analysis stage, feedback from the stakeholder groups would be compared to determine areas of agreement as well as areas of divergence