

Key Insights
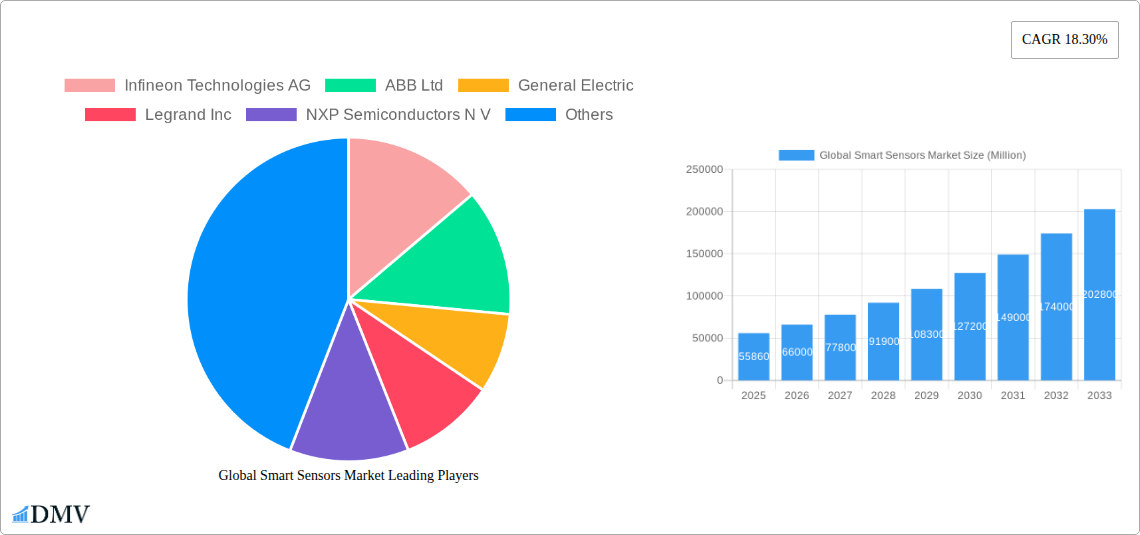
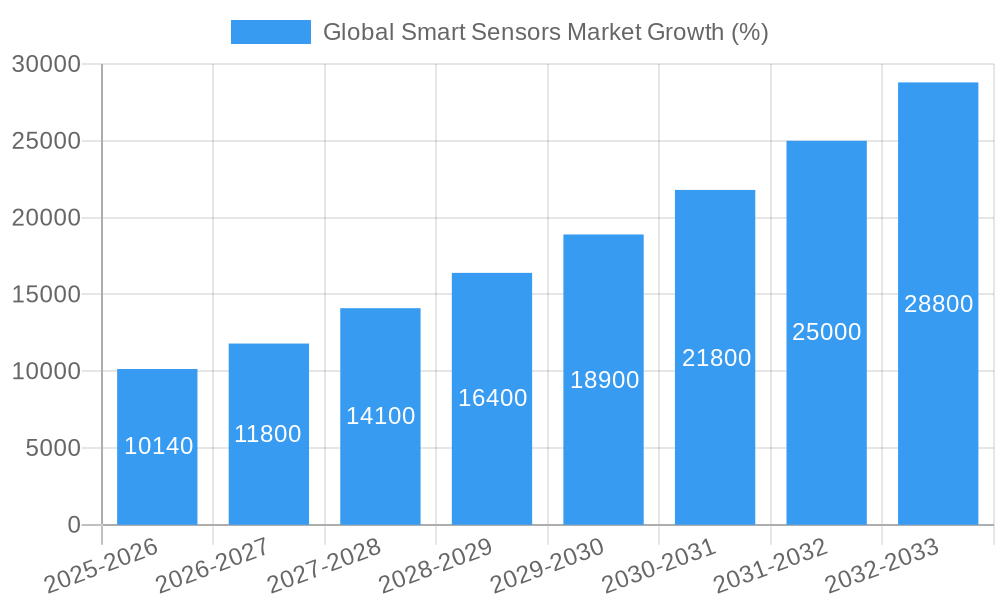
The global smart sensor market is experiencing robust growth, projected to reach a significant market size driven by increasing demand across diverse sectors. The market's Compound Annual Growth Rate (CAGR) of 18.30% from 2019 to 2024 indicates a strong upward trajectory, with continued expansion expected through 2033. This growth is fueled by several key factors: the proliferation of IoT devices necessitating sophisticated sensing capabilities, advancements in sensor technology leading to improved accuracy, miniaturization, and lower power consumption, and the increasing adoption of smart sensors in automotive, healthcare, industrial automation, and building automation applications. The market is segmented by sensor type (flow, humidity, position, pressure, temperature, and others), technology (MEMS, CMOS, optical spectroscopy, and others), component (ADC, DAC, amplifier, and others), and application. The automotive and transportation segment is a major driver, with the increasing integration of advanced driver-assistance systems (ADAS) and autonomous driving features fueling demand for sophisticated sensors. Similarly, the healthcare sector's adoption of smart sensors for remote patient monitoring and diagnostic tools is significantly contributing to market growth. Competition within the market is fierce, with major players like Infineon, ABB, GE, and others vying for market share through innovation and strategic partnerships.
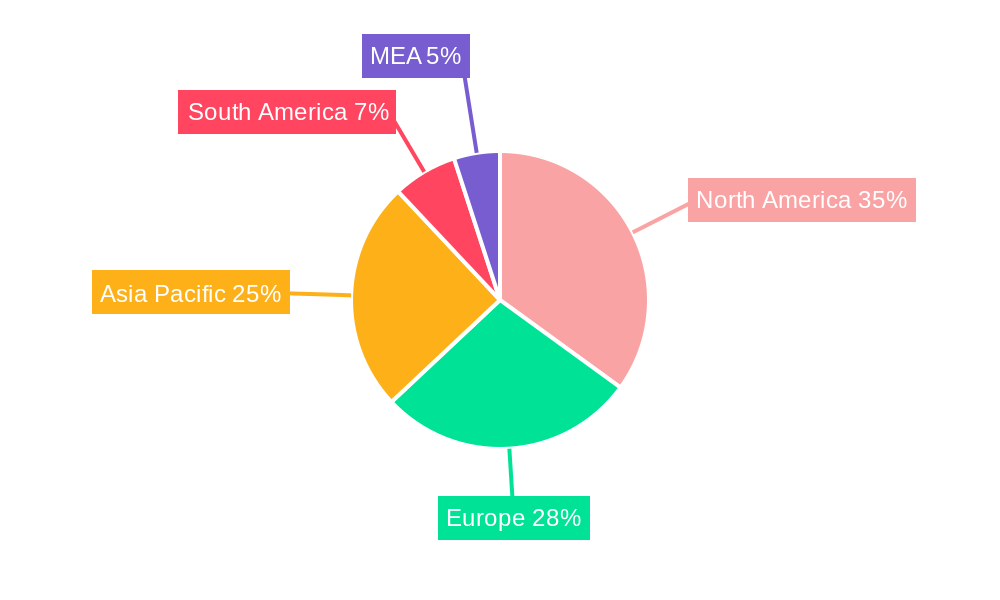
Geographic distribution of the market reveals substantial growth across North America, Europe, and the Asia-Pacific region, with these regions dominating market share due to early adoption of smart technologies and well-established infrastructure. However, emerging economies in regions like South America and the Middle East and Africa are expected to witness significant growth in the coming years, driven by increasing industrialization and rising disposable incomes. Future market growth will hinge on ongoing technological advancements, particularly in areas like artificial intelligence and machine learning, which enable smarter data analysis and decision-making from sensor data. The development of more energy-efficient and cost-effective smart sensors will also play a crucial role in expanding market penetration across various industries and geographies. Overcoming challenges related to data security and privacy in IoT applications will be paramount to ensuring sustained and responsible market growth.
Global Smart Sensors Market: A Comprehensive Report (2019-2033)
This insightful report provides a detailed analysis of the global smart sensors market, encompassing market size, growth trajectories, technological advancements, key players, and future opportunities. The study period covers 2019-2033, with 2025 serving as the base and estimated year. The report forecasts market trends from 2025-2033, leveraging data from the historical period of 2019-2024. The market is expected to reach xx Million by 2033, exhibiting a CAGR of xx%. This report is indispensable for stakeholders seeking a deep understanding of this dynamic market landscape.
Global Smart Sensors Market Composition & Trends
This section delves into the intricate dynamics of the global smart sensors market, offering a comprehensive overview of market concentration, innovation drivers, regulatory influences, substitute products, end-user profiles, and merger & acquisition (M&A) activities. We analyze the market share distribution across key players such as Infineon Technologies AG, ABB Ltd, General Electric, Legrand Inc, NXP Semiconductors N.V., Siemens AG, Honeywell International, TE Connectivity Ltd, STMicroelectronics, Analog Devices Inc, Vishay Technology Inc, and Eaton Corporation. The report further examines the impact of M&A activities, analyzing deal values and their influence on market consolidation and technological advancements.
- Market Concentration: The market demonstrates a [High/Medium/Low] level of concentration, with the top 5 players holding approximately xx% market share in 2024.
- Innovation Catalysts: Significant investments in R&D, particularly in areas like MEMS and CMOS technologies, are driving product innovation and market expansion.
- Regulatory Landscape: Government regulations concerning safety and data privacy significantly influence market growth, particularly in sectors like automotive and healthcare.
- Substitute Products: The emergence of alternative technologies poses a moderate threat to traditional smart sensor solutions.
- End-User Profiles: Automotive, Industrial Automation, and Healthcare are identified as major end-user segments.
- M&A Activities: A total of xx M&A deals were recorded between 2019 and 2024, with a combined value of approximately xx Million. These deals demonstrate a growing trend of consolidation and strategic partnerships within the industry.
Global Smart Sensors Market Industry Evolution
This section meticulously traces the evolution of the global smart sensors market, analyzing growth trajectories, technological breakthroughs, and evolving consumer demands. We delve into the impact of technological advancements such as MEMS, CMOS, and Optical Spectroscopy on market growth and product diversification. We also examine the influence of shifting consumer preferences towards miniaturization, improved accuracy, and enhanced connectivity on market trends. Data points like specific growth rates and adoption metrics for different sensor types (e.g., pressure sensors, temperature sensors) and technologies are presented to provide a clear picture of market dynamics. The market witnessed a growth rate of xx% between 2019 and 2024 and is projected to maintain a robust growth trajectory in the forecast period.
Leading Regions, Countries, or Segments in Global Smart Sensors Market
This section identifies the dominant regions, countries, or segments within the global smart sensors market, focusing on various categories like sensor type, technology, component, and application. The analysis is driven by a comprehensive examination of market drivers including investment patterns, regulatory incentives, and technological infrastructure.
Key Drivers:
- High Investment in R&D: Significant investments in research and development are fueling innovation and improving sensor performance, leading to broader market adoption.
- Government Support and Regulations: Favorable government policies and regulations promote the development and deployment of smart sensors across various sectors.
- Technological Advancements: Continuous advancements in MEMS, CMOS, and other technologies are reducing the cost and size of sensors, making them accessible to a wider range of applications.
Dominant Segments:
- By Type: Pressure sensors currently dominate the market, driven by robust demand from industrial automation and automotive sectors. The temperature sensor segment is also showing significant growth potential.
- By Technology: MEMS technology continues to hold a significant share, due to its cost-effectiveness and miniaturization capabilities. CMOS technology is gaining traction due to its integration capabilities.
- By Component: Analog-to-Digital Converters (ADCs) and Digital-to-Analog Converters (DACs) are core components driving market demand.
- By Application: The automotive sector represents the largest application segment due to increasing adoption of advanced driver-assistance systems (ADAS) and autonomous driving technologies. The industrial automation sector is experiencing significant growth.
Global Smart Sensors Market Product Innovations
Recent years have witnessed a surge in smart sensor product innovations, driven by the demand for enhanced performance, miniaturization, and integration capabilities. New product lines feature improved accuracy, faster response times, and greater energy efficiency. Companies are actively developing smart sensors with advanced features like wireless connectivity, self-calibration, and embedded intelligence, further expanding their applications across diverse industries.
Propelling Factors for Global Smart Sensors Market Growth
Several factors contribute to the growth of the global smart sensors market. Technological advancements, such as the development of miniature sensors with increased sensitivity and accuracy, are a significant driver. Economic factors, including increasing investments in automation and Industry 4.0 initiatives, are also fueling market growth. Favorable government policies and regulations promote the adoption of smart sensors across various sectors.
Obstacles in the Global Smart Sensors Market
Despite strong growth potential, the smart sensor market faces challenges. Regulatory hurdles, particularly those related to data security and privacy, can hinder market expansion. Supply chain disruptions and the escalating cost of raw materials pose significant risks. Intense competition among established players and new entrants further adds to the complexity of the market.
Future Opportunities in Global Smart Sensors Market
Future opportunities abound in the global smart sensors market. Emerging applications in the Internet of Things (IoT), smart cities, and precision agriculture are expected to drive strong market demand. The development of new sensor technologies, like bio-sensors and flexible sensors, opens new avenues for growth. The increasing demand for personalized healthcare and improved environmental monitoring also presents significant opportunities for smart sensor manufacturers.
Major Players in the Global Smart Sensors Market Ecosystem
- Infineon Technologies AG
- ABB Ltd
- General Electric
- Legrand Inc
- NXP Semiconductors N.V.
- Siemens AG
- Honeywell International
- TE Connectivity Ltd
- STMicroelectronics
- Analog Devices Inc
- Vishay Technology Inc
- Eaton Corporation
Key Developments in Global Smart Sensors Market Industry
- October 2022: Optomotive launched two new product lines of 3D high-speed smart sensors at VISION 2022, offering customizable and user-programmable solutions with inspection rates up to 10 kHz. This signifies significant advancement in high-performance 3D sensing technology.
- November 2022: Quanergy Systems, Inc. enhanced its QORTEX DTC and Q-View software solutions supporting its MQ-8 family of LiDAR sensors, improving the functionality and performance of its Flow Management portfolio. This development showcases improvements in software and LiDAR sensor integration.
Strategic Global Smart Sensors Market Forecast
The global smart sensors market is poised for significant growth driven by the convergence of technological innovation, increasing automation across industries, and supportive government regulations. The expansion into new applications, coupled with continuous improvements in sensor technology, will contribute to a substantial market expansion in the coming years. The market's future potential is vast, with opportunities across diverse sectors creating substantial value for stakeholders.
Global Smart Sensors Market Segmentation
-
1. Type
- 1.1. Flow Sensor
- 1.2. Humidity Sensor
- 1.3. Position Sensor
- 1.4. Pressure Sensor
- 1.5. Temperature Sensor
- 1.6. Other Types
-
2. Technology
- 2.1. MEMS
- 2.2. CMOS
- 2.3. Optical Spectroscopy
- 2.4. Other Technologies
-
3. Component
- 3.1. Analog-to-Digital Converter
- 3.2. Digital-to-Analog Converter
- 3.3. Amplifier
- 3.4. Other components
-
4. Application
- 4.1. Aerospace and Defense
- 4.2. Automotive and Transportation
- 4.3. Healthcare
- 4.4. Industrial Automation
- 4.5. Building Automation
- 4.6. Consumer Electronics
- 4.7. Other Applications
Global Smart Sensors Market Segmentation By Geography
-
1. North America
- 1.1. United States
- 1.2. Canada
-
2. Europe
- 2.1. United Kingdom
- 2.2. Germany
- 2.3. France
- 2.4. Rest of Europe
-
3. Asia Pacific
- 3.1. China
- 3.2. India
- 3.3. Japan
- 3.4. Rest Asia Pacific
- 4. Latin America
- 5. Middle East and Africa
Global Smart Sensors Market REPORT HIGHLIGHTS
| Aspects | Details |
|---|---|
| Study Period | 2019-2033 |
| Base Year | 2024 |
| Estimated Year | 2025 |
| Forecast Period | 2025-2033 |
| Historical Period | 2019-2024 |
| Growth Rate | CAGR of 18.30% from 2019-2033 |
| Segmentation |
|
Table of Contents
- 1. Introduction
- 1.1. Research Scope
- 1.2. Market Segmentation
- 1.3. Research Methodology
- 1.4. Definitions and Assumptions
- 2. Executive Summary
- 2.1. Introduction
- 3. Market Dynamics
- 3.1. Introduction
- 3.2. Market Drivers
- 3.2.1. Growing Demand for Energy Efficiency and Saving; Increasing Demand for Consumer Electronics Products; Higher Demand for Smart Sensors in the Healthcare and Automotive Industries; Technology Advancements in Miniaturization and Wireless Capabilities
- 3.3. Market Restrains
- 3.3.1. Relatively High Deployment Costs; Complex Design compared to Traditional Sensors
- 3.4. Market Trends
- 3.4.1. Temperature Sensors to Witness High Growth
- 4. Market Factor Analysis
- 4.1. Porters Five Forces
- 4.2. Supply/Value Chain
- 4.3. PESTEL analysis
- 4.4. Market Entropy
- 4.5. Patent/Trademark Analysis
- 5. Global Smart Sensors Market Analysis, Insights and Forecast, 2019-2031
- 5.1. Market Analysis, Insights and Forecast - by Type
- 5.1.1. Flow Sensor
- 5.1.2. Humidity Sensor
- 5.1.3. Position Sensor
- 5.1.4. Pressure Sensor
- 5.1.5. Temperature Sensor
- 5.1.6. Other Types
- 5.2. Market Analysis, Insights and Forecast - by Technology
- 5.2.1. MEMS
- 5.2.2. CMOS
- 5.2.3. Optical Spectroscopy
- 5.2.4. Other Technologies
- 5.3. Market Analysis, Insights and Forecast - by Component
- 5.3.1. Analog-to-Digital Converter
- 5.3.2. Digital-to-Analog Converter
- 5.3.3. Amplifier
- 5.3.4. Other components
- 5.4. Market Analysis, Insights and Forecast - by Application
- 5.4.1. Aerospace and Defense
- 5.4.2. Automotive and Transportation
- 5.4.3. Healthcare
- 5.4.4. Industrial Automation
- 5.4.5. Building Automation
- 5.4.6. Consumer Electronics
- 5.4.7. Other Applications
- 5.5. Market Analysis, Insights and Forecast - by Region
- 5.5.1. North America
- 5.5.2. Europe
- 5.5.3. Asia Pacific
- 5.5.4. Latin America
- 5.5.5. Middle East and Africa
- 5.1. Market Analysis, Insights and Forecast - by Type
- 6. North America Global Smart Sensors Market Analysis, Insights and Forecast, 2019-2031
- 6.1. Market Analysis, Insights and Forecast - by Type
- 6.1.1. Flow Sensor
- 6.1.2. Humidity Sensor
- 6.1.3. Position Sensor
- 6.1.4. Pressure Sensor
- 6.1.5. Temperature Sensor
- 6.1.6. Other Types
- 6.2. Market Analysis, Insights and Forecast - by Technology
- 6.2.1. MEMS
- 6.2.2. CMOS
- 6.2.3. Optical Spectroscopy
- 6.2.4. Other Technologies
- 6.3. Market Analysis, Insights and Forecast - by Component
- 6.3.1. Analog-to-Digital Converter
- 6.3.2. Digital-to-Analog Converter
- 6.3.3. Amplifier
- 6.3.4. Other components
- 6.4. Market Analysis, Insights and Forecast - by Application
- 6.4.1. Aerospace and Defense
- 6.4.2. Automotive and Transportation
- 6.4.3. Healthcare
- 6.4.4. Industrial Automation
- 6.4.5. Building Automation
- 6.4.6. Consumer Electronics
- 6.4.7. Other Applications
- 6.1. Market Analysis, Insights and Forecast - by Type
- 7. Europe Global Smart Sensors Market Analysis, Insights and Forecast, 2019-2031
- 7.1. Market Analysis, Insights and Forecast - by Type
- 7.1.1. Flow Sensor
- 7.1.2. Humidity Sensor
- 7.1.3. Position Sensor
- 7.1.4. Pressure Sensor
- 7.1.5. Temperature Sensor
- 7.1.6. Other Types
- 7.2. Market Analysis, Insights and Forecast - by Technology
- 7.2.1. MEMS
- 7.2.2. CMOS
- 7.2.3. Optical Spectroscopy
- 7.2.4. Other Technologies
- 7.3. Market Analysis, Insights and Forecast - by Component
- 7.3.1. Analog-to-Digital Converter
- 7.3.2. Digital-to-Analog Converter
- 7.3.3. Amplifier
- 7.3.4. Other components
- 7.4. Market Analysis, Insights and Forecast - by Application
- 7.4.1. Aerospace and Defense
- 7.4.2. Automotive and Transportation
- 7.4.3. Healthcare
- 7.4.4. Industrial Automation
- 7.4.5. Building Automation
- 7.4.6. Consumer Electronics
- 7.4.7. Other Applications
- 7.1. Market Analysis, Insights and Forecast - by Type
- 8. Asia Pacific Global Smart Sensors Market Analysis, Insights and Forecast, 2019-2031
- 8.1. Market Analysis, Insights and Forecast - by Type
- 8.1.1. Flow Sensor
- 8.1.2. Humidity Sensor
- 8.1.3. Position Sensor
- 8.1.4. Pressure Sensor
- 8.1.5. Temperature Sensor
- 8.1.6. Other Types
- 8.2. Market Analysis, Insights and Forecast - by Technology
- 8.2.1. MEMS
- 8.2.2. CMOS
- 8.2.3. Optical Spectroscopy
- 8.2.4. Other Technologies
- 8.3. Market Analysis, Insights and Forecast - by Component
- 8.3.1. Analog-to-Digital Converter
- 8.3.2. Digital-to-Analog Converter
- 8.3.3. Amplifier
- 8.3.4. Other components
- 8.4. Market Analysis, Insights and Forecast - by Application
- 8.4.1. Aerospace and Defense
- 8.4.2. Automotive and Transportation
- 8.4.3. Healthcare
- 8.4.4. Industrial Automation
- 8.4.5. Building Automation
- 8.4.6. Consumer Electronics
- 8.4.7. Other Applications
- 8.1. Market Analysis, Insights and Forecast - by Type
- 9. Latin America Global Smart Sensors Market Analysis, Insights and Forecast, 2019-2031
- 9.1. Market Analysis, Insights and Forecast - by Type
- 9.1.1. Flow Sensor
- 9.1.2. Humidity Sensor
- 9.1.3. Position Sensor
- 9.1.4. Pressure Sensor
- 9.1.5. Temperature Sensor
- 9.1.6. Other Types
- 9.2. Market Analysis, Insights and Forecast - by Technology
- 9.2.1. MEMS
- 9.2.2. CMOS
- 9.2.3. Optical Spectroscopy
- 9.2.4. Other Technologies
- 9.3. Market Analysis, Insights and Forecast - by Component
- 9.3.1. Analog-to-Digital Converter
- 9.3.2. Digital-to-Analog Converter
- 9.3.3. Amplifier
- 9.3.4. Other components
- 9.4. Market Analysis, Insights and Forecast - by Application
- 9.4.1. Aerospace and Defense
- 9.4.2. Automotive and Transportation
- 9.4.3. Healthcare
- 9.4.4. Industrial Automation
- 9.4.5. Building Automation
- 9.4.6. Consumer Electronics
- 9.4.7. Other Applications
- 9.1. Market Analysis, Insights and Forecast - by Type
- 10. Middle East and Africa Global Smart Sensors Market Analysis, Insights and Forecast, 2019-2031
- 10.1. Market Analysis, Insights and Forecast - by Type
- 10.1.1. Flow Sensor
- 10.1.2. Humidity Sensor
- 10.1.3. Position Sensor
- 10.1.4. Pressure Sensor
- 10.1.5. Temperature Sensor
- 10.1.6. Other Types
- 10.2. Market Analysis, Insights and Forecast - by Technology
- 10.2.1. MEMS
- 10.2.2. CMOS
- 10.2.3. Optical Spectroscopy
- 10.2.4. Other Technologies
- 10.3. Market Analysis, Insights and Forecast - by Component
- 10.3.1. Analog-to-Digital Converter
- 10.3.2. Digital-to-Analog Converter
- 10.3.3. Amplifier
- 10.3.4. Other components
- 10.4. Market Analysis, Insights and Forecast - by Application
- 10.4.1. Aerospace and Defense
- 10.4.2. Automotive and Transportation
- 10.4.3. Healthcare
- 10.4.4. Industrial Automation
- 10.4.5. Building Automation
- 10.4.6. Consumer Electronics
- 10.4.7. Other Applications
- 10.1. Market Analysis, Insights and Forecast - by Type
- 11. North America Global Smart Sensors Market Analysis, Insights and Forecast, 2019-2031
- 11.1. Market Analysis, Insights and Forecast - By Country/Sub-region
- 11.1.1 United States
- 11.1.2 Canada
- 11.1.3 Mexico
- 12. Europe Global Smart Sensors Market Analysis, Insights and Forecast, 2019-2031
- 12.1. Market Analysis, Insights and Forecast - By Country/Sub-region
- 12.1.1 Germany
- 12.1.2 United Kingdom
- 12.1.3 France
- 12.1.4 Spain
- 12.1.5 Italy
- 12.1.6 Spain
- 12.1.7 Belgium
- 12.1.8 Netherland
- 12.1.9 Nordics
- 12.1.10 Rest of Europe
- 13. Asia Pacific Global Smart Sensors Market Analysis, Insights and Forecast, 2019-2031
- 13.1. Market Analysis, Insights and Forecast - By Country/Sub-region
- 13.1.1 China
- 13.1.2 Japan
- 13.1.3 India
- 13.1.4 South Korea
- 13.1.5 Southeast Asia
- 13.1.6 Australia
- 13.1.7 Indonesia
- 13.1.8 Phillipes
- 13.1.9 Singapore
- 13.1.10 Thailandc
- 13.1.11 Rest of Asia Pacific
- 14. South America Global Smart Sensors Market Analysis, Insights and Forecast, 2019-2031
- 14.1. Market Analysis, Insights and Forecast - By Country/Sub-region
- 14.1.1 Brazil
- 14.1.2 Argentina
- 14.1.3 Peru
- 14.1.4 Chile
- 14.1.5 Colombia
- 14.1.6 Ecuador
- 14.1.7 Venezuela
- 14.1.8 Rest of South America
- 15. MEA Global Smart Sensors Market Analysis, Insights and Forecast, 2019-2031
- 15.1. Market Analysis, Insights and Forecast - By Country/Sub-region
- 15.1.1 United Arab Emirates
- 15.1.2 Saudi Arabia
- 15.1.3 South Africa
- 15.1.4 Rest of Middle East and Africa
- 16. Competitive Analysis
- 16.1. Market Share Analysis 2024
- 16.2. Company Profiles
- 16.2.1 Infineon Technologies AG
- 16.2.1.1. Overview
- 16.2.1.2. Products
- 16.2.1.3. SWOT Analysis
- 16.2.1.4. Recent Developments
- 16.2.1.5. Financials (Based on Availability)
- 16.2.2 ABB Ltd
- 16.2.2.1. Overview
- 16.2.2.2. Products
- 16.2.2.3. SWOT Analysis
- 16.2.2.4. Recent Developments
- 16.2.2.5. Financials (Based on Availability)
- 16.2.3 General Electric
- 16.2.3.1. Overview
- 16.2.3.2. Products
- 16.2.3.3. SWOT Analysis
- 16.2.3.4. Recent Developments
- 16.2.3.5. Financials (Based on Availability)
- 16.2.4 Legrand Inc
- 16.2.4.1. Overview
- 16.2.4.2. Products
- 16.2.4.3. SWOT Analysis
- 16.2.4.4. Recent Developments
- 16.2.4.5. Financials (Based on Availability)
- 16.2.5 NXP Semiconductors N V
- 16.2.5.1. Overview
- 16.2.5.2. Products
- 16.2.5.3. SWOT Analysis
- 16.2.5.4. Recent Developments
- 16.2.5.5. Financials (Based on Availability)
- 16.2.6 Siemens AG
- 16.2.6.1. Overview
- 16.2.6.2. Products
- 16.2.6.3. SWOT Analysis
- 16.2.6.4. Recent Developments
- 16.2.6.5. Financials (Based on Availability)
- 16.2.7 Honeywell International
- 16.2.7.1. Overview
- 16.2.7.2. Products
- 16.2.7.3. SWOT Analysis
- 16.2.7.4. Recent Developments
- 16.2.7.5. Financials (Based on Availability)
- 16.2.8 TE Connectivity Ltd
- 16.2.8.1. Overview
- 16.2.8.2. Products
- 16.2.8.3. SWOT Analysis
- 16.2.8.4. Recent Developments
- 16.2.8.5. Financials (Based on Availability)
- 16.2.9 ST Microelectronics
- 16.2.9.1. Overview
- 16.2.9.2. Products
- 16.2.9.3. SWOT Analysis
- 16.2.9.4. Recent Developments
- 16.2.9.5. Financials (Based on Availability)
- 16.2.10 Analog Devices Inc
- 16.2.10.1. Overview
- 16.2.10.2. Products
- 16.2.10.3. SWOT Analysis
- 16.2.10.4. Recent Developments
- 16.2.10.5. Financials (Based on Availability)
- 16.2.11 Vishay Technology Inc
- 16.2.11.1. Overview
- 16.2.11.2. Products
- 16.2.11.3. SWOT Analysis
- 16.2.11.4. Recent Developments
- 16.2.11.5. Financials (Based on Availability)
- 16.2.12 Eaton Corporation
- 16.2.12.1. Overview
- 16.2.12.2. Products
- 16.2.12.3. SWOT Analysis
- 16.2.12.4. Recent Developments
- 16.2.12.5. Financials (Based on Availability)
- 16.2.1 Infineon Technologies AG
List of Figures
- Figure 1: Global Global Smart Sensors Market Revenue Breakdown (Million, %) by Region 2024 & 2032
- Figure 2: North America Global Smart Sensors Market Revenue (Million), by Country 2024 & 2032
- Figure 3: North America Global Smart Sensors Market Revenue Share (%), by Country 2024 & 2032
- Figure 4: Europe Global Smart Sensors Market Revenue (Million), by Country 2024 & 2032
- Figure 5: Europe Global Smart Sensors Market Revenue Share (%), by Country 2024 & 2032
- Figure 6: Asia Pacific Global Smart Sensors Market Revenue (Million), by Country 2024 & 2032
- Figure 7: Asia Pacific Global Smart Sensors Market Revenue Share (%), by Country 2024 & 2032
- Figure 8: South America Global Smart Sensors Market Revenue (Million), by Country 2024 & 2032
- Figure 9: South America Global Smart Sensors Market Revenue Share (%), by Country 2024 & 2032
- Figure 10: MEA Global Smart Sensors Market Revenue (Million), by Country 2024 & 2032
- Figure 11: MEA Global Smart Sensors Market Revenue Share (%), by Country 2024 & 2032
- Figure 12: North America Global Smart Sensors Market Revenue (Million), by Type 2024 & 2032
- Figure 13: North America Global Smart Sensors Market Revenue Share (%), by Type 2024 & 2032
- Figure 14: North America Global Smart Sensors Market Revenue (Million), by Technology 2024 & 2032
- Figure 15: North America Global Smart Sensors Market Revenue Share (%), by Technology 2024 & 2032
- Figure 16: North America Global Smart Sensors Market Revenue (Million), by Component 2024 & 2032
- Figure 17: North America Global Smart Sensors Market Revenue Share (%), by Component 2024 & 2032
- Figure 18: North America Global Smart Sensors Market Revenue (Million), by Application 2024 & 2032
- Figure 19: North America Global Smart Sensors Market Revenue Share (%), by Application 2024 & 2032
- Figure 20: North America Global Smart Sensors Market Revenue (Million), by Country 2024 & 2032
- Figure 21: North America Global Smart Sensors Market Revenue Share (%), by Country 2024 & 2032
- Figure 22: Europe Global Smart Sensors Market Revenue (Million), by Type 2024 & 2032
- Figure 23: Europe Global Smart Sensors Market Revenue Share (%), by Type 2024 & 2032
- Figure 24: Europe Global Smart Sensors Market Revenue (Million), by Technology 2024 & 2032
- Figure 25: Europe Global Smart Sensors Market Revenue Share (%), by Technology 2024 & 2032
- Figure 26: Europe Global Smart Sensors Market Revenue (Million), by Component 2024 & 2032
- Figure 27: Europe Global Smart Sensors Market Revenue Share (%), by Component 2024 & 2032
- Figure 28: Europe Global Smart Sensors Market Revenue (Million), by Application 2024 & 2032
- Figure 29: Europe Global Smart Sensors Market Revenue Share (%), by Application 2024 & 2032
- Figure 30: Europe Global Smart Sensors Market Revenue (Million), by Country 2024 & 2032
- Figure 31: Europe Global Smart Sensors Market Revenue Share (%), by Country 2024 & 2032
- Figure 32: Asia Pacific Global Smart Sensors Market Revenue (Million), by Type 2024 & 2032
- Figure 33: Asia Pacific Global Smart Sensors Market Revenue Share (%), by Type 2024 & 2032
- Figure 34: Asia Pacific Global Smart Sensors Market Revenue (Million), by Technology 2024 & 2032
- Figure 35: Asia Pacific Global Smart Sensors Market Revenue Share (%), by Technology 2024 & 2032
- Figure 36: Asia Pacific Global Smart Sensors Market Revenue (Million), by Component 2024 & 2032
- Figure 37: Asia Pacific Global Smart Sensors Market Revenue Share (%), by Component 2024 & 2032
- Figure 38: Asia Pacific Global Smart Sensors Market Revenue (Million), by Application 2024 & 2032
- Figure 39: Asia Pacific Global Smart Sensors Market Revenue Share (%), by Application 2024 & 2032
- Figure 40: Asia Pacific Global Smart Sensors Market Revenue (Million), by Country 2024 & 2032
- Figure 41: Asia Pacific Global Smart Sensors Market Revenue Share (%), by Country 2024 & 2032
- Figure 42: Latin America Global Smart Sensors Market Revenue (Million), by Type 2024 & 2032
- Figure 43: Latin America Global Smart Sensors Market Revenue Share (%), by Type 2024 & 2032
- Figure 44: Latin America Global Smart Sensors Market Revenue (Million), by Technology 2024 & 2032
- Figure 45: Latin America Global Smart Sensors Market Revenue Share (%), by Technology 2024 & 2032
- Figure 46: Latin America Global Smart Sensors Market Revenue (Million), by Component 2024 & 2032
- Figure 47: Latin America Global Smart Sensors Market Revenue Share (%), by Component 2024 & 2032
- Figure 48: Latin America Global Smart Sensors Market Revenue (Million), by Application 2024 & 2032
- Figure 49: Latin America Global Smart Sensors Market Revenue Share (%), by Application 2024 & 2032
- Figure 50: Latin America Global Smart Sensors Market Revenue (Million), by Country 2024 & 2032
- Figure 51: Latin America Global Smart Sensors Market Revenue Share (%), by Country 2024 & 2032
- Figure 52: Middle East and Africa Global Smart Sensors Market Revenue (Million), by Type 2024 & 2032
- Figure 53: Middle East and Africa Global Smart Sensors Market Revenue Share (%), by Type 2024 & 2032
- Figure 54: Middle East and Africa Global Smart Sensors Market Revenue (Million), by Technology 2024 & 2032
- Figure 55: Middle East and Africa Global Smart Sensors Market Revenue Share (%), by Technology 2024 & 2032
- Figure 56: Middle East and Africa Global Smart Sensors Market Revenue (Million), by Component 2024 & 2032
- Figure 57: Middle East and Africa Global Smart Sensors Market Revenue Share (%), by Component 2024 & 2032
- Figure 58: Middle East and Africa Global Smart Sensors Market Revenue (Million), by Application 2024 & 2032
- Figure 59: Middle East and Africa Global Smart Sensors Market Revenue Share (%), by Application 2024 & 2032
- Figure 60: Middle East and Africa Global Smart Sensors Market Revenue (Million), by Country 2024 & 2032
- Figure 61: Middle East and Africa Global Smart Sensors Market Revenue Share (%), by Country 2024 & 2032
List of Tables
- Table 1: Global Smart Sensors Market Revenue Million Forecast, by Region 2019 & 2032
- Table 2: Global Smart Sensors Market Revenue Million Forecast, by Type 2019 & 2032
- Table 3: Global Smart Sensors Market Revenue Million Forecast, by Technology 2019 & 2032
- Table 4: Global Smart Sensors Market Revenue Million Forecast, by Component 2019 & 2032
- Table 5: Global Smart Sensors Market Revenue Million Forecast, by Application 2019 & 2032
- Table 6: Global Smart Sensors Market Revenue Million Forecast, by Region 2019 & 2032
- Table 7: Global Smart Sensors Market Revenue Million Forecast, by Country 2019 & 2032
- Table 8: United States Global Smart Sensors Market Revenue (Million) Forecast, by Application 2019 & 2032
- Table 9: Canada Global Smart Sensors Market Revenue (Million) Forecast, by Application 2019 & 2032
- Table 10: Mexico Global Smart Sensors Market Revenue (Million) Forecast, by Application 2019 & 2032
- Table 11: Global Smart Sensors Market Revenue Million Forecast, by Country 2019 & 2032
- Table 12: Germany Global Smart Sensors Market Revenue (Million) Forecast, by Application 2019 & 2032
- Table 13: United Kingdom Global Smart Sensors Market Revenue (Million) Forecast, by Application 2019 & 2032
- Table 14: France Global Smart Sensors Market Revenue (Million) Forecast, by Application 2019 & 2032
- Table 15: Spain Global Smart Sensors Market Revenue (Million) Forecast, by Application 2019 & 2032
- Table 16: Italy Global Smart Sensors Market Revenue (Million) Forecast, by Application 2019 & 2032
- Table 17: Spain Global Smart Sensors Market Revenue (Million) Forecast, by Application 2019 & 2032
- Table 18: Belgium Global Smart Sensors Market Revenue (Million) Forecast, by Application 2019 & 2032
- Table 19: Netherland Global Smart Sensors Market Revenue (Million) Forecast, by Application 2019 & 2032
- Table 20: Nordics Global Smart Sensors Market Revenue (Million) Forecast, by Application 2019 & 2032
- Table 21: Rest of Europe Global Smart Sensors Market Revenue (Million) Forecast, by Application 2019 & 2032
- Table 22: Global Smart Sensors Market Revenue Million Forecast, by Country 2019 & 2032
- Table 23: China Global Smart Sensors Market Revenue (Million) Forecast, by Application 2019 & 2032
- Table 24: Japan Global Smart Sensors Market Revenue (Million) Forecast, by Application 2019 & 2032
- Table 25: India Global Smart Sensors Market Revenue (Million) Forecast, by Application 2019 & 2032
- Table 26: South Korea Global Smart Sensors Market Revenue (Million) Forecast, by Application 2019 & 2032
- Table 27: Southeast Asia Global Smart Sensors Market Revenue (Million) Forecast, by Application 2019 & 2032
- Table 28: Australia Global Smart Sensors Market Revenue (Million) Forecast, by Application 2019 & 2032
- Table 29: Indonesia Global Smart Sensors Market Revenue (Million) Forecast, by Application 2019 & 2032
- Table 30: Phillipes Global Smart Sensors Market Revenue (Million) Forecast, by Application 2019 & 2032
- Table 31: Singapore Global Smart Sensors Market Revenue (Million) Forecast, by Application 2019 & 2032
- Table 32: Thailandc Global Smart Sensors Market Revenue (Million) Forecast, by Application 2019 & 2032
- Table 33: Rest of Asia Pacific Global Smart Sensors Market Revenue (Million) Forecast, by Application 2019 & 2032
- Table 34: Global Smart Sensors Market Revenue Million Forecast, by Country 2019 & 2032
- Table 35: Brazil Global Smart Sensors Market Revenue (Million) Forecast, by Application 2019 & 2032
- Table 36: Argentina Global Smart Sensors Market Revenue (Million) Forecast, by Application 2019 & 2032
- Table 37: Peru Global Smart Sensors Market Revenue (Million) Forecast, by Application 2019 & 2032
- Table 38: Chile Global Smart Sensors Market Revenue (Million) Forecast, by Application 2019 & 2032
- Table 39: Colombia Global Smart Sensors Market Revenue (Million) Forecast, by Application 2019 & 2032
- Table 40: Ecuador Global Smart Sensors Market Revenue (Million) Forecast, by Application 2019 & 2032
- Table 41: Venezuela Global Smart Sensors Market Revenue (Million) Forecast, by Application 2019 & 2032
- Table 42: Rest of South America Global Smart Sensors Market Revenue (Million) Forecast, by Application 2019 & 2032
- Table 43: Global Smart Sensors Market Revenue Million Forecast, by Country 2019 & 2032
- Table 44: United Arab Emirates Global Smart Sensors Market Revenue (Million) Forecast, by Application 2019 & 2032
- Table 45: Saudi Arabia Global Smart Sensors Market Revenue (Million) Forecast, by Application 2019 & 2032
- Table 46: South Africa Global Smart Sensors Market Revenue (Million) Forecast, by Application 2019 & 2032
- Table 47: Rest of Middle East and Africa Global Smart Sensors Market Revenue (Million) Forecast, by Application 2019 & 2032
- Table 48: Global Smart Sensors Market Revenue Million Forecast, by Type 2019 & 2032
- Table 49: Global Smart Sensors Market Revenue Million Forecast, by Technology 2019 & 2032
- Table 50: Global Smart Sensors Market Revenue Million Forecast, by Component 2019 & 2032
- Table 51: Global Smart Sensors Market Revenue Million Forecast, by Application 2019 & 2032
- Table 52: Global Smart Sensors Market Revenue Million Forecast, by Country 2019 & 2032
- Table 53: United States Global Smart Sensors Market Revenue (Million) Forecast, by Application 2019 & 2032
- Table 54: Canada Global Smart Sensors Market Revenue (Million) Forecast, by Application 2019 & 2032
- Table 55: Global Smart Sensors Market Revenue Million Forecast, by Type 2019 & 2032
- Table 56: Global Smart Sensors Market Revenue Million Forecast, by Technology 2019 & 2032
- Table 57: Global Smart Sensors Market Revenue Million Forecast, by Component 2019 & 2032
- Table 58: Global Smart Sensors Market Revenue Million Forecast, by Application 2019 & 2032
- Table 59: Global Smart Sensors Market Revenue Million Forecast, by Country 2019 & 2032
- Table 60: United Kingdom Global Smart Sensors Market Revenue (Million) Forecast, by Application 2019 & 2032
- Table 61: Germany Global Smart Sensors Market Revenue (Million) Forecast, by Application 2019 & 2032
- Table 62: France Global Smart Sensors Market Revenue (Million) Forecast, by Application 2019 & 2032
- Table 63: Rest of Europe Global Smart Sensors Market Revenue (Million) Forecast, by Application 2019 & 2032
- Table 64: Global Smart Sensors Market Revenue Million Forecast, by Type 2019 & 2032
- Table 65: Global Smart Sensors Market Revenue Million Forecast, by Technology 2019 & 2032
- Table 66: Global Smart Sensors Market Revenue Million Forecast, by Component 2019 & 2032
- Table 67: Global Smart Sensors Market Revenue Million Forecast, by Application 2019 & 2032
- Table 68: Global Smart Sensors Market Revenue Million Forecast, by Country 2019 & 2032
- Table 69: China Global Smart Sensors Market Revenue (Million) Forecast, by Application 2019 & 2032
- Table 70: India Global Smart Sensors Market Revenue (Million) Forecast, by Application 2019 & 2032
- Table 71: Japan Global Smart Sensors Market Revenue (Million) Forecast, by Application 2019 & 2032
- Table 72: Rest Asia Pacific Global Smart Sensors Market Revenue (Million) Forecast, by Application 2019 & 2032
- Table 73: Global Smart Sensors Market Revenue Million Forecast, by Type 2019 & 2032
- Table 74: Global Smart Sensors Market Revenue Million Forecast, by Technology 2019 & 2032
- Table 75: Global Smart Sensors Market Revenue Million Forecast, by Component 2019 & 2032
- Table 76: Global Smart Sensors Market Revenue Million Forecast, by Application 2019 & 2032
- Table 77: Global Smart Sensors Market Revenue Million Forecast, by Country 2019 & 2032
- Table 78: Global Smart Sensors Market Revenue Million Forecast, by Type 2019 & 2032
- Table 79: Global Smart Sensors Market Revenue Million Forecast, by Technology 2019 & 2032
- Table 80: Global Smart Sensors Market Revenue Million Forecast, by Component 2019 & 2032
- Table 81: Global Smart Sensors Market Revenue Million Forecast, by Application 2019 & 2032
- Table 82: Global Smart Sensors Market Revenue Million Forecast, by Country 2019 & 2032
Frequently Asked Questions
1. What is the projected Compound Annual Growth Rate (CAGR) of the Global Smart Sensors Market?
The projected CAGR is approximately 18.30%.
2. Which companies are prominent players in the Global Smart Sensors Market?
Key companies in the market include Infineon Technologies AG, ABB Ltd, General Electric, Legrand Inc, NXP Semiconductors N V, Siemens AG, Honeywell International, TE Connectivity Ltd, ST Microelectronics, Analog Devices Inc, Vishay Technology Inc , Eaton Corporation.
3. What are the main segments of the Global Smart Sensors Market?
The market segments include Type, Technology, Component, Application.
4. Can you provide details about the market size?
The market size is estimated to be USD 55.86 Million as of 2022.
5. What are some drivers contributing to market growth?
Growing Demand for Energy Efficiency and Saving; Increasing Demand for Consumer Electronics Products; Higher Demand for Smart Sensors in the Healthcare and Automotive Industries; Technology Advancements in Miniaturization and Wireless Capabilities.
6. What are the notable trends driving market growth?
Temperature Sensors to Witness High Growth.
7. Are there any restraints impacting market growth?
Relatively High Deployment Costs; Complex Design compared to Traditional Sensors.
8. Can you provide examples of recent developments in the market?
October 2022 : Optomotive, a producer of advanced, high-performance cameras and 3D smart sensors, announced the debut of two new product lines at VISION 2022. will show off its fully engineered LOM series of 3D high-speed smart sensors. High-speed laser triangulation sensors from the LOM sensor line, which is based on Optomotive's FPGA camera technology, may be fully customized and user-programmed. The series is capable of inspection rates of up to 10 kHz and is designed for high-performance examination.
9. What pricing options are available for accessing the report?
Pricing options include single-user, multi-user, and enterprise licenses priced at USD 4750, USD 5250, and USD 8750 respectively.
10. Is the market size provided in terms of value or volume?
The market size is provided in terms of value, measured in Million.
11. Are there any specific market keywords associated with the report?
Yes, the market keyword associated with the report is "Global Smart Sensors Market," which aids in identifying and referencing the specific market segment covered.
12. How do I determine which pricing option suits my needs best?
The pricing options vary based on user requirements and access needs. Individual users may opt for single-user licenses, while businesses requiring broader access may choose multi-user or enterprise licenses for cost-effective access to the report.
13. Are there any additional resources or data provided in the Global Smart Sensors Market report?
While the report offers comprehensive insights, it's advisable to review the specific contents or supplementary materials provided to ascertain if additional resources or data are available.
14. How can I stay updated on further developments or reports in the Global Smart Sensors Market?
To stay informed about further developments, trends, and reports in the Global Smart Sensors Market, consider subscribing to industry newsletters, following relevant companies and organizations, or regularly checking reputable industry news sources and publications.
Methodology
Step 1 - Identification of Relevant Samples Size from Population Database


Step 2 - Approaches for Defining Global Market Size (Value, Volume* & Price*)

Note*: In applicable scenarios
Step 3 - Data Sources
Primary Research
- Web Analytics
- Survey Reports
- Research Institute
- Latest Research Reports
- Opinion Leaders
Secondary Research
- Annual Reports
- White Paper
- Latest Press Release
- Industry Association
- Paid Database
- Investor Presentations

Step 4 - Data Triangulation
Involves using different sources of information in order to increase the validity of a study
These sources are likely to be stakeholders in a program - participants, other researchers, program staff, other community members, and so on.
Then we put all data in single framework & apply various statistical tools to find out the dynamic on the market.
During the analysis stage, feedback from the stakeholder groups would be compared to determine areas of agreement as well as areas of divergence
