

Key Insights
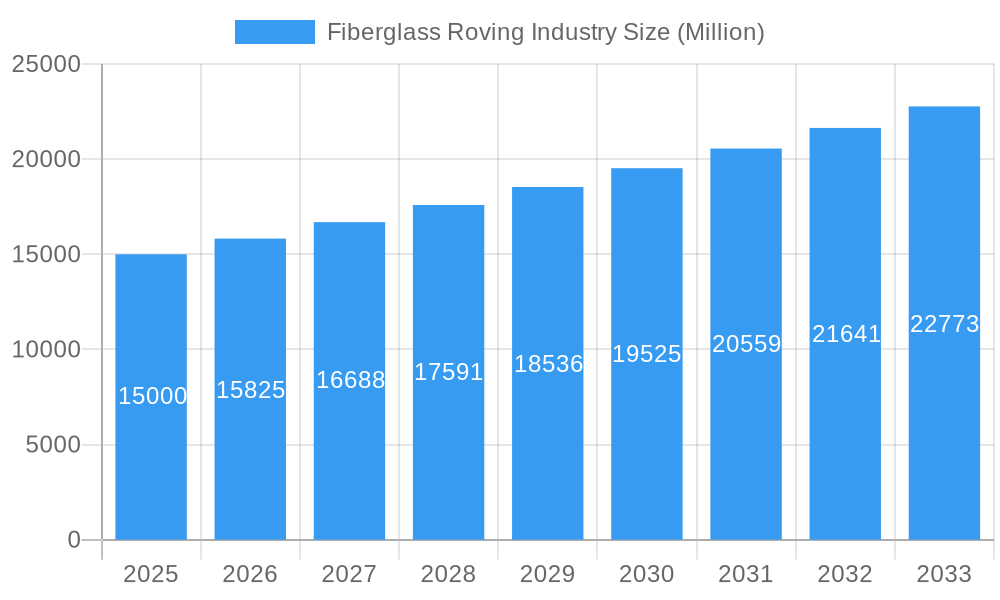
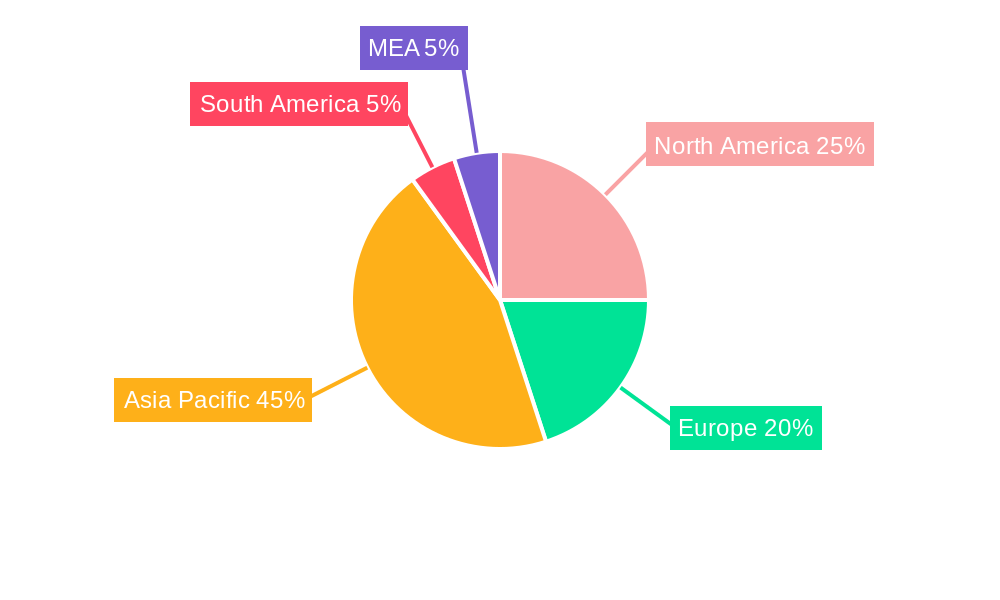
The global fiberglass roving market, valued at approximately $10.37 billion in 2025, is projected to expand at a compound annual growth rate (CAGR) of 8.6% from 2025 to 2033. This growth is propelled by key factors including escalating demand from the construction and infrastructure sectors, especially in rapidly urbanizing developing economies. The inherent strength and lightweight properties of fiberglass roving make it ideal for reinforced concrete, enhancing structural integrity and durability. Significant adoption within the transportation industry, particularly in automotive for fuel efficiency and in wind energy, further fuels market expansion. The electrical and electronics sectors also contribute, benefiting from fiberglass roving's superior insulation and structural support. Market growth is moderated by challenges such as fluctuating raw material costs and environmental considerations. The market is segmented by type (E-glass, H-glass, ECR-glass, S-glass, others) and end-user industry (construction, transportation, electrical & electronics, pipes & tanks, energy, others). E-glass leads due to its cost-effectiveness, while H-glass and S-glass are increasingly favored for high-performance applications. Geographically, Asia-Pacific dominates, driven by substantial construction activities in China and India, followed by North America and Europe.
Fiberglass Roving Industry Market Size (In Billion)
The competitive arena features established global entities and emerging regional manufacturers. Leading players such as Saint-Gobain SA, Owens Corning, and Nippon Electric Glass leverage robust manufacturing and distribution networks. The Asia-Pacific region, in particular, sees growing participation from local manufacturers addressing domestic demand. Future market trajectory will be shaped by technological advancements in production, enhancing performance and sustainability. Strategic alliances and collaborations are expected to be pivotal. A focus on eco-friendly manufacturing and recycled fiberglass solutions will also influence market trends. Continued global infrastructure development and the increasing preference for lightweight materials across diverse industries present substantial opportunities for sustained market expansion.
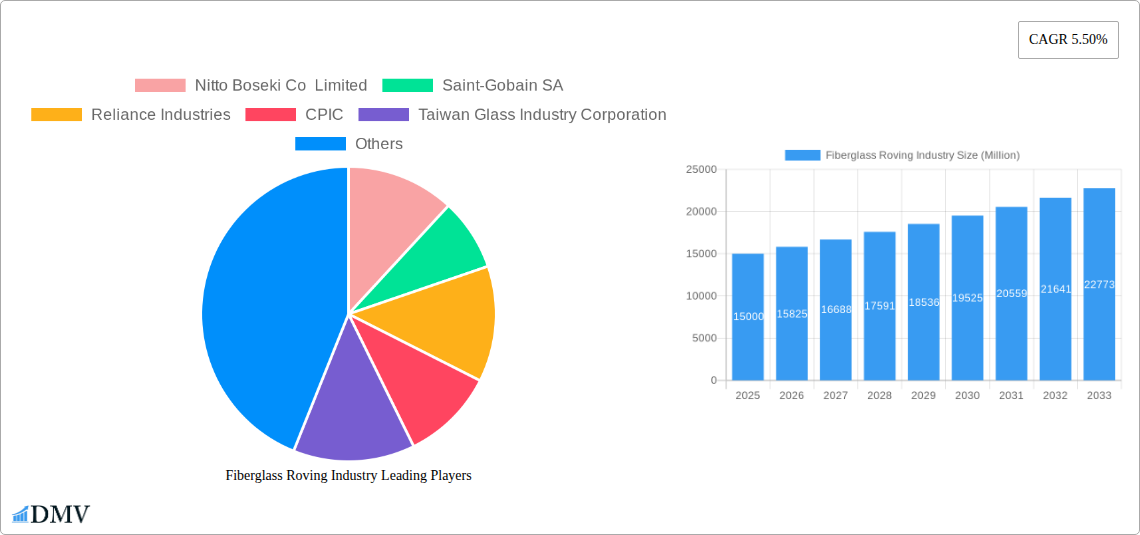
Fiberglass Roving Industry Company Market Share
Fiberglass Roving Industry: A Comprehensive Market Report (2019-2033)
This insightful report provides a detailed analysis of the global fiberglass roving market, offering a comprehensive overview of its current state and future trajectory. The study period spans from 2019 to 2033, with 2025 serving as both the base and estimated year. This in-depth analysis is crucial for stakeholders seeking to understand market dynamics, identify growth opportunities, and make informed strategic decisions. The market is valued at $XX Million in 2025 and is projected to reach $XX Million by 2033, exhibiting a CAGR of XX%.
Fiberglass Roving Industry Market Composition & Trends
This section delves into the competitive landscape of the fiberglass roving market, examining market concentration, innovation drivers, regulatory frameworks, substitute materials, end-user profiles, and mergers and acquisitions (M&A) activity. We analyze the market share distribution among key players, including Nitto Boseki Co Limited, Saint-Gobain SA, Reliance Industries, CPIC, Taiwan Glass Industry Corporation, PFG Fiberglass Corporation, Johns Manville Corporation, Owens Corning, AGY Holding Corporation, China National Building Material Company Limited, and Nippon Electric Glass. The report further explores the impact of recent M&A deals, with a focus on deal values and their influence on market consolidation. The estimated total value of M&A deals within the study period is $XX Million.
- Market Concentration: The market is characterized by [Describe market concentration - e.g., high/moderate/low concentration; Herfindahl-Hirschman Index (HHI) value if available].
- Innovation Catalysts: [Describe key innovation drivers such as technological advancements in fiber production, improved resin systems, and novel application development].
- Regulatory Landscape: [Discuss relevant environmental regulations and their impact on production methods and material usage, including specific examples and potential impacts on market growth].
- Substitute Products: [Analyze competitive threats from alternative materials such as carbon fiber and other composites, including market share estimations].
- End-User Profiles: [Describe the characteristics and purchasing behaviors of key end-user segments and their influence on market demand].
- M&A Activities: [Analyze significant mergers and acquisitions, detailing their impact on market structure and competitive dynamics. Include specific examples and deal values].
Fiberglass Roving Industry Evolution
This section provides a detailed historical and projected analysis of the fiberglass roving market's growth trajectory, focusing on technological advancements and changing consumer demands from 2019 to 2033. We analyze factors driving market growth, including shifts in construction methodologies, expanding application areas in transportation and renewable energy, and the increasing adoption of advanced composites. The report also quantifies the impact of these factors, providing specific data points on growth rates and market penetration for different types of fiberglass roving and end-user industries. The market experienced a [Describe growth - e.g., robust/moderate/slow] growth rate of XX% during the historical period (2019-2024) and is projected to grow at XX% during the forecast period (2025-2033). Technological advancements, such as the development of high-strength, lightweight fibers, have played a crucial role in driving market expansion.
Leading Regions, Countries, or Segments in Fiberglass Roving Industry
This section identifies the leading regions, countries, and segments within the fiberglass roving market. The report analyzes regional differences in market size and growth potential, highlighting key factors contributing to the dominance of specific geographic areas or product types.
By Type:
- E-glass: [Dominant region/country, key drivers such as cost-effectiveness and widespread applications]
- H-glass: [Dominant region/country, key drivers such as superior strength and applications in high-performance composites]
- ECR-glass: [Dominant region/country, key drivers such as its electrical resistivity properties and applications]
- S-glass: [Dominant region/country, key drivers such as its high strength-to-weight ratio and aerospace applications]
- Other Types: [Dominant region/country, key drivers]
By End-user Industry:
- Construction and Infrastructure: [Dominant region/country, key drivers such as large-scale infrastructure projects and building boom in developing economies.]
- Transportation: [Dominant region/country, key drivers such as increasing demand for lightweight vehicles and the growth of the automotive industry]
- Electrical and Electronics: [Dominant region/country, key drivers such as advancements in electronics and the growing demand for high-performance electronics.]
- Pipes and Tanks: [Dominant region/country, key drivers such as the need for corrosion-resistant materials and durable infrastructure]
- Energy: [Dominant region/country, key drivers such as increasing demand for wind energy, and other renewable energy sources]
- Other End-user Industries: [Dominant region/country, key drivers]
Fiberglass Roving Industry Product Innovations
Recent innovations in fiberglass roving have focused on enhancing performance characteristics such as tensile strength, flexural modulus, and chemical resistance. The development of specialized fiber coatings and the introduction of hybrid materials combining fiberglass with other reinforcing fibers have further improved product capabilities. These advancements are expanding the applications of fiberglass roving into new sectors and creating unique selling propositions for manufacturers. Specific examples include [mention specific product innovations and their unique selling propositions].
Propelling Factors for Fiberglass Roving Industry Growth
Several factors are driving growth in the fiberglass roving market. Technological advancements resulting in stronger, lighter, and more cost-effective materials are a major driver. Government initiatives promoting sustainable construction and infrastructure projects also boost demand. Furthermore, the expansion of the wind energy and automotive industries creates substantial demand for high-performance fiberglass roving.
Obstacles in the Fiberglass Roving Industry Market
Challenges facing the fiberglass roving industry include fluctuations in raw material prices, environmental regulations impacting production processes, and intense competition from alternative materials. Supply chain disruptions and trade policies also pose significant risks to manufacturers. These factors can lead to price volatility and affect production efficiency.
Future Opportunities in Fiberglass Roving Industry
Future opportunities lie in exploring new applications in emerging industries like aerospace and renewable energy. The development of innovative fiber architectures and hybrid composites presents considerable potential for growth. Furthermore, expanding into new geographic markets, especially in developing economies, offers significant growth potential.
Major Players in the Fiberglass Roving Industry Ecosystem
- Nitto Boseki Co Limited
- Saint-Gobain SA
- Reliance Industries
- CPIC
- Taiwan Glass Industry Corporation
- PFG Fiberglass Corporation
- Johns Manville Corporation
- Owens Corning
- AGY Holding Corporation
- China National Building Material Company Limited
- Nippon Electric Glass
Key Developments in Fiberglass Roving Industry Industry
- [List key developments with year/month, e.g., "January 2023: Company X launched a new type of high-strength fiberglass roving."]
Strategic Fiberglass Roving Industry Market Forecast
The fiberglass roving market is poised for continued growth driven by the increasing demand for lightweight and high-strength materials across diverse industries. Emerging applications in renewable energy, aerospace, and advanced composites will fuel market expansion. Government regulations promoting sustainability and infrastructure development will further contribute to market growth. The forecast period presents significant opportunities for players who can innovate and adapt to changing market dynamics.
Fiberglass Roving Industry Segmentation
-
1. Type
- 1.1. E-glass
- 1.2. H-glass
- 1.3. ECR-glass
- 1.4. S-glass
- 1.5. Other Types
-
2. End-user Industry
- 2.1. Construction and Infrastructure
- 2.2. Transportation
- 2.3. Electrical and Electronics
- 2.4. Pipes and Tanks
- 2.5. Energy
- 2.6. Other End-user Industries
Fiberglass Roving Industry Segmentation By Geography
-
1. North America
- 1.1. United States
- 1.2. Canada
-
2. Europe
- 2.1. United Kingdom
- 2.2. Germany
- 2.3. France
- 2.4. Rest of Europe
-
3. Asia Pacific
- 3.1. China
- 3.2. India
- 3.3. Japan
- 3.4. Rest of Asia Pacific
- 4. Latin America
- 5. Middle East
Fiberglass Roving Industry Regional Market Share
Geographic Coverage of Fiberglass Roving Industry
Fiberglass Roving Industry REPORT HIGHLIGHTS
| Aspects | Details |
|---|---|
| Study Period | 2020-2034 |
| Base Year | 2025 |
| Estimated Year | 2026 |
| Forecast Period | 2026-2034 |
| Historical Period | 2020-2025 |
| Growth Rate | CAGR of 8.6% from 2020-2034 |
| Segmentation |
|
Table of Contents
- 1. Introduction
- 1.1. Research Scope
- 1.2. Market Segmentation
- 1.3. Research Methodology
- 1.4. Definitions and Assumptions
- 2. Executive Summary
- 2.1. Introduction
- 3. Market Dynamics
- 3.1. Introduction
- 3.2. Market Drivers
- 3.2.1. ; Growing Demand From the Energy & Infrastructure Domain; Anticipated Growth in Adoption From GFRP Pipes Applications
- 3.3. Market Restrains
- 3.3.1. ; Recycling Concerns and Dependence on End-user Uptake
- 3.4. Market Trends
- 3.4.1. Construction & Infrastructure is Expected to Witness Significant Growth
- 4. Market Factor Analysis
- 4.1. Porters Five Forces
- 4.2. Supply/Value Chain
- 4.3. PESTEL analysis
- 4.4. Market Entropy
- 4.5. Patent/Trademark Analysis
- 5. Global Fiberglass Roving Industry Analysis, Insights and Forecast, 2020-2032
- 5.1. Market Analysis, Insights and Forecast - by Type
- 5.1.1. E-glass
- 5.1.2. H-glass
- 5.1.3. ECR-glass
- 5.1.4. S-glass
- 5.1.5. Other Types
- 5.2. Market Analysis, Insights and Forecast - by End-user Industry
- 5.2.1. Construction and Infrastructure
- 5.2.2. Transportation
- 5.2.3. Electrical and Electronics
- 5.2.4. Pipes and Tanks
- 5.2.5. Energy
- 5.2.6. Other End-user Industries
- 5.3. Market Analysis, Insights and Forecast - by Region
- 5.3.1. North America
- 5.3.2. Europe
- 5.3.3. Asia Pacific
- 5.3.4. Latin America
- 5.3.5. Middle East
- 5.1. Market Analysis, Insights and Forecast - by Type
- 6. North America Fiberglass Roving Industry Analysis, Insights and Forecast, 2020-2032
- 6.1. Market Analysis, Insights and Forecast - by Type
- 6.1.1. E-glass
- 6.1.2. H-glass
- 6.1.3. ECR-glass
- 6.1.4. S-glass
- 6.1.5. Other Types
- 6.2. Market Analysis, Insights and Forecast - by End-user Industry
- 6.2.1. Construction and Infrastructure
- 6.2.2. Transportation
- 6.2.3. Electrical and Electronics
- 6.2.4. Pipes and Tanks
- 6.2.5. Energy
- 6.2.6. Other End-user Industries
- 6.1. Market Analysis, Insights and Forecast - by Type
- 7. Europe Fiberglass Roving Industry Analysis, Insights and Forecast, 2020-2032
- 7.1. Market Analysis, Insights and Forecast - by Type
- 7.1.1. E-glass
- 7.1.2. H-glass
- 7.1.3. ECR-glass
- 7.1.4. S-glass
- 7.1.5. Other Types
- 7.2. Market Analysis, Insights and Forecast - by End-user Industry
- 7.2.1. Construction and Infrastructure
- 7.2.2. Transportation
- 7.2.3. Electrical and Electronics
- 7.2.4. Pipes and Tanks
- 7.2.5. Energy
- 7.2.6. Other End-user Industries
- 7.1. Market Analysis, Insights and Forecast - by Type
- 8. Asia Pacific Fiberglass Roving Industry Analysis, Insights and Forecast, 2020-2032
- 8.1. Market Analysis, Insights and Forecast - by Type
- 8.1.1. E-glass
- 8.1.2. H-glass
- 8.1.3. ECR-glass
- 8.1.4. S-glass
- 8.1.5. Other Types
- 8.2. Market Analysis, Insights and Forecast - by End-user Industry
- 8.2.1. Construction and Infrastructure
- 8.2.2. Transportation
- 8.2.3. Electrical and Electronics
- 8.2.4. Pipes and Tanks
- 8.2.5. Energy
- 8.2.6. Other End-user Industries
- 8.1. Market Analysis, Insights and Forecast - by Type
- 9. Latin America Fiberglass Roving Industry Analysis, Insights and Forecast, 2020-2032
- 9.1. Market Analysis, Insights and Forecast - by Type
- 9.1.1. E-glass
- 9.1.2. H-glass
- 9.1.3. ECR-glass
- 9.1.4. S-glass
- 9.1.5. Other Types
- 9.2. Market Analysis, Insights and Forecast - by End-user Industry
- 9.2.1. Construction and Infrastructure
- 9.2.2. Transportation
- 9.2.3. Electrical and Electronics
- 9.2.4. Pipes and Tanks
- 9.2.5. Energy
- 9.2.6. Other End-user Industries
- 9.1. Market Analysis, Insights and Forecast - by Type
- 10. Middle East Fiberglass Roving Industry Analysis, Insights and Forecast, 2020-2032
- 10.1. Market Analysis, Insights and Forecast - by Type
- 10.1.1. E-glass
- 10.1.2. H-glass
- 10.1.3. ECR-glass
- 10.1.4. S-glass
- 10.1.5. Other Types
- 10.2. Market Analysis, Insights and Forecast - by End-user Industry
- 10.2.1. Construction and Infrastructure
- 10.2.2. Transportation
- 10.2.3. Electrical and Electronics
- 10.2.4. Pipes and Tanks
- 10.2.5. Energy
- 10.2.6. Other End-user Industries
- 10.1. Market Analysis, Insights and Forecast - by Type
- 11. Competitive Analysis
- 11.1. Global Market Share Analysis 2025
- 11.2. Company Profiles
- 11.2.1 Nitto Boseki Co Limited
- 11.2.1.1. Overview
- 11.2.1.2. Products
- 11.2.1.3. SWOT Analysis
- 11.2.1.4. Recent Developments
- 11.2.1.5. Financials (Based on Availability)
- 11.2.2 Saint-Gobain SA
- 11.2.2.1. Overview
- 11.2.2.2. Products
- 11.2.2.3. SWOT Analysis
- 11.2.2.4. Recent Developments
- 11.2.2.5. Financials (Based on Availability)
- 11.2.3 Reliance Industries
- 11.2.3.1. Overview
- 11.2.3.2. Products
- 11.2.3.3. SWOT Analysis
- 11.2.3.4. Recent Developments
- 11.2.3.5. Financials (Based on Availability)
- 11.2.4 CPIC
- 11.2.4.1. Overview
- 11.2.4.2. Products
- 11.2.4.3. SWOT Analysis
- 11.2.4.4. Recent Developments
- 11.2.4.5. Financials (Based on Availability)
- 11.2.5 Taiwan Glass Industry Corporation
- 11.2.5.1. Overview
- 11.2.5.2. Products
- 11.2.5.3. SWOT Analysis
- 11.2.5.4. Recent Developments
- 11.2.5.5. Financials (Based on Availability)
- 11.2.6 PFG Fiberglass Corporation
- 11.2.6.1. Overview
- 11.2.6.2. Products
- 11.2.6.3. SWOT Analysis
- 11.2.6.4. Recent Developments
- 11.2.6.5. Financials (Based on Availability)
- 11.2.7 Johns Manville Corporation*List Not Exhaustive
- 11.2.7.1. Overview
- 11.2.7.2. Products
- 11.2.7.3. SWOT Analysis
- 11.2.7.4. Recent Developments
- 11.2.7.5. Financials (Based on Availability)
- 11.2.8 Owens Corning
- 11.2.8.1. Overview
- 11.2.8.2. Products
- 11.2.8.3. SWOT Analysis
- 11.2.8.4. Recent Developments
- 11.2.8.5. Financials (Based on Availability)
- 11.2.9 AGY Holding Corporation
- 11.2.9.1. Overview
- 11.2.9.2. Products
- 11.2.9.3. SWOT Analysis
- 11.2.9.4. Recent Developments
- 11.2.9.5. Financials (Based on Availability)
- 11.2.10 China National Building Material Company Limited
- 11.2.10.1. Overview
- 11.2.10.2. Products
- 11.2.10.3. SWOT Analysis
- 11.2.10.4. Recent Developments
- 11.2.10.5. Financials (Based on Availability)
- 11.2.11 Nippon Electric Glass
- 11.2.11.1. Overview
- 11.2.11.2. Products
- 11.2.11.3. SWOT Analysis
- 11.2.11.4. Recent Developments
- 11.2.11.5. Financials (Based on Availability)
- 11.2.1 Nitto Boseki Co Limited
List of Figures
- Figure 1: Global Fiberglass Roving Industry Revenue Breakdown (billion, %) by Region 2025 & 2033
- Figure 2: North America Fiberglass Roving Industry Revenue (billion), by Type 2025 & 2033
- Figure 3: North America Fiberglass Roving Industry Revenue Share (%), by Type 2025 & 2033
- Figure 4: North America Fiberglass Roving Industry Revenue (billion), by End-user Industry 2025 & 2033
- Figure 5: North America Fiberglass Roving Industry Revenue Share (%), by End-user Industry 2025 & 2033
- Figure 6: North America Fiberglass Roving Industry Revenue (billion), by Country 2025 & 2033
- Figure 7: North America Fiberglass Roving Industry Revenue Share (%), by Country 2025 & 2033
- Figure 8: Europe Fiberglass Roving Industry Revenue (billion), by Type 2025 & 2033
- Figure 9: Europe Fiberglass Roving Industry Revenue Share (%), by Type 2025 & 2033
- Figure 10: Europe Fiberglass Roving Industry Revenue (billion), by End-user Industry 2025 & 2033
- Figure 11: Europe Fiberglass Roving Industry Revenue Share (%), by End-user Industry 2025 & 2033
- Figure 12: Europe Fiberglass Roving Industry Revenue (billion), by Country 2025 & 2033
- Figure 13: Europe Fiberglass Roving Industry Revenue Share (%), by Country 2025 & 2033
- Figure 14: Asia Pacific Fiberglass Roving Industry Revenue (billion), by Type 2025 & 2033
- Figure 15: Asia Pacific Fiberglass Roving Industry Revenue Share (%), by Type 2025 & 2033
- Figure 16: Asia Pacific Fiberglass Roving Industry Revenue (billion), by End-user Industry 2025 & 2033
- Figure 17: Asia Pacific Fiberglass Roving Industry Revenue Share (%), by End-user Industry 2025 & 2033
- Figure 18: Asia Pacific Fiberglass Roving Industry Revenue (billion), by Country 2025 & 2033
- Figure 19: Asia Pacific Fiberglass Roving Industry Revenue Share (%), by Country 2025 & 2033
- Figure 20: Latin America Fiberglass Roving Industry Revenue (billion), by Type 2025 & 2033
- Figure 21: Latin America Fiberglass Roving Industry Revenue Share (%), by Type 2025 & 2033
- Figure 22: Latin America Fiberglass Roving Industry Revenue (billion), by End-user Industry 2025 & 2033
- Figure 23: Latin America Fiberglass Roving Industry Revenue Share (%), by End-user Industry 2025 & 2033
- Figure 24: Latin America Fiberglass Roving Industry Revenue (billion), by Country 2025 & 2033
- Figure 25: Latin America Fiberglass Roving Industry Revenue Share (%), by Country 2025 & 2033
- Figure 26: Middle East Fiberglass Roving Industry Revenue (billion), by Type 2025 & 2033
- Figure 27: Middle East Fiberglass Roving Industry Revenue Share (%), by Type 2025 & 2033
- Figure 28: Middle East Fiberglass Roving Industry Revenue (billion), by End-user Industry 2025 & 2033
- Figure 29: Middle East Fiberglass Roving Industry Revenue Share (%), by End-user Industry 2025 & 2033
- Figure 30: Middle East Fiberglass Roving Industry Revenue (billion), by Country 2025 & 2033
- Figure 31: Middle East Fiberglass Roving Industry Revenue Share (%), by Country 2025 & 2033
List of Tables
- Table 1: Global Fiberglass Roving Industry Revenue billion Forecast, by Type 2020 & 2033
- Table 2: Global Fiberglass Roving Industry Revenue billion Forecast, by End-user Industry 2020 & 2033
- Table 3: Global Fiberglass Roving Industry Revenue billion Forecast, by Region 2020 & 2033
- Table 4: Global Fiberglass Roving Industry Revenue billion Forecast, by Type 2020 & 2033
- Table 5: Global Fiberglass Roving Industry Revenue billion Forecast, by End-user Industry 2020 & 2033
- Table 6: Global Fiberglass Roving Industry Revenue billion Forecast, by Country 2020 & 2033
- Table 7: United States Fiberglass Roving Industry Revenue (billion) Forecast, by Application 2020 & 2033
- Table 8: Canada Fiberglass Roving Industry Revenue (billion) Forecast, by Application 2020 & 2033
- Table 9: Global Fiberglass Roving Industry Revenue billion Forecast, by Type 2020 & 2033
- Table 10: Global Fiberglass Roving Industry Revenue billion Forecast, by End-user Industry 2020 & 2033
- Table 11: Global Fiberglass Roving Industry Revenue billion Forecast, by Country 2020 & 2033
- Table 12: United Kingdom Fiberglass Roving Industry Revenue (billion) Forecast, by Application 2020 & 2033
- Table 13: Germany Fiberglass Roving Industry Revenue (billion) Forecast, by Application 2020 & 2033
- Table 14: France Fiberglass Roving Industry Revenue (billion) Forecast, by Application 2020 & 2033
- Table 15: Rest of Europe Fiberglass Roving Industry Revenue (billion) Forecast, by Application 2020 & 2033
- Table 16: Global Fiberglass Roving Industry Revenue billion Forecast, by Type 2020 & 2033
- Table 17: Global Fiberglass Roving Industry Revenue billion Forecast, by End-user Industry 2020 & 2033
- Table 18: Global Fiberglass Roving Industry Revenue billion Forecast, by Country 2020 & 2033
- Table 19: China Fiberglass Roving Industry Revenue (billion) Forecast, by Application 2020 & 2033
- Table 20: India Fiberglass Roving Industry Revenue (billion) Forecast, by Application 2020 & 2033
- Table 21: Japan Fiberglass Roving Industry Revenue (billion) Forecast, by Application 2020 & 2033
- Table 22: Rest of Asia Pacific Fiberglass Roving Industry Revenue (billion) Forecast, by Application 2020 & 2033
- Table 23: Global Fiberglass Roving Industry Revenue billion Forecast, by Type 2020 & 2033
- Table 24: Global Fiberglass Roving Industry Revenue billion Forecast, by End-user Industry 2020 & 2033
- Table 25: Global Fiberglass Roving Industry Revenue billion Forecast, by Country 2020 & 2033
- Table 26: Global Fiberglass Roving Industry Revenue billion Forecast, by Type 2020 & 2033
- Table 27: Global Fiberglass Roving Industry Revenue billion Forecast, by End-user Industry 2020 & 2033
- Table 28: Global Fiberglass Roving Industry Revenue billion Forecast, by Country 2020 & 2033
Frequently Asked Questions
1. What is the projected Compound Annual Growth Rate (CAGR) of the Fiberglass Roving Industry?
The projected CAGR is approximately 8.6%.
2. Which companies are prominent players in the Fiberglass Roving Industry?
Key companies in the market include Nitto Boseki Co Limited, Saint-Gobain SA, Reliance Industries, CPIC, Taiwan Glass Industry Corporation, PFG Fiberglass Corporation, Johns Manville Corporation*List Not Exhaustive, Owens Corning, AGY Holding Corporation, China National Building Material Company Limited, Nippon Electric Glass.
3. What are the main segments of the Fiberglass Roving Industry?
The market segments include Type, End-user Industry.
4. Can you provide details about the market size?
The market size is estimated to be USD 10.37 billion as of 2022.
5. What are some drivers contributing to market growth?
; Growing Demand From the Energy & Infrastructure Domain; Anticipated Growth in Adoption From GFRP Pipes Applications.
6. What are the notable trends driving market growth?
Construction & Infrastructure is Expected to Witness Significant Growth.
7. Are there any restraints impacting market growth?
; Recycling Concerns and Dependence on End-user Uptake.
8. Can you provide examples of recent developments in the market?
N/A
9. What pricing options are available for accessing the report?
Pricing options include single-user, multi-user, and enterprise licenses priced at USD 4750, USD 5250, and USD 8750 respectively.
10. Is the market size provided in terms of value or volume?
The market size is provided in terms of value, measured in billion.
11. Are there any specific market keywords associated with the report?
Yes, the market keyword associated with the report is "Fiberglass Roving Industry," which aids in identifying and referencing the specific market segment covered.
12. How do I determine which pricing option suits my needs best?
The pricing options vary based on user requirements and access needs. Individual users may opt for single-user licenses, while businesses requiring broader access may choose multi-user or enterprise licenses for cost-effective access to the report.
13. Are there any additional resources or data provided in the Fiberglass Roving Industry report?
While the report offers comprehensive insights, it's advisable to review the specific contents or supplementary materials provided to ascertain if additional resources or data are available.
14. How can I stay updated on further developments or reports in the Fiberglass Roving Industry?
To stay informed about further developments, trends, and reports in the Fiberglass Roving Industry, consider subscribing to industry newsletters, following relevant companies and organizations, or regularly checking reputable industry news sources and publications.
Methodology
Step 1 - Identification of Relevant Samples Size from Population Database


Step 2 - Approaches for Defining Global Market Size (Value, Volume* & Price*)

Note*: In applicable scenarios
Step 3 - Data Sources
Primary Research
- Web Analytics
- Survey Reports
- Research Institute
- Latest Research Reports
- Opinion Leaders
Secondary Research
- Annual Reports
- White Paper
- Latest Press Release
- Industry Association
- Paid Database
- Investor Presentations

Step 4 - Data Triangulation
Involves using different sources of information in order to increase the validity of a study
These sources are likely to be stakeholders in a program - participants, other researchers, program staff, other community members, and so on.
Then we put all data in single framework & apply various statistical tools to find out the dynamic on the market.
During the analysis stage, feedback from the stakeholder groups would be compared to determine areas of agreement as well as areas of divergence