

Key Insights
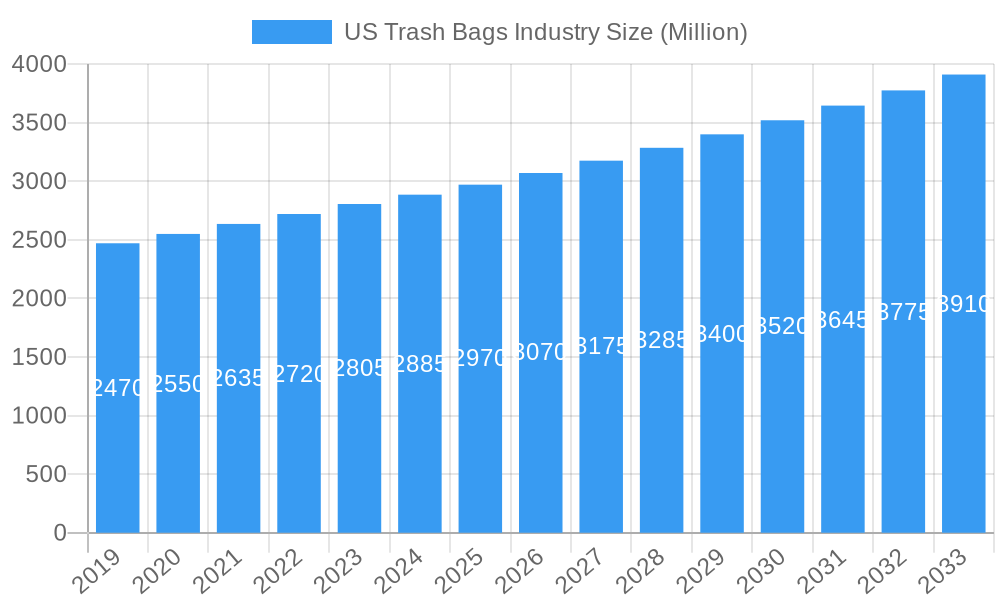
The US trash bag market is poised for steady growth, projected to reach an estimated USD 2.87 billion by 2025. This expansion is driven by a confluence of factors including increasing waste generation from both residential and commercial sectors, coupled with a rising consumer awareness regarding hygiene and waste management. The market's Compound Annual Growth Rate (CAGR) of 3.69% over the forecast period of 2025-2033 indicates a robust and sustainable trajectory. Key end-user segments, namely residential, commercial, and industrial, all contribute to this market expansion. The residential segment benefits from consistent demand owing to household waste, while the commercial sector, encompassing retail, hospitality, and healthcare, sees a significant need for efficient waste disposal solutions. Industrial applications, though potentially more specialized, also represent a stable demand base. This growth is further bolstered by innovations in product development, such as the introduction of stronger, more durable, and eco-friendlier trash bags, catering to evolving consumer preferences and regulatory pressures. The market is characterized by the presence of established players and intense competition, fostering continuous product differentiation and strategic marketing initiatives.
US Trash Bags Industry Market Size (In Billion)
While the market exhibits strong growth potential, certain restraints are present. The increasing adoption of waste-to-energy initiatives and advanced recycling technologies, alongside a growing emphasis on reducing single-use plastics and a shift towards reusable alternatives in some applications, could temper the overall demand for traditional trash bags. Furthermore, fluctuations in raw material prices, particularly for polyethylene, can impact manufacturing costs and influence pricing strategies. However, the inherent necessity of waste containment in everyday life, combined with ongoing urbanization and population growth across the United States, ensures a persistent and significant market for trash bags. The prevailing trends of sustainability and enhanced product performance will likely shape the future of the US trash bag industry, with manufacturers focusing on biodegradable options and solutions that offer superior strength and leak-proof capabilities to meet the dynamic needs of consumers and businesses alike.
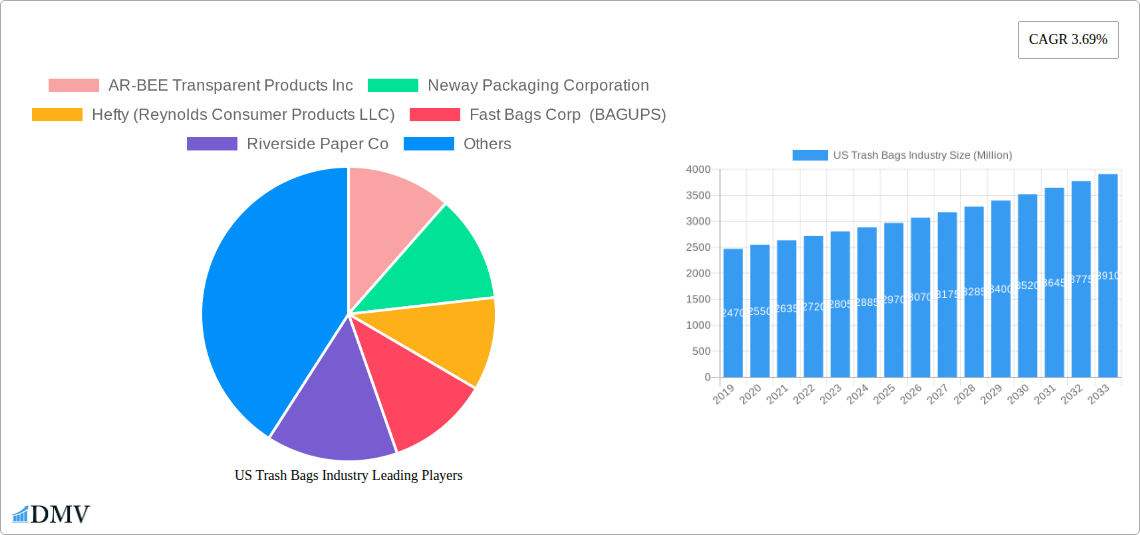
US Trash Bags Industry Company Market Share
US Trash Bags Industry Market Report: Trends, Forecasts, and Competitive Landscape (2019–2033)
This comprehensive report delves into the dynamic US Trash Bags Industry, offering an in-depth analysis of market composition, evolving trends, and strategic forecasts. Covering the study period from 2019 to 2033, with a base year of 2025, this report provides critical insights for stakeholders seeking to navigate this robust and growing market. Our analysis includes detailed breakdowns of market concentration, innovation drivers, regulatory environments, substitute products, end-user segments (Residential, Commercial, Industrial), and crucial Mergers & Acquisitions (M&A) activities. We also examine the industry's evolution, highlighting technological advancements, shifting consumer demands, and regional dominance, alongside product innovations and key growth propellers. Understanding potential obstacles and emerging opportunities is paramount, and this report equips you with the data to make informed decisions.
US Trash Bags Industry Market Composition & Trends
The US trash bags industry exhibits a moderately concentrated market, with key players like Novolex and Berry Global Inc. holding significant market share, estimated at over 30% collectively. Innovation catalysts such as the development of stronger, more tear-resistant materials, enhanced odor control technologies, and the growing demand for sustainable, compostable, and biodegradable trash bags are actively shaping the market. The regulatory landscape, particularly concerning plastic waste reduction and recycling initiatives, influences product development and material choices. Substitute products, including reusable bins with liners and localized waste management solutions, present a mild competitive pressure. End-user profiles reveal distinct needs: residential consumers prioritize convenience and affordability, commercial entities demand durability and large capacities, and industrial users require specialized, heavy-duty solutions for hazardous waste management. M&A activities have been strategic, with several consolidations aiming to expand product portfolios and geographical reach. For instance, Berry Global Inc. has been active in acquiring smaller players to bolster its market position. The M&A deal values are estimated to be in the hundreds of millions of US dollars, reflecting the industry's consolidation phase.
US Trash Bags Industry Industry Evolution
The US Trash Bags Industry has undergone a significant transformation over the historical period (2019–2024) and is poised for continued expansion through the forecast period (2025–2033). Market growth trajectories are primarily driven by population growth, increased urbanization, and rising awareness regarding hygiene and waste management. The industry has witnessed a steady compound annual growth rate (CAGR) of approximately 4.5% during the historical period, and projections indicate a continued CAGR of around 4.8% for the forecast period. Technological advancements have been central to this evolution. Innovations in material science have led to the development of thinner yet stronger films, reducing material usage and waste. Advanced manufacturing techniques have improved production efficiency, leading to cost reductions. Furthermore, the integration of antimicrobial properties and enhanced odor-locking mechanisms addresses evolving consumer demands for a cleaner and more pleasant living and working environment. Shifting consumer demands have been a critical catalyst. There's a discernible and accelerating trend towards eco-friendly alternatives. Consumers are increasingly seeking trash bags made from recycled materials, biodegradable polymers, and compostable options. This has spurred manufacturers to invest heavily in research and development for sustainable solutions. The adoption rate of these greener products has seen a substantial uptick, estimated at over 15% year-over-year in recent periods. Furthermore, convenience features, such as drawstring closures and easy-tie mechanisms, continue to be highly valued by end-users across all segments. The industrial sector, in particular, is driving demand for specialized bags with higher load capacities and improved puncture resistance, reflecting the increasing complexity of waste streams. The overall evolution indicates a market that is responsive to both technological progress and changing societal priorities, ensuring its continued relevance and growth.
Leading Regions, Countries, or Segments in US Trash Bags Industry
The Commercial segment is the undisputed leader within the US Trash Bags Industry, commanding an estimated 45% of the total market share. This dominance is fueled by a confluence of powerful drivers, including sustained economic activity, the sheer volume of businesses operating across various sectors, and stringent hygiene and waste management regulations that mandate regular disposal. The commercial segment encompasses a diverse range of end-users, from small retail establishments and restaurants to large office complexes, hospitals, hotels, and manufacturing facilities. Each of these sub-segments has unique requirements, but the overarching demand for reliable, durable, and cost-effective trash bags remains constant.
Key Drivers for Commercial Segment Dominance:
- Ubiquitous Demand: Every commercial entity generates waste, making trash bags an essential operational supply. The sheer number of businesses operating nationwide creates a constant and significant demand.
- Hygiene and Sanitation Standards: Commercial establishments, particularly those in food service, healthcare, and hospitality, are subject to strict health and safety regulations. The consistent use of trash bags is critical for maintaining a sanitary environment and preventing the spread of pathogens.
- Volume and Capacity Requirements: Commercial operations often produce larger volumes of waste compared to residential households, necessitating the use of larger capacity trash bags, often in bulk quantities. This drives higher per-unit sales volumes.
- Durability and Performance: The nature of commercial waste, which can include heavier items, sharp objects, and liquids, requires trash bags that offer superior tear strength, puncture resistance, and leak protection. This leads to a preference for higher-quality, performance-oriented products.
- Cost-Effectiveness and Bulk Purchasing: While quality is crucial, commercial buyers often benefit from bulk purchasing, negotiating favorable pricing structures that make them significant contributors to overall market revenue. This segment is highly responsive to competitive pricing for high-volume orders.
- Specialized Applications: Beyond general waste, the commercial segment includes demand for specialized bags for medical waste, hazardous materials, and recycling, further diversifying and expanding its market contribution.
In-depth analysis of the commercial segment's dominance reveals that investment trends are characterized by businesses prioritizing efficient waste management as a cost-saving and operational continuity measure. Regulatory support, while primarily focused on environmental sustainability, indirectly bolsters the demand for compliant waste disposal solutions, including high-quality trash bags. The continuous need for replenishment due to high waste generation cycles ensures a stable and predictable revenue stream for manufacturers serving this segment. While the residential segment forms a large base and the industrial segment requires specialized solutions, the consistent and high-volume demand across the vast spectrum of commercial enterprises solidifies its position as the leading segment in the US Trash Bags Industry.
US Trash Bags Industry Product Innovations
The US trash bags industry is actively innovating to meet evolving consumer and environmental demands. Key innovations include the development of advanced biodegradable and compostable trash bags, utilizing materials like corn starch and plant-based polymers, which significantly reduce plastic waste and environmental impact. Enhanced multi-layer construction techniques are yielding trash bags with superior strength, tear resistance, and odor-locking capabilities, addressing consumer concerns about bag breakage and unpleasant smells. The introduction of antimicrobial additives further elevates hygiene standards, particularly crucial for healthcare and food service applications. Furthermore, product designs are focusing on user convenience, with features like reinforced drawstring closures for secure sealing and perforated rolls for easy dispensing. These innovations are driven by a desire to provide superior performance while aligning with growing sustainability mandates and consumer preferences for healthier, more environmentally responsible products.
Propelling Factors for US Trash Bags Industry Growth
Several factors are propelling the growth of the US Trash Bags Industry. Increasing environmental awareness and stringent regulations are a major catalyst, driving demand for sustainable, biodegradable, and compostable trash bags. For instance, the growing preference for eco-friendly products is pushing manufacturers to invest in plant-based polymers and recycled content. Population growth and urbanization contribute to higher waste generation, thereby increasing the overall consumption of trash bags, especially in residential and commercial sectors. Advancements in material science and manufacturing technologies enable the production of stronger, more durable, and cost-effective trash bags, appealing to a wider range of end-users. For example, the development of thinner yet stronger films reduces material usage and transportation costs. The rising hygiene standards and healthcare concerns also play a significant role, particularly in commercial and institutional settings, fostering demand for specialized, odor-controlling, and antimicrobial trash bags.
Obstacles in the US Trash Bags Industry Market
Despite robust growth, the US Trash Bags Industry faces several obstacles. Fluctuating raw material prices, particularly for plastics like polyethylene, can impact manufacturing costs and profit margins. For example, a sudden surge in crude oil prices directly affects the cost of virgin plastic. Intensifying competition and price sensitivity among consumers and businesses, especially for standard trash bags, can put pressure on profit margins. Furthermore, evolving environmental regulations, while driving innovation, also necessitate significant investment in research and development and can lead to compliance challenges for smaller manufacturers. Supply chain disruptions, as experienced during global events, can lead to material shortages and increased logistics costs, affecting product availability and pricing. The perceived limited substitutability for certain high-performance or specialized trash bags can sometimes be challenged by emerging alternative waste management systems.
Future Opportunities in US Trash Bags Industry
The US Trash Bags Industry is poised for significant future opportunities. The growing demand for sustainable and eco-friendly products presents a prime avenue for innovation and market expansion, with an increasing consumer base willing to pay a premium for biodegradable, compostable, and recycled content trash bags. The expansion of the e-commerce sector opens new distribution channels, allowing manufacturers to reach a wider customer base directly. Furthermore, the increasing focus on circular economy principles presents opportunities for developing advanced recycling technologies for plastic films, creating a more sustainable lifecycle for trash bags. The development of smart waste management solutions, incorporating sensors and connectivity, could also lead to integrated trash bag systems, offering new functionalities and market segments. Emerging markets within the industrial sector, particularly those dealing with specialized waste streams, offer potential for niche product development and growth.
Major Players in the US Trash Bags Industry Ecosystem
- AR-BEE Transparent Products Inc
- Neway Packaging Corporation
- Hefty (Reynolds Consumer Products LLC)
- Fast Bags Corp (BAGUPS)
- Riverside Paper Co
- International Plastics Inc
- Novolex
- Berry Global Inc
- Inteplast Group
- Universal Plastic Bag Co
Key Developments in US Trash Bags Industry Industry
- January 2024: Recircle Brands launched Bagups, a revolutionary trash bag dispensing system designed for ultimate convenience. This innovation ensures a new bag is always ready for use, streamlining the replacement process. The product's environmental footprint is significantly reduced through the exclusive use of biodegradable materials, actively contributing to minimizing plastic waste and lowering the overall carbon footprint of daily waste disposal. This development signals a strong consumer and industry push towards user-friendly and sustainable waste management solutions.
Strategic US Trash Bags Industry Market Forecast
The strategic forecast for the US Trash Bags Industry is overwhelmingly positive, driven by a confluence of powerful growth catalysts and emerging opportunities. The escalating demand for sustainable and eco-friendly waste management solutions will continue to be a primary growth engine, encouraging further innovation in biodegradable and compostable materials. Population growth and ongoing urbanization ensure a sustained increase in waste generation, directly benefiting the trash bag market across residential, commercial, and industrial segments. Technological advancements in manufacturing and material science will enable the production of higher-performance, more cost-effective, and environmentally responsible products. The market is projected to witness a robust CAGR of approximately 4.8% from 2025 to 2033, with an estimated market value reaching tens of billions of US dollars by the end of the forecast period. Strategic collaborations, product diversification, and a focus on niche markets will further solidify the industry's upward trajectory.
US Trash Bags Industry Segmentation
-
1. End User
- 1.1. Residential
- 1.2. Commercial
- 1.3. Industrial
US Trash Bags Industry Segmentation By Geography
-
1. North America
- 1.1. United States
- 1.2. Canada
- 1.3. Mexico
-
2. South America
- 2.1. Brazil
- 2.2. Argentina
- 2.3. Rest of South America
-
3. Europe
- 3.1. United Kingdom
- 3.2. Germany
- 3.3. France
- 3.4. Italy
- 3.5. Spain
- 3.6. Russia
- 3.7. Benelux
- 3.8. Nordics
- 3.9. Rest of Europe
-
4. Middle East & Africa
- 4.1. Turkey
- 4.2. Israel
- 4.3. GCC
- 4.4. North Africa
- 4.5. South Africa
- 4.6. Rest of Middle East & Africa
-
5. Asia Pacific
- 5.1. China
- 5.2. India
- 5.3. Japan
- 5.4. South Korea
- 5.5. ASEAN
- 5.6. Oceania
- 5.7. Rest of Asia Pacific
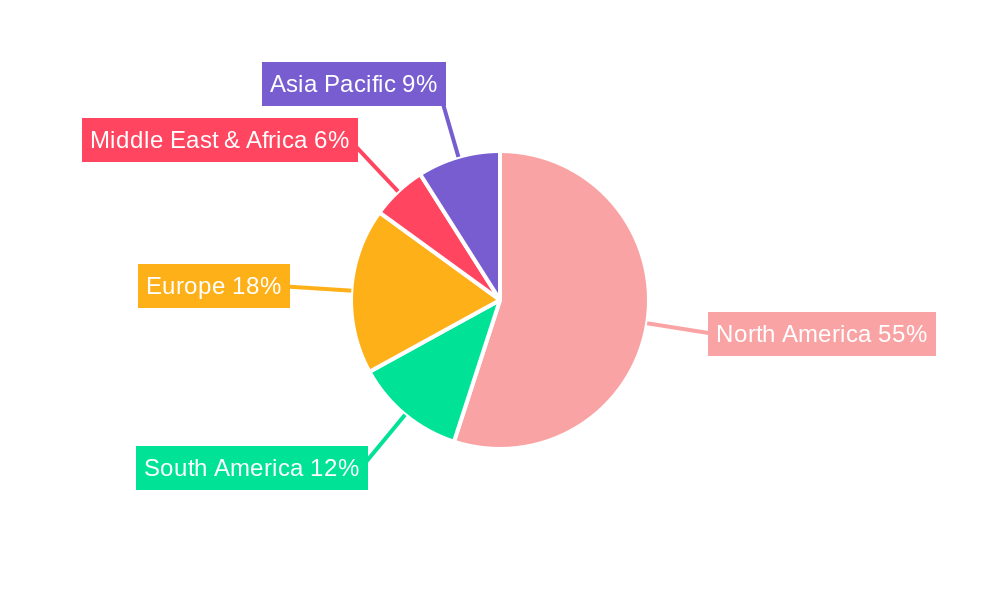
US Trash Bags Industry Regional Market Share
Geographic Coverage of US Trash Bags Industry
US Trash Bags Industry REPORT HIGHLIGHTS
| Aspects | Details |
|---|---|
| Study Period | 2020-2034 |
| Base Year | 2025 |
| Estimated Year | 2026 |
| Forecast Period | 2026-2034 |
| Historical Period | 2020-2025 |
| Growth Rate | CAGR of 3.69% from 2020-2034 |
| Segmentation |
|
Table of Contents
- 1. Introduction
- 1.1. Research Scope
- 1.2. Market Segmentation
- 1.3. Research Objective
- 1.4. Definitions and Assumptions
- 2. Executive Summary
- 2.1. Market Snapshot
- 3. Market Dynamics
- 3.1. Market Drivers
- 3.2. Market Restrains
- 3.3. Market Trends
- 3.4. Market Opportunities
- 4. Market Factor Analysis
- 4.1. Porters Five Forces
- 4.1.1. Bargaining Power of Suppliers
- 4.1.2. Bargaining Power of Buyers
- 4.1.3. Threat of New Entrants
- 4.1.4. Threat of Substitutes
- 4.1.5. Competitive Rivalry
- 4.2. PESTEL analysis
- 4.3. BCG Analysis
- 4.3.1. Stars (High Growth, High Market Share)
- 4.3.2. Cash Cows (Low Growth, High Market Share)
- 4.3.3. Question Mark (High Growth, Low Market Share)
- 4.3.4. Dogs (Low Growth, Low Market Share)
- 4.4. Ansoff Matrix Analysis
- 4.5. Supply Chain Analysis
- 4.6. Regulatory Landscape
- 4.7. Current Market Potential and Opportunity Assessment (TAM–SAM–SOM Framework)
- 4.8. DMV Analyst Note
- 4.1. Porters Five Forces
- 5. Market Analysis, Insights and Forecast 2021-2033
- 5.1. Market Analysis, Insights and Forecast - by End User
- 5.1.1. Residential
- 5.1.2. Commercial
- 5.1.3. Industrial
- 5.2. Market Analysis, Insights and Forecast - by Region
- 5.2.1. North America
- 5.2.2. South America
- 5.2.3. Europe
- 5.2.4. Middle East & Africa
- 5.2.5. Asia Pacific
- 5.1. Market Analysis, Insights and Forecast - by End User
- 6. Global US Trash Bags Industry Analysis, Insights and Forecast, 2021-2033
- 6.1. Market Analysis, Insights and Forecast - by End User
- 6.1.1. Residential
- 6.1.2. Commercial
- 6.1.3. Industrial
- 6.1. Market Analysis, Insights and Forecast - by End User
- 7. North America US Trash Bags Industry Analysis, Insights and Forecast, 2020-2032
- 7.1. Market Analysis, Insights and Forecast - by End User
- 7.1.1. Residential
- 7.1.2. Commercial
- 7.1.3. Industrial
- 7.1. Market Analysis, Insights and Forecast - by End User
- 8. South America US Trash Bags Industry Analysis, Insights and Forecast, 2020-2032
- 8.1. Market Analysis, Insights and Forecast - by End User
- 8.1.1. Residential
- 8.1.2. Commercial
- 8.1.3. Industrial
- 8.1. Market Analysis, Insights and Forecast - by End User
- 9. Europe US Trash Bags Industry Analysis, Insights and Forecast, 2020-2032
- 9.1. Market Analysis, Insights and Forecast - by End User
- 9.1.1. Residential
- 9.1.2. Commercial
- 9.1.3. Industrial
- 9.1. Market Analysis, Insights and Forecast - by End User
- 10. Middle East & Africa US Trash Bags Industry Analysis, Insights and Forecast, 2020-2032
- 10.1. Market Analysis, Insights and Forecast - by End User
- 10.1.1. Residential
- 10.1.2. Commercial
- 10.1.3. Industrial
- 10.1. Market Analysis, Insights and Forecast - by End User
- 11. Asia Pacific US Trash Bags Industry Analysis, Insights and Forecast, 2020-2032
- 11.1. Market Analysis, Insights and Forecast - by End User
- 11.1.1. Residential
- 11.1.2. Commercial
- 11.1.3. Industrial
- 11.1. Market Analysis, Insights and Forecast - by End User
- 12. Competitive Analysis
- 12.1. Company Profiles
- 12.1.1 AR-BEE Transparent Products Inc
- 12.1.1.1. Company Overview
- 12.1.1.2. Products
- 12.1.1.3. Company Financials
- 12.1.1.4. SWOT Analysis
- 12.1.2 Neway Packaging Corporation
- 12.1.2.1. Company Overview
- 12.1.2.2. Products
- 12.1.2.3. Company Financials
- 12.1.2.4. SWOT Analysis
- 12.1.3 Hefty (Reynolds Consumer Products LLC)
- 12.1.3.1. Company Overview
- 12.1.3.2. Products
- 12.1.3.3. Company Financials
- 12.1.3.4. SWOT Analysis
- 12.1.4 Fast Bags Corp (BAGUPS)
- 12.1.4.1. Company Overview
- 12.1.4.2. Products
- 12.1.4.3. Company Financials
- 12.1.4.4. SWOT Analysis
- 12.1.5 Riverside Paper Co
- 12.1.5.1. Company Overview
- 12.1.5.2. Products
- 12.1.5.3. Company Financials
- 12.1.5.4. SWOT Analysis
- 12.1.6 International Plastics Inc
- 12.1.6.1. Company Overview
- 12.1.6.2. Products
- 12.1.6.3. Company Financials
- 12.1.6.4. SWOT Analysis
- 12.1.7 Novolex
- 12.1.7.1. Company Overview
- 12.1.7.2. Products
- 12.1.7.3. Company Financials
- 12.1.7.4. SWOT Analysis
- 12.1.8 Berry Global Inc
- 12.1.8.1. Company Overview
- 12.1.8.2. Products
- 12.1.8.3. Company Financials
- 12.1.8.4. SWOT Analysis
- 12.1.9 Inteplast Group
- 12.1.9.1. Company Overview
- 12.1.9.2. Products
- 12.1.9.3. Company Financials
- 12.1.9.4. SWOT Analysis
- 12.1.10 Universal Plastic Bag Co
- 12.1.10.1. Company Overview
- 12.1.10.2. Products
- 12.1.10.3. Company Financials
- 12.1.10.4. SWOT Analysis
- 12.1.1 AR-BEE Transparent Products Inc
- 12.2. Market Entropy
- 12.2.1 Company's Key Areas Served
- 12.2.2 Recent Developments
- 12.3. Company Market Share Analysis 2025
- 12.3.1 Top 5 Companies Market Share Analysis
- 12.3.2 Top 3 Companies Market Share Analysis
- 12.4. List of Potential Customers
- 13. Research Methodology
List of Figures
- Figure 1: Global US Trash Bags Industry Revenue Breakdown (Million, %) by Region 2025 & 2033
- Figure 2: North America US Trash Bags Industry Revenue (Million), by End User 2025 & 2033
- Figure 3: North America US Trash Bags Industry Revenue Share (%), by End User 2025 & 2033
- Figure 4: North America US Trash Bags Industry Revenue (Million), by Country 2025 & 2033
- Figure 5: North America US Trash Bags Industry Revenue Share (%), by Country 2025 & 2033
- Figure 6: South America US Trash Bags Industry Revenue (Million), by End User 2025 & 2033
- Figure 7: South America US Trash Bags Industry Revenue Share (%), by End User 2025 & 2033
- Figure 8: South America US Trash Bags Industry Revenue (Million), by Country 2025 & 2033
- Figure 9: South America US Trash Bags Industry Revenue Share (%), by Country 2025 & 2033
- Figure 10: Europe US Trash Bags Industry Revenue (Million), by End User 2025 & 2033
- Figure 11: Europe US Trash Bags Industry Revenue Share (%), by End User 2025 & 2033
- Figure 12: Europe US Trash Bags Industry Revenue (Million), by Country 2025 & 2033
- Figure 13: Europe US Trash Bags Industry Revenue Share (%), by Country 2025 & 2033
- Figure 14: Middle East & Africa US Trash Bags Industry Revenue (Million), by End User 2025 & 2033
- Figure 15: Middle East & Africa US Trash Bags Industry Revenue Share (%), by End User 2025 & 2033
- Figure 16: Middle East & Africa US Trash Bags Industry Revenue (Million), by Country 2025 & 2033
- Figure 17: Middle East & Africa US Trash Bags Industry Revenue Share (%), by Country 2025 & 2033
- Figure 18: Asia Pacific US Trash Bags Industry Revenue (Million), by End User 2025 & 2033
- Figure 19: Asia Pacific US Trash Bags Industry Revenue Share (%), by End User 2025 & 2033
- Figure 20: Asia Pacific US Trash Bags Industry Revenue (Million), by Country 2025 & 2033
- Figure 21: Asia Pacific US Trash Bags Industry Revenue Share (%), by Country 2025 & 2033
List of Tables
- Table 1: Global US Trash Bags Industry Revenue Million Forecast, by End User 2020 & 2033
- Table 2: Global US Trash Bags Industry Revenue Million Forecast, by Region 2020 & 2033
- Table 3: Global US Trash Bags Industry Revenue Million Forecast, by End User 2020 & 2033
- Table 4: Global US Trash Bags Industry Revenue Million Forecast, by Country 2020 & 2033
- Table 5: United States US Trash Bags Industry Revenue (Million) Forecast, by Application 2020 & 2033
- Table 6: Canada US Trash Bags Industry Revenue (Million) Forecast, by Application 2020 & 2033
- Table 7: Mexico US Trash Bags Industry Revenue (Million) Forecast, by Application 2020 & 2033
- Table 8: Global US Trash Bags Industry Revenue Million Forecast, by End User 2020 & 2033
- Table 9: Global US Trash Bags Industry Revenue Million Forecast, by Country 2020 & 2033
- Table 10: Brazil US Trash Bags Industry Revenue (Million) Forecast, by Application 2020 & 2033
- Table 11: Argentina US Trash Bags Industry Revenue (Million) Forecast, by Application 2020 & 2033
- Table 12: Rest of South America US Trash Bags Industry Revenue (Million) Forecast, by Application 2020 & 2033
- Table 13: Global US Trash Bags Industry Revenue Million Forecast, by End User 2020 & 2033
- Table 14: Global US Trash Bags Industry Revenue Million Forecast, by Country 2020 & 2033
- Table 15: United Kingdom US Trash Bags Industry Revenue (Million) Forecast, by Application 2020 & 2033
- Table 16: Germany US Trash Bags Industry Revenue (Million) Forecast, by Application 2020 & 2033
- Table 17: France US Trash Bags Industry Revenue (Million) Forecast, by Application 2020 & 2033
- Table 18: Italy US Trash Bags Industry Revenue (Million) Forecast, by Application 2020 & 2033
- Table 19: Spain US Trash Bags Industry Revenue (Million) Forecast, by Application 2020 & 2033
- Table 20: Russia US Trash Bags Industry Revenue (Million) Forecast, by Application 2020 & 2033
- Table 21: Benelux US Trash Bags Industry Revenue (Million) Forecast, by Application 2020 & 2033
- Table 22: Nordics US Trash Bags Industry Revenue (Million) Forecast, by Application 2020 & 2033
- Table 23: Rest of Europe US Trash Bags Industry Revenue (Million) Forecast, by Application 2020 & 2033
- Table 24: Global US Trash Bags Industry Revenue Million Forecast, by End User 2020 & 2033
- Table 25: Global US Trash Bags Industry Revenue Million Forecast, by Country 2020 & 2033
- Table 26: Turkey US Trash Bags Industry Revenue (Million) Forecast, by Application 2020 & 2033
- Table 27: Israel US Trash Bags Industry Revenue (Million) Forecast, by Application 2020 & 2033
- Table 28: GCC US Trash Bags Industry Revenue (Million) Forecast, by Application 2020 & 2033
- Table 29: North Africa US Trash Bags Industry Revenue (Million) Forecast, by Application 2020 & 2033
- Table 30: South Africa US Trash Bags Industry Revenue (Million) Forecast, by Application 2020 & 2033
- Table 31: Rest of Middle East & Africa US Trash Bags Industry Revenue (Million) Forecast, by Application 2020 & 2033
- Table 32: Global US Trash Bags Industry Revenue Million Forecast, by End User 2020 & 2033
- Table 33: Global US Trash Bags Industry Revenue Million Forecast, by Country 2020 & 2033
- Table 34: China US Trash Bags Industry Revenue (Million) Forecast, by Application 2020 & 2033
- Table 35: India US Trash Bags Industry Revenue (Million) Forecast, by Application 2020 & 2033
- Table 36: Japan US Trash Bags Industry Revenue (Million) Forecast, by Application 2020 & 2033
- Table 37: South Korea US Trash Bags Industry Revenue (Million) Forecast, by Application 2020 & 2033
- Table 38: ASEAN US Trash Bags Industry Revenue (Million) Forecast, by Application 2020 & 2033
- Table 39: Oceania US Trash Bags Industry Revenue (Million) Forecast, by Application 2020 & 2033
- Table 40: Rest of Asia Pacific US Trash Bags Industry Revenue (Million) Forecast, by Application 2020 & 2033
Frequently Asked Questions
1. What is the projected Compound Annual Growth Rate (CAGR) of the US Trash Bags Industry?
The projected CAGR is approximately 3.69%.
2. Which companies are prominent players in the US Trash Bags Industry?
Key companies in the market include AR-BEE Transparent Products Inc, Neway Packaging Corporation, Hefty (Reynolds Consumer Products LLC), Fast Bags Corp (BAGUPS), Riverside Paper Co, International Plastics Inc, Novolex, Berry Global Inc, Inteplast Group, Universal Plastic Bag Co.
3. What are the main segments of the US Trash Bags Industry?
The market segments include End User.
4. Can you provide details about the market size?
The market size is estimated to be USD 2.87 Million as of 2022.
5. What are some drivers contributing to market growth?
Growing Demand for Compostable and Oxo-biodegradable Bags; Growing Awareness About Hygiene Among People.
6. What are the notable trends driving market growth?
The Residential Sector Holds the Largest Market Share.
7. Are there any restraints impacting market growth?
Unforeseen Consequences of Reusing Plastic Packaging and Health Related Concerns.
8. Can you provide examples of recent developments in the market?
January 2024: Recircle Brands, a visionary company in the eco-friendly products sector, announced the launch of Bagups, a groundbreaking trash bag dispensing system. Its unique design ensures that a new bag is always ready for use, eliminating the inconvenience of traditional trash bag replacement. The product's environmental impact is significantly reduced by using biodegradable materials, minimizing plastic waste, and reducing the overall carbon footprint.
9. What pricing options are available for accessing the report?
Pricing options include single-user, multi-user, and enterprise licenses priced at USD 3800, USD 4500, and USD 5800 respectively.
10. Is the market size provided in terms of value or volume?
The market size is provided in terms of value, measured in Million.
11. Are there any specific market keywords associated with the report?
Yes, the market keyword associated with the report is "US Trash Bags Industry," which aids in identifying and referencing the specific market segment covered.
12. How do I determine which pricing option suits my needs best?
The pricing options vary based on user requirements and access needs. Individual users may opt for single-user licenses, while businesses requiring broader access may choose multi-user or enterprise licenses for cost-effective access to the report.
13. Are there any additional resources or data provided in the US Trash Bags Industry report?
While the report offers comprehensive insights, it's advisable to review the specific contents or supplementary materials provided to ascertain if additional resources or data are available.
14. How can I stay updated on further developments or reports in the US Trash Bags Industry?
To stay informed about further developments, trends, and reports in the US Trash Bags Industry, consider subscribing to industry newsletters, following relevant companies and organizations, or regularly checking reputable industry news sources and publications.
Methodology
Step 1 - Identification of Relevant Samples Size from Population Database


Step 2 - Approaches for Defining Global Market Size (Value, Volume* & Price*)

Note*: In applicable scenarios
Step 3 - Data Sources
Primary Research
- Web Analytics
- Survey Reports
- Research Institute
- Latest Research Reports
- Opinion Leaders
Secondary Research
- Annual Reports
- White Paper
- Latest Press Release
- Industry Association
- Paid Database
- Investor Presentations

Step 4 - Data Triangulation
Involves using different sources of information in order to increase the validity of a study
These sources are likely to be stakeholders in a program - participants, other researchers, program staff, other community members, and so on.
Then we put all data in single framework & apply various statistical tools to find out the dynamic on the market.
During the analysis stage, feedback from the stakeholder groups would be compared to determine areas of agreement as well as areas of divergence