

Key Insights
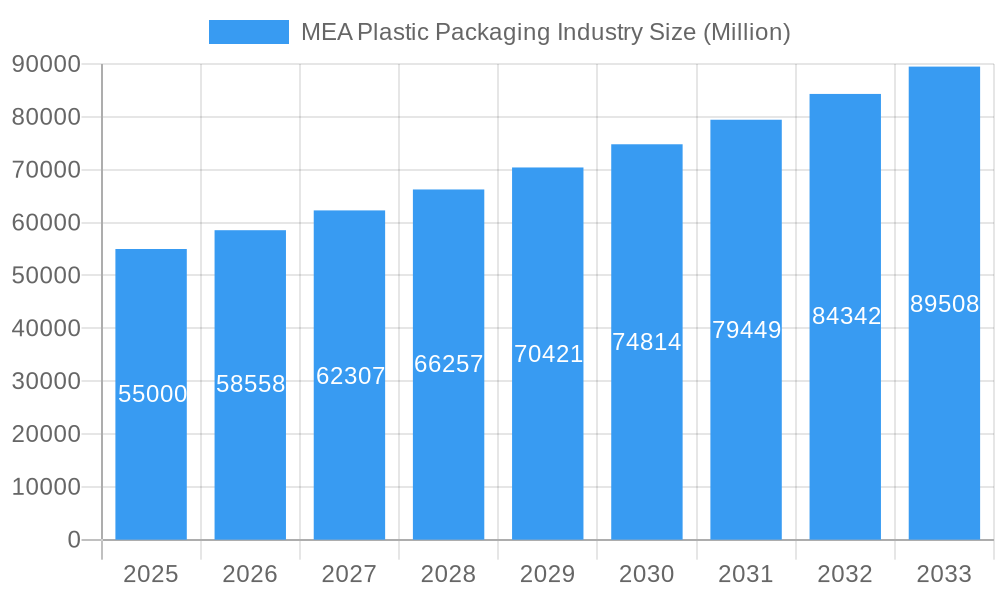
The Middle East and Africa (MEA) plastic packaging market is set for substantial growth, projected to reach $4.65 million by 2025, with a compound annual growth rate (CAGR) of 3.76% through 2033. This expansion is driven by demographic shifts, rising disposable incomes, and increasing consumer demand for packaged goods. The food and beverage sector is a primary driver, requiring diverse packaging solutions. The healthcare and pharmaceutical industries are also experiencing significant growth, boosting demand for compliant plastic packaging. The cosmetics and personal care segment further contributes to this trend.
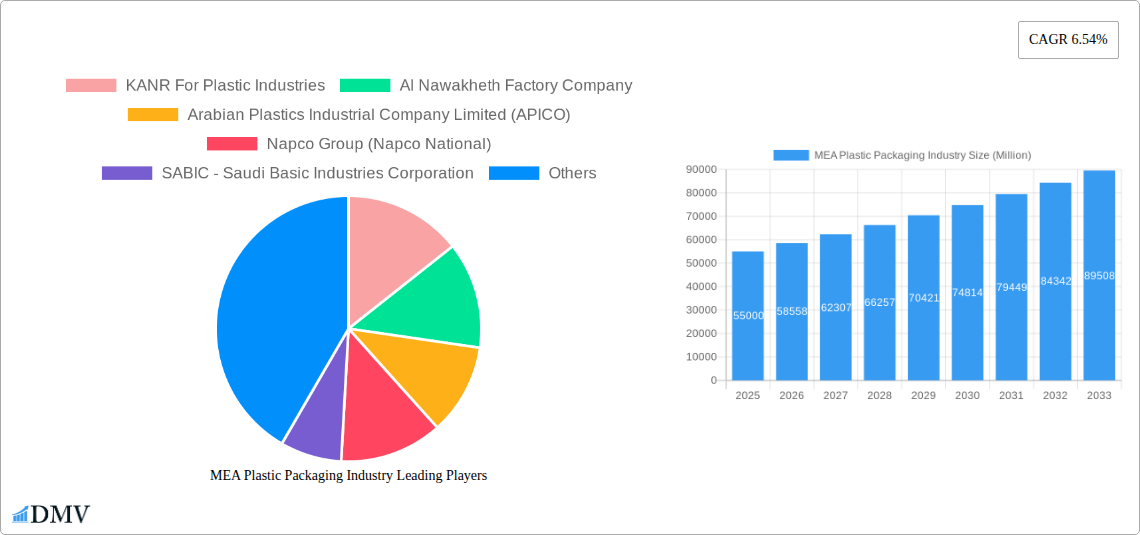
MEA Plastic Packaging Industry Market Size (In Million)
Key markets include the United Arab Emirates and Saudi Arabia, supported by economic diversification and robust retail infrastructure. Egypt and South Africa are also critical growth areas, leveraging large populations and established sectors. Untapped potential exists in emerging economies. Market challenges include raw material price volatility, environmental regulations, and growing concerns over plastic waste, which are encouraging the adoption of sustainable and recyclable packaging solutions. Industry players are investing in innovative technologies and materials to address these challenges and seize market opportunities.
MEA Plastic Packaging Industry Company Market Share
MEA Plastic Packaging Industry Market Composition & Trends
The MEA Plastic Packaging Industry is a dynamic and evolving sector, characterized by a moderate level of market concentration with key players like SABIC, Napco Group, and Zamil Plastic Industries Co. dominating market share. Innovation is a significant catalyst, driven by increasing demand for sustainable packaging solutions and advancements in material science. The regulatory landscape is also playing a crucial role, with governments across the region implementing policies aimed at reducing plastic waste and promoting recycling. For instance, countries like Saudi Arabia are investing heavily in petrochemical infrastructure, supporting the growth of plastic resin production, a fundamental input for packaging. Substitute products, primarily paper and glass, pose a challenge but are often outcompeted on cost and performance in many applications. End-user profiles are diverse, with the food and beverage sector accounting for the largest share, followed by healthcare and personal care. Mergers and acquisitions (M&A) activity is on the rise as companies seek to expand their market reach and consolidate their positions. M&A deal values are projected to reach an estimated $XXX Million by 2025, reflecting strategic consolidation.
- Market Share Distribution:
- Leading Players (SABIC, Napco Group, Zamil Plastic): XX%
- Other Major Companies: YY%
- Fragmented Market Segments: ZZ%
- Key M&A Deal Values (Estimated): $XXX Million by 2025
MEA Plastic Packaging Industry Industry Evolution
The MEA Plastic Packaging Industry has witnessed remarkable growth and transformation over the historical period (2019-2024) and is poised for significant expansion through the forecast period (2025-2033). This evolution is deeply rooted in the region's burgeoning economies, a rapidly expanding population, and a shift in consumer preferences towards convenience and packaged goods. The industry has seen a compound annual growth rate (CAGR) of approximately XX% during the historical period, a trajectory expected to continue with an estimated XX% CAGR from 2025 to 2033. This sustained growth is fueled by increasing disposable incomes across key markets like Saudi Arabia and the UAE, leading to higher consumption of packaged food, beverages, and personal care items.
Technological advancements have been instrumental in shaping this industry's trajectory. Manufacturers are increasingly adopting sophisticated machinery for producing high-barrier films, advanced molding techniques for rigid packaging, and innovative printing technologies for enhanced branding. The adoption of lightweighting strategies to reduce material consumption and enhance sustainability is also gaining traction. Furthermore, the integration of smart packaging solutions, such as those incorporating QR codes for traceability and enhanced consumer engagement, is an emerging trend.
Shifting consumer demands are a primary driver of this evolution. There is a growing awareness regarding environmental sustainability, prompting a demand for recyclable, compostable, and biodegradable plastic packaging. This has spurred significant investment in research and development for alternative materials and improved recycling infrastructure. The convenience factor associated with plastic packaging, especially for single-serve portions and on-the-go consumption, continues to be a strong selling point, particularly among the younger demographic. The e-commerce boom has also presented a new avenue for growth, requiring specialized and robust packaging solutions to ensure product integrity during transit. The industry's ability to adapt to these evolving demands, coupled with ongoing investments in capacity and technology, will define its future landscape.
Leading Regions, Countries, or Segments in MEA Plastic Packaging Industry
The MEA Plastic Packaging Industry landscape is dominated by Saudi Arabia and the United Arab Emirates due to a confluence of factors, including strong economic growth, significant petrochemical feedstock availability, and supportive government initiatives driving industrial development. These two nations are not only major consumers but also pivotal production hubs.
Dominance Factors in Saudi Arabia and the UAE:
- Robust Petrochemical Industry: Both countries benefit from vast oil and gas reserves, which translate into readily available and competitively priced raw materials like Polyethylene (PE), Polypropylene (PP), and Polyethylene Terephthalate (PET). This vertical integration provides a significant cost advantage for plastic packaging manufacturers.
- Large and Growing Consumer Markets: A substantial and rapidly urbanizing population, coupled with increasing disposable incomes, fuels demand across all end-user industries, especially food, beverage, and healthcare.
- Government Support and Visionary Policies: Initiatives like Saudi Vision 2030 and the UAE's economic diversification plans actively encourage industrial investment, manufacturing, and export growth, including in the packaging sector. This often includes incentives for establishing advanced manufacturing facilities and adopting sustainable practices.
- Strategic Location and Trade Hubs: The UAE, in particular, serves as a critical logistics and trade hub, facilitating efficient import of specialized materials and export of finished plastic packaging products to Africa and beyond.
Key Segments Driving Dominance:
- Packaging Type:
- Rigid Packaging:
- By Material: Polyethylene (PE) and Polypropylene (PP) dominate due to their versatility, cost-effectiveness, and wide range of applications. PET is crucial for beverage bottles.
- By End-user Industry: Food and Beverage packaging constitute the largest share, driven by the demand for fresh produce, dairy, and processed food products. Healthcare and Pharmaceutical packaging is also a significant and growing segment, demanding high standards of safety and containment.
- Flexible Packaging:
- By Material: Polyethene (PE) and Bi-orientated Polypropylene (BOPP) are widely used for their excellent barrier properties, printability, and cost-efficiency, particularly in food packaging.
- Rigid Packaging:
- Product:
- Bottles and Jars: Crucial for the beverage, food, and personal care industries.
- Pouches: Growing in popularity for snacks, pet food, and condiments due to their convenience and lightweight nature.
- Tubs, Cups, Bowls, and Trays: Essential for dairy products, ready-to-eat meals, and fresh produce.
- Geography: While Saudi Arabia and UAE lead, Egypt and South Africa represent significant emerging markets with substantial growth potential, driven by their large populations and developing economies. The "Rest of Middle East and Africa" encompasses a diverse range of countries with varying levels of market maturity and specific regional demands.
Investment trends are heavily concentrated in Saudi Arabia and the UAE, with significant capital flowing into expanding production capacities for key resins and packaging formats. Regulatory support, particularly concerning waste management and the promotion of circular economy principles, is gradually shaping investment decisions and product development across the region, encouraging the adoption of more sustainable materials and processes.
MEA Plastic Packaging Industry Product Innovations
Product innovation in the MEA Plastic Packaging Industry is increasingly focused on sustainability, functionality, and enhanced consumer experience. Manufacturers are actively developing lightweight yet durable packaging solutions made from recycled content, such as SABIC's Trucircle™ portfolio, which offers certified circular polyolefins. Innovations include advanced multilayer films with improved barrier properties to extend shelf life for food products, and the development of bio-based or compostable plastics to meet growing environmental concerns. Smart packaging features, like embedded QR codes for traceability and interactive consumer engagement, are also emerging. Performance metrics are being optimized for increased strength, reduced material usage, and enhanced printability, contributing to both cost-effectiveness and brand appeal.
Propelling Factors for MEA Plastic Packaging Industry Growth
Several key factors are propelling the MEA Plastic Packaging Industry forward.
- Economic Growth and Urbanization: Rising disposable incomes and expanding urban populations across the Middle East and Africa are increasing demand for packaged goods, from food and beverages to personal care and healthcare products.
- Petrochemical Abundance: The region's rich reserves of oil and gas provide a steady and cost-effective supply of raw materials, giving local manufacturers a competitive edge.
- E-commerce Expansion: The rapid growth of online retail necessitates robust and versatile packaging solutions to ensure product safety and integrity during shipping.
- Technological Advancements: Innovations in material science, manufacturing processes, and sustainable packaging solutions are driving efficiency, product quality, and environmental responsibility.
Obstacles in the MEA Plastic Packaging Industry Market
Despite robust growth, the MEA Plastic Packaging Industry faces several obstacles.
- Regulatory Scrutiny and Environmental Concerns: Increasing global and local pressure to reduce plastic waste and single-use plastics can lead to stricter regulations, potential bans, and a need for significant investment in alternative materials and recycling infrastructure.
- Supply Chain Volatility: Fluctuations in the price and availability of petrochemical feedstocks, driven by global energy markets, can impact production costs and profitability. Geopolitical instability can also disrupt supply chains.
- Limited Recycling Infrastructure: In many parts of the region, underdeveloped waste management and recycling infrastructure hinders the effective collection and reprocessing of plastic waste, impacting the circular economy initiatives.
- Competition from Substitutes: While plastic often offers superior performance and cost-effectiveness, increasing consumer and regulatory preference for alternatives like paper and glass in certain applications presents a competitive challenge.
Future Opportunities in MEA Plastic Packaging Industry
Emerging opportunities for the MEA Plastic Packaging Industry are abundant, particularly in the realm of sustainable solutions. The growing demand for recycled content and bio-based plastics presents a significant avenue for innovation and market leadership. Expanding into untapped African markets, with their growing populations and increasing demand for packaged goods, offers substantial growth potential. Furthermore, the development and adoption of advanced functional packaging, such as active and intelligent packaging that extends shelf life or monitors product integrity, will cater to evolving consumer and industry needs. The integration of digital technologies for supply chain optimization and enhanced traceability also presents promising avenues.
Major Players in the MEA Plastic Packaging Industry Ecosystem
- KANR For Plastic Industries
- Al Nawakheth Factory Company
- Arabian Plastics Industrial Company Limited (APICO)
- Napco Group (Napco National)
- SABIC - Saudi Basic Industries Corporation
- Zamil Plastic Industries Co
- Sealed Air Corporation (Sealed Air Saudi Arabia)
- Takween Advanced Industries
- AL-Ghandoura Co Manuf Plastic GhanPlast)
- Saudi Arabian Packaging Industry WLL (SAPIN)
- Saudi Plastic Factory Company
- Arnon Plastic Industry Co Ltd
- Plastico SPS
- Coloredsun
- National Plastic Factory LLC
- Packaging Products Company (PPC)
Key Developments in MEA Plastic Packaging Industry Industry
- June 2022: Sabic, a global leader in the chemical industry, joined forces with Heinz, Tesco, and Berry in an innovative recycling trial in the United Kingdom designed to close the loop on soft plastic food packaging. Flexible plastic packaging collected from Tesco stores has been used to produce certified circular polypropylene (PP) from Sabic's Trucircle portfolio for microwavable Heinz Beanz Snap Pots, made from 39% recycled soft plastic. Consumers are encouraged to return the soft plastic packaging to collection points at Tesco stores. This development highlights a significant stride towards a circular economy for plastic packaging and demonstrates industry collaboration on advanced recycling technologies.
Strategic MEA Plastic Packaging Industry Market Forecast
The strategic forecast for the MEA Plastic Packaging Industry points towards continued robust growth, driven by a confluence of factors. The increasing adoption of sustainable packaging solutions, including the use of recycled and bio-based materials, will be a major growth catalyst, aligning with global environmental trends and local regulatory pressures. Significant investments in advanced manufacturing technologies, such as high-barrier films and intelligent packaging, will further enhance product offerings and market competitiveness. The expanding middle class across the region, coupled with the burgeoning e-commerce sector, will sustain a strong demand for a diverse range of plastic packaging products. Emerging markets within Africa present a substantial opportunity for expansion, offering high growth potential for market players who can adapt to local needs and navigate logistical challenges. Overall, the market potential remains significant, with a focus on innovation, sustainability, and strategic market penetration.
MEA Plastic Packaging Industry Segmentation
-
1. Packaging Type
-
1.1. Rigid
-
1.1.1. By Material
- 1.1.1.1. Polyethylene (PE)
- 1.1.1.2. Polyethylene Terephthalate (PET)
- 1.1.1.3. Polypropylene (PP)
- 1.1.1.4. Polystyrene (PS) and Expanded Polystyrene (EPS)
- 1.1.1.5. Polyvinyl Chloride (PVC)
-
1.1.2. By End-user Industry
- 1.1.2.1. Food
- 1.1.2.2. Beverage
- 1.1.2.3. Healthcare and Pharmaceutical
- 1.1.2.4. Cosmetics and Personal Care
- 1.1.2.5. Other End-user Industries
-
1.1.1. By Material
-
1.2. Flexible
- 1.2.1. Polyethene (PE)
- 1.2.2. Bi-orientated Polypropylene (BOPP)
- 1.2.3. Cast Polypropylene (CPP)
- 1.2.4. Other Flexible Plastic Packaging Materials
-
1.1. Rigid
-
2. Product
- 2.1. Bottles and Jars
- 2.2. Tubs, Cups, Bowls, and Trays
- 2.3. Intermediate Bulk Containers
- 2.4. Pouches
- 2.5. Other Products
-
3. Geography
- 3.1. United Arab Emirates
- 3.2. Saudi Arabia
- 3.3. Egypt
- 3.4. South Africa
- 3.5. Rest of Middle East and Africa
MEA Plastic Packaging Industry Segmentation By Geography
- 1. United Arab Emirates
- 2. Saudi Arabia
- 3. Egypt
- 4. South Africa
- 5. Rest of Middle East and Africa
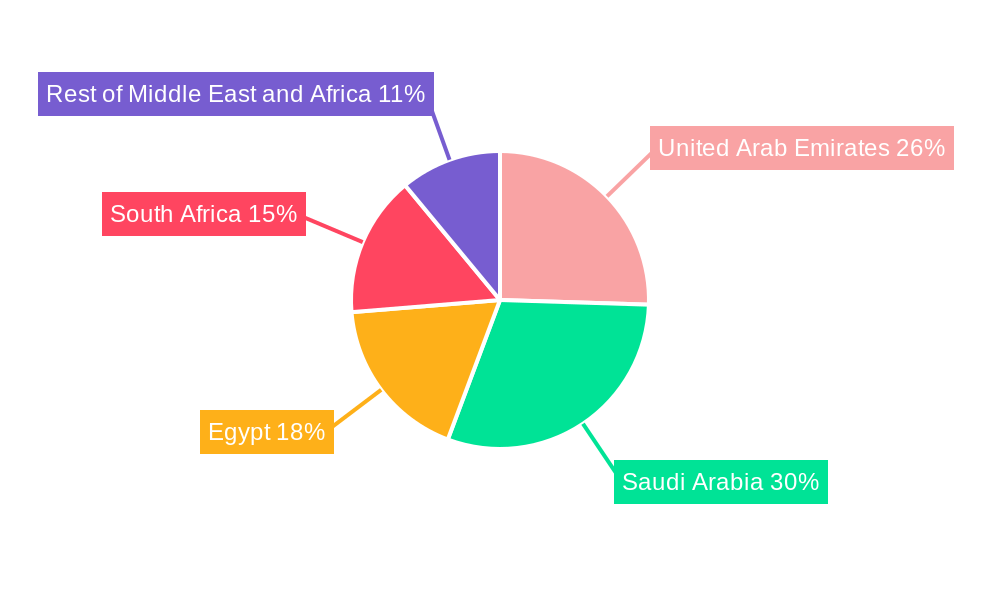
MEA Plastic Packaging Industry Regional Market Share
Geographic Coverage of MEA Plastic Packaging Industry
MEA Plastic Packaging Industry REPORT HIGHLIGHTS
| Aspects | Details |
|---|---|
| Study Period | 2020-2034 |
| Base Year | 2025 |
| Estimated Year | 2026 |
| Forecast Period | 2026-2034 |
| Historical Period | 2020-2025 |
| Growth Rate | CAGR of 3.76% from 2020-2034 |
| Segmentation |
|
Table of Contents
- 1. Introduction
- 1.1. Research Scope
- 1.2. Market Segmentation
- 1.3. Research Objective
- 1.4. Definitions and Assumptions
- 2. Executive Summary
- 2.1. Market Snapshot
- 3. Market Dynamics
- 3.1. Market Drivers
- 3.2. Market Restrains
- 3.3. Market Trends
- 3.4. Market Opportunities
- 4. Market Factor Analysis
- 4.1. Porters Five Forces
- 4.1.1. Bargaining Power of Suppliers
- 4.1.2. Bargaining Power of Buyers
- 4.1.3. Threat of New Entrants
- 4.1.4. Threat of Substitutes
- 4.1.5. Competitive Rivalry
- 4.2. PESTEL analysis
- 4.3. BCG Analysis
- 4.3.1. Stars (High Growth, High Market Share)
- 4.3.2. Cash Cows (Low Growth, High Market Share)
- 4.3.3. Question Mark (High Growth, Low Market Share)
- 4.3.4. Dogs (Low Growth, Low Market Share)
- 4.4. Ansoff Matrix Analysis
- 4.5. Supply Chain Analysis
- 4.6. Regulatory Landscape
- 4.7. Current Market Potential and Opportunity Assessment (TAM–SAM–SOM Framework)
- 4.8. DMV Analyst Note
- 4.1. Porters Five Forces
- 5. Market Analysis, Insights and Forecast 2021-2033
- 5.1. Market Analysis, Insights and Forecast - by Packaging Type
- 5.1.1. Rigid
- 5.1.1.1. By Material
- 5.1.1.1.1. Polyethylene (PE)
- 5.1.1.1.2. Polyethylene Terephthalate (PET)
- 5.1.1.1.3. Polypropylene (PP)
- 5.1.1.1.4. Polystyrene (PS) and Expanded Polystyrene (EPS)
- 5.1.1.1.5. Polyvinyl Chloride (PVC)
- 5.1.1.2. By End-user Industry
- 5.1.1.2.1. Food
- 5.1.1.2.2. Beverage
- 5.1.1.2.3. Healthcare and Pharmaceutical
- 5.1.1.2.4. Cosmetics and Personal Care
- 5.1.1.2.5. Other End-user Industries
- 5.1.1.1. By Material
- 5.1.2. Flexible
- 5.1.2.1. Polyethene (PE)
- 5.1.2.2. Bi-orientated Polypropylene (BOPP)
- 5.1.2.3. Cast Polypropylene (CPP)
- 5.1.2.4. Other Flexible Plastic Packaging Materials
- 5.1.1. Rigid
- 5.2. Market Analysis, Insights and Forecast - by Product
- 5.2.1. Bottles and Jars
- 5.2.2. Tubs, Cups, Bowls, and Trays
- 5.2.3. Intermediate Bulk Containers
- 5.2.4. Pouches
- 5.2.5. Other Products
- 5.3. Market Analysis, Insights and Forecast - by Geography
- 5.3.1. United Arab Emirates
- 5.3.2. Saudi Arabia
- 5.3.3. Egypt
- 5.3.4. South Africa
- 5.3.5. Rest of Middle East and Africa
- 5.4. Market Analysis, Insights and Forecast - by Region
- 5.4.1. United Arab Emirates
- 5.4.2. Saudi Arabia
- 5.4.3. Egypt
- 5.4.4. South Africa
- 5.4.5. Rest of Middle East and Africa
- 5.1. Market Analysis, Insights and Forecast - by Packaging Type
- 6. Global MEA Plastic Packaging Industry Analysis, Insights and Forecast, 2021-2033
- 6.1. Market Analysis, Insights and Forecast - by Packaging Type
- 6.1.1. Rigid
- 6.1.1.1. By Material
- 6.1.1.1.1. Polyethylene (PE)
- 6.1.1.1.2. Polyethylene Terephthalate (PET)
- 6.1.1.1.3. Polypropylene (PP)
- 6.1.1.1.4. Polystyrene (PS) and Expanded Polystyrene (EPS)
- 6.1.1.1.5. Polyvinyl Chloride (PVC)
- 6.1.1.2. By End-user Industry
- 6.1.1.2.1. Food
- 6.1.1.2.2. Beverage
- 6.1.1.2.3. Healthcare and Pharmaceutical
- 6.1.1.2.4. Cosmetics and Personal Care
- 6.1.1.2.5. Other End-user Industries
- 6.1.1.1. By Material
- 6.1.2. Flexible
- 6.1.2.1. Polyethene (PE)
- 6.1.2.2. Bi-orientated Polypropylene (BOPP)
- 6.1.2.3. Cast Polypropylene (CPP)
- 6.1.2.4. Other Flexible Plastic Packaging Materials
- 6.1.1. Rigid
- 6.2. Market Analysis, Insights and Forecast - by Product
- 6.2.1. Bottles and Jars
- 6.2.2. Tubs, Cups, Bowls, and Trays
- 6.2.3. Intermediate Bulk Containers
- 6.2.4. Pouches
- 6.2.5. Other Products
- 6.3. Market Analysis, Insights and Forecast - by Geography
- 6.3.1. United Arab Emirates
- 6.3.2. Saudi Arabia
- 6.3.3. Egypt
- 6.3.4. South Africa
- 6.3.5. Rest of Middle East and Africa
- 6.1. Market Analysis, Insights and Forecast - by Packaging Type
- 7. United Arab Emirates MEA Plastic Packaging Industry Analysis, Insights and Forecast, 2020-2032
- 7.1. Market Analysis, Insights and Forecast - by Packaging Type
- 7.1.1. Rigid
- 7.1.1.1. By Material
- 7.1.1.1.1. Polyethylene (PE)
- 7.1.1.1.2. Polyethylene Terephthalate (PET)
- 7.1.1.1.3. Polypropylene (PP)
- 7.1.1.1.4. Polystyrene (PS) and Expanded Polystyrene (EPS)
- 7.1.1.1.5. Polyvinyl Chloride (PVC)
- 7.1.1.2. By End-user Industry
- 7.1.1.2.1. Food
- 7.1.1.2.2. Beverage
- 7.1.1.2.3. Healthcare and Pharmaceutical
- 7.1.1.2.4. Cosmetics and Personal Care
- 7.1.1.2.5. Other End-user Industries
- 7.1.1.1. By Material
- 7.1.2. Flexible
- 7.1.2.1. Polyethene (PE)
- 7.1.2.2. Bi-orientated Polypropylene (BOPP)
- 7.1.2.3. Cast Polypropylene (CPP)
- 7.1.2.4. Other Flexible Plastic Packaging Materials
- 7.1.1. Rigid
- 7.2. Market Analysis, Insights and Forecast - by Product
- 7.2.1. Bottles and Jars
- 7.2.2. Tubs, Cups, Bowls, and Trays
- 7.2.3. Intermediate Bulk Containers
- 7.2.4. Pouches
- 7.2.5. Other Products
- 7.3. Market Analysis, Insights and Forecast - by Geography
- 7.3.1. United Arab Emirates
- 7.3.2. Saudi Arabia
- 7.3.3. Egypt
- 7.3.4. South Africa
- 7.3.5. Rest of Middle East and Africa
- 7.1. Market Analysis, Insights and Forecast - by Packaging Type
- 8. Saudi Arabia MEA Plastic Packaging Industry Analysis, Insights and Forecast, 2020-2032
- 8.1. Market Analysis, Insights and Forecast - by Packaging Type
- 8.1.1. Rigid
- 8.1.1.1. By Material
- 8.1.1.1.1. Polyethylene (PE)
- 8.1.1.1.2. Polyethylene Terephthalate (PET)
- 8.1.1.1.3. Polypropylene (PP)
- 8.1.1.1.4. Polystyrene (PS) and Expanded Polystyrene (EPS)
- 8.1.1.1.5. Polyvinyl Chloride (PVC)
- 8.1.1.2. By End-user Industry
- 8.1.1.2.1. Food
- 8.1.1.2.2. Beverage
- 8.1.1.2.3. Healthcare and Pharmaceutical
- 8.1.1.2.4. Cosmetics and Personal Care
- 8.1.1.2.5. Other End-user Industries
- 8.1.1.1. By Material
- 8.1.2. Flexible
- 8.1.2.1. Polyethene (PE)
- 8.1.2.2. Bi-orientated Polypropylene (BOPP)
- 8.1.2.3. Cast Polypropylene (CPP)
- 8.1.2.4. Other Flexible Plastic Packaging Materials
- 8.1.1. Rigid
- 8.2. Market Analysis, Insights and Forecast - by Product
- 8.2.1. Bottles and Jars
- 8.2.2. Tubs, Cups, Bowls, and Trays
- 8.2.3. Intermediate Bulk Containers
- 8.2.4. Pouches
- 8.2.5. Other Products
- 8.3. Market Analysis, Insights and Forecast - by Geography
- 8.3.1. United Arab Emirates
- 8.3.2. Saudi Arabia
- 8.3.3. Egypt
- 8.3.4. South Africa
- 8.3.5. Rest of Middle East and Africa
- 8.1. Market Analysis, Insights and Forecast - by Packaging Type
- 9. Egypt MEA Plastic Packaging Industry Analysis, Insights and Forecast, 2020-2032
- 9.1. Market Analysis, Insights and Forecast - by Packaging Type
- 9.1.1. Rigid
- 9.1.1.1. By Material
- 9.1.1.1.1. Polyethylene (PE)
- 9.1.1.1.2. Polyethylene Terephthalate (PET)
- 9.1.1.1.3. Polypropylene (PP)
- 9.1.1.1.4. Polystyrene (PS) and Expanded Polystyrene (EPS)
- 9.1.1.1.5. Polyvinyl Chloride (PVC)
- 9.1.1.2. By End-user Industry
- 9.1.1.2.1. Food
- 9.1.1.2.2. Beverage
- 9.1.1.2.3. Healthcare and Pharmaceutical
- 9.1.1.2.4. Cosmetics and Personal Care
- 9.1.1.2.5. Other End-user Industries
- 9.1.1.1. By Material
- 9.1.2. Flexible
- 9.1.2.1. Polyethene (PE)
- 9.1.2.2. Bi-orientated Polypropylene (BOPP)
- 9.1.2.3. Cast Polypropylene (CPP)
- 9.1.2.4. Other Flexible Plastic Packaging Materials
- 9.1.1. Rigid
- 9.2. Market Analysis, Insights and Forecast - by Product
- 9.2.1. Bottles and Jars
- 9.2.2. Tubs, Cups, Bowls, and Trays
- 9.2.3. Intermediate Bulk Containers
- 9.2.4. Pouches
- 9.2.5. Other Products
- 9.3. Market Analysis, Insights and Forecast - by Geography
- 9.3.1. United Arab Emirates
- 9.3.2. Saudi Arabia
- 9.3.3. Egypt
- 9.3.4. South Africa
- 9.3.5. Rest of Middle East and Africa
- 9.1. Market Analysis, Insights and Forecast - by Packaging Type
- 10. South Africa MEA Plastic Packaging Industry Analysis, Insights and Forecast, 2020-2032
- 10.1. Market Analysis, Insights and Forecast - by Packaging Type
- 10.1.1. Rigid
- 10.1.1.1. By Material
- 10.1.1.1.1. Polyethylene (PE)
- 10.1.1.1.2. Polyethylene Terephthalate (PET)
- 10.1.1.1.3. Polypropylene (PP)
- 10.1.1.1.4. Polystyrene (PS) and Expanded Polystyrene (EPS)
- 10.1.1.1.5. Polyvinyl Chloride (PVC)
- 10.1.1.2. By End-user Industry
- 10.1.1.2.1. Food
- 10.1.1.2.2. Beverage
- 10.1.1.2.3. Healthcare and Pharmaceutical
- 10.1.1.2.4. Cosmetics and Personal Care
- 10.1.1.2.5. Other End-user Industries
- 10.1.1.1. By Material
- 10.1.2. Flexible
- 10.1.2.1. Polyethene (PE)
- 10.1.2.2. Bi-orientated Polypropylene (BOPP)
- 10.1.2.3. Cast Polypropylene (CPP)
- 10.1.2.4. Other Flexible Plastic Packaging Materials
- 10.1.1. Rigid
- 10.2. Market Analysis, Insights and Forecast - by Product
- 10.2.1. Bottles and Jars
- 10.2.2. Tubs, Cups, Bowls, and Trays
- 10.2.3. Intermediate Bulk Containers
- 10.2.4. Pouches
- 10.2.5. Other Products
- 10.3. Market Analysis, Insights and Forecast - by Geography
- 10.3.1. United Arab Emirates
- 10.3.2. Saudi Arabia
- 10.3.3. Egypt
- 10.3.4. South Africa
- 10.3.5. Rest of Middle East and Africa
- 10.1. Market Analysis, Insights and Forecast - by Packaging Type
- 11. Rest of Middle East and Africa MEA Plastic Packaging Industry Analysis, Insights and Forecast, 2020-2032
- 11.1. Market Analysis, Insights and Forecast - by Packaging Type
- 11.1.1. Rigid
- 11.1.1.1. By Material
- 11.1.1.1.1. Polyethylene (PE)
- 11.1.1.1.2. Polyethylene Terephthalate (PET)
- 11.1.1.1.3. Polypropylene (PP)
- 11.1.1.1.4. Polystyrene (PS) and Expanded Polystyrene (EPS)
- 11.1.1.1.5. Polyvinyl Chloride (PVC)
- 11.1.1.2. By End-user Industry
- 11.1.1.2.1. Food
- 11.1.1.2.2. Beverage
- 11.1.1.2.3. Healthcare and Pharmaceutical
- 11.1.1.2.4. Cosmetics and Personal Care
- 11.1.1.2.5. Other End-user Industries
- 11.1.1.1. By Material
- 11.1.2. Flexible
- 11.1.2.1. Polyethene (PE)
- 11.1.2.2. Bi-orientated Polypropylene (BOPP)
- 11.1.2.3. Cast Polypropylene (CPP)
- 11.1.2.4. Other Flexible Plastic Packaging Materials
- 11.1.1. Rigid
- 11.2. Market Analysis, Insights and Forecast - by Product
- 11.2.1. Bottles and Jars
- 11.2.2. Tubs, Cups, Bowls, and Trays
- 11.2.3. Intermediate Bulk Containers
- 11.2.4. Pouches
- 11.2.5. Other Products
- 11.3. Market Analysis, Insights and Forecast - by Geography
- 11.3.1. United Arab Emirates
- 11.3.2. Saudi Arabia
- 11.3.3. Egypt
- 11.3.4. South Africa
- 11.3.5. Rest of Middle East and Africa
- 11.1. Market Analysis, Insights and Forecast - by Packaging Type
- 12. Competitive Analysis
- 12.1. Company Profiles
- 12.1.1 KANR For Plastic Industries
- 12.1.1.1. Company Overview
- 12.1.1.2. Products
- 12.1.1.3. Company Financials
- 12.1.1.4. SWOT Analysis
- 12.1.2 Al Nawakheth Factory Company
- 12.1.2.1. Company Overview
- 12.1.2.2. Products
- 12.1.2.3. Company Financials
- 12.1.2.4. SWOT Analysis
- 12.1.3 Arabian Plastics Industrial Company Limited (APICO)
- 12.1.3.1. Company Overview
- 12.1.3.2. Products
- 12.1.3.3. Company Financials
- 12.1.3.4. SWOT Analysis
- 12.1.4 Napco Group (Napco National)
- 12.1.4.1. Company Overview
- 12.1.4.2. Products
- 12.1.4.3. Company Financials
- 12.1.4.4. SWOT Analysis
- 12.1.5 SABIC - Saudi Basic Industries Corporation
- 12.1.5.1. Company Overview
- 12.1.5.2. Products
- 12.1.5.3. Company Financials
- 12.1.5.4. SWOT Analysis
- 12.1.6 Zamil Plastic Industries Co
- 12.1.6.1. Company Overview
- 12.1.6.2. Products
- 12.1.6.3. Company Financials
- 12.1.6.4. SWOT Analysis
- 12.1.7 Sealed Air Corporation (Sealed Air Saudi Arabia)*List Not Exhaustive
- 12.1.7.1. Company Overview
- 12.1.7.2. Products
- 12.1.7.3. Company Financials
- 12.1.7.4. SWOT Analysis
- 12.1.8 Takween Advanced Industries
- 12.1.8.1. Company Overview
- 12.1.8.2. Products
- 12.1.8.3. Company Financials
- 12.1.8.4. SWOT Analysis
- 12.1.9 AL-Ghandoura Co Manuf Plastic GhanPlast)
- 12.1.9.1. Company Overview
- 12.1.9.2. Products
- 12.1.9.3. Company Financials
- 12.1.9.4. SWOT Analysis
- 12.1.10 Saudi Arabian Packaging Industry WLL (SAPIN)
- 12.1.10.1. Company Overview
- 12.1.10.2. Products
- 12.1.10.3. Company Financials
- 12.1.10.4. SWOT Analysis
- 12.1.11 Saudi Plastic Factory Company
- 12.1.11.1. Company Overview
- 12.1.11.2. Products
- 12.1.11.3. Company Financials
- 12.1.11.4. SWOT Analysis
- 12.1.12 Arnon Plastic Industry Co Ltd
- 12.1.12.1. Company Overview
- 12.1.12.2. Products
- 12.1.12.3. Company Financials
- 12.1.12.4. SWOT Analysis
- 12.1.13 Plastico SPS
- 12.1.13.1. Company Overview
- 12.1.13.2. Products
- 12.1.13.3. Company Financials
- 12.1.13.4. SWOT Analysis
- 12.1.14 Coloredsun
- 12.1.14.1. Company Overview
- 12.1.14.2. Products
- 12.1.14.3. Company Financials
- 12.1.14.4. SWOT Analysis
- 12.1.15 National Plastic Factory LLC
- 12.1.15.1. Company Overview
- 12.1.15.2. Products
- 12.1.15.3. Company Financials
- 12.1.15.4. SWOT Analysis
- 12.1.16 Packaging Products Company (PPC)
- 12.1.16.1. Company Overview
- 12.1.16.2. Products
- 12.1.16.3. Company Financials
- 12.1.16.4. SWOT Analysis
- 12.1.1 KANR For Plastic Industries
- 12.2. Market Entropy
- 12.2.1 Company's Key Areas Served
- 12.2.2 Recent Developments
- 12.3. Company Market Share Analysis 2025
- 12.3.1 Top 5 Companies Market Share Analysis
- 12.3.2 Top 3 Companies Market Share Analysis
- 12.4. List of Potential Customers
- 13. Research Methodology
List of Figures
- Figure 1: Global MEA Plastic Packaging Industry Revenue Breakdown (million, %) by Region 2025 & 2033
- Figure 2: United Arab Emirates MEA Plastic Packaging Industry Revenue (million), by Packaging Type 2025 & 2033
- Figure 3: United Arab Emirates MEA Plastic Packaging Industry Revenue Share (%), by Packaging Type 2025 & 2033
- Figure 4: United Arab Emirates MEA Plastic Packaging Industry Revenue (million), by Product 2025 & 2033
- Figure 5: United Arab Emirates MEA Plastic Packaging Industry Revenue Share (%), by Product 2025 & 2033
- Figure 6: United Arab Emirates MEA Plastic Packaging Industry Revenue (million), by Geography 2025 & 2033
- Figure 7: United Arab Emirates MEA Plastic Packaging Industry Revenue Share (%), by Geography 2025 & 2033
- Figure 8: United Arab Emirates MEA Plastic Packaging Industry Revenue (million), by Country 2025 & 2033
- Figure 9: United Arab Emirates MEA Plastic Packaging Industry Revenue Share (%), by Country 2025 & 2033
- Figure 10: Saudi Arabia MEA Plastic Packaging Industry Revenue (million), by Packaging Type 2025 & 2033
- Figure 11: Saudi Arabia MEA Plastic Packaging Industry Revenue Share (%), by Packaging Type 2025 & 2033
- Figure 12: Saudi Arabia MEA Plastic Packaging Industry Revenue (million), by Product 2025 & 2033
- Figure 13: Saudi Arabia MEA Plastic Packaging Industry Revenue Share (%), by Product 2025 & 2033
- Figure 14: Saudi Arabia MEA Plastic Packaging Industry Revenue (million), by Geography 2025 & 2033
- Figure 15: Saudi Arabia MEA Plastic Packaging Industry Revenue Share (%), by Geography 2025 & 2033
- Figure 16: Saudi Arabia MEA Plastic Packaging Industry Revenue (million), by Country 2025 & 2033
- Figure 17: Saudi Arabia MEA Plastic Packaging Industry Revenue Share (%), by Country 2025 & 2033
- Figure 18: Egypt MEA Plastic Packaging Industry Revenue (million), by Packaging Type 2025 & 2033
- Figure 19: Egypt MEA Plastic Packaging Industry Revenue Share (%), by Packaging Type 2025 & 2033
- Figure 20: Egypt MEA Plastic Packaging Industry Revenue (million), by Product 2025 & 2033
- Figure 21: Egypt MEA Plastic Packaging Industry Revenue Share (%), by Product 2025 & 2033
- Figure 22: Egypt MEA Plastic Packaging Industry Revenue (million), by Geography 2025 & 2033
- Figure 23: Egypt MEA Plastic Packaging Industry Revenue Share (%), by Geography 2025 & 2033
- Figure 24: Egypt MEA Plastic Packaging Industry Revenue (million), by Country 2025 & 2033
- Figure 25: Egypt MEA Plastic Packaging Industry Revenue Share (%), by Country 2025 & 2033
- Figure 26: South Africa MEA Plastic Packaging Industry Revenue (million), by Packaging Type 2025 & 2033
- Figure 27: South Africa MEA Plastic Packaging Industry Revenue Share (%), by Packaging Type 2025 & 2033
- Figure 28: South Africa MEA Plastic Packaging Industry Revenue (million), by Product 2025 & 2033
- Figure 29: South Africa MEA Plastic Packaging Industry Revenue Share (%), by Product 2025 & 2033
- Figure 30: South Africa MEA Plastic Packaging Industry Revenue (million), by Geography 2025 & 2033
- Figure 31: South Africa MEA Plastic Packaging Industry Revenue Share (%), by Geography 2025 & 2033
- Figure 32: South Africa MEA Plastic Packaging Industry Revenue (million), by Country 2025 & 2033
- Figure 33: South Africa MEA Plastic Packaging Industry Revenue Share (%), by Country 2025 & 2033
- Figure 34: Rest of Middle East and Africa MEA Plastic Packaging Industry Revenue (million), by Packaging Type 2025 & 2033
- Figure 35: Rest of Middle East and Africa MEA Plastic Packaging Industry Revenue Share (%), by Packaging Type 2025 & 2033
- Figure 36: Rest of Middle East and Africa MEA Plastic Packaging Industry Revenue (million), by Product 2025 & 2033
- Figure 37: Rest of Middle East and Africa MEA Plastic Packaging Industry Revenue Share (%), by Product 2025 & 2033
- Figure 38: Rest of Middle East and Africa MEA Plastic Packaging Industry Revenue (million), by Geography 2025 & 2033
- Figure 39: Rest of Middle East and Africa MEA Plastic Packaging Industry Revenue Share (%), by Geography 2025 & 2033
- Figure 40: Rest of Middle East and Africa MEA Plastic Packaging Industry Revenue (million), by Country 2025 & 2033
- Figure 41: Rest of Middle East and Africa MEA Plastic Packaging Industry Revenue Share (%), by Country 2025 & 2033
List of Tables
- Table 1: Global MEA Plastic Packaging Industry Revenue million Forecast, by Packaging Type 2020 & 2033
- Table 2: Global MEA Plastic Packaging Industry Revenue million Forecast, by Product 2020 & 2033
- Table 3: Global MEA Plastic Packaging Industry Revenue million Forecast, by Geography 2020 & 2033
- Table 4: Global MEA Plastic Packaging Industry Revenue million Forecast, by Region 2020 & 2033
- Table 5: Global MEA Plastic Packaging Industry Revenue million Forecast, by Packaging Type 2020 & 2033
- Table 6: Global MEA Plastic Packaging Industry Revenue million Forecast, by Product 2020 & 2033
- Table 7: Global MEA Plastic Packaging Industry Revenue million Forecast, by Geography 2020 & 2033
- Table 8: Global MEA Plastic Packaging Industry Revenue million Forecast, by Country 2020 & 2033
- Table 9: Global MEA Plastic Packaging Industry Revenue million Forecast, by Packaging Type 2020 & 2033
- Table 10: Global MEA Plastic Packaging Industry Revenue million Forecast, by Product 2020 & 2033
- Table 11: Global MEA Plastic Packaging Industry Revenue million Forecast, by Geography 2020 & 2033
- Table 12: Global MEA Plastic Packaging Industry Revenue million Forecast, by Country 2020 & 2033
- Table 13: Global MEA Plastic Packaging Industry Revenue million Forecast, by Packaging Type 2020 & 2033
- Table 14: Global MEA Plastic Packaging Industry Revenue million Forecast, by Product 2020 & 2033
- Table 15: Global MEA Plastic Packaging Industry Revenue million Forecast, by Geography 2020 & 2033
- Table 16: Global MEA Plastic Packaging Industry Revenue million Forecast, by Country 2020 & 2033
- Table 17: Global MEA Plastic Packaging Industry Revenue million Forecast, by Packaging Type 2020 & 2033
- Table 18: Global MEA Plastic Packaging Industry Revenue million Forecast, by Product 2020 & 2033
- Table 19: Global MEA Plastic Packaging Industry Revenue million Forecast, by Geography 2020 & 2033
- Table 20: Global MEA Plastic Packaging Industry Revenue million Forecast, by Country 2020 & 2033
- Table 21: Global MEA Plastic Packaging Industry Revenue million Forecast, by Packaging Type 2020 & 2033
- Table 22: Global MEA Plastic Packaging Industry Revenue million Forecast, by Product 2020 & 2033
- Table 23: Global MEA Plastic Packaging Industry Revenue million Forecast, by Geography 2020 & 2033
- Table 24: Global MEA Plastic Packaging Industry Revenue million Forecast, by Country 2020 & 2033
Frequently Asked Questions
1. What is the projected Compound Annual Growth Rate (CAGR) of the MEA Plastic Packaging Industry?
The projected CAGR is approximately 3.76%.
2. Which companies are prominent players in the MEA Plastic Packaging Industry?
Key companies in the market include KANR For Plastic Industries, Al Nawakheth Factory Company, Arabian Plastics Industrial Company Limited (APICO), Napco Group (Napco National), SABIC - Saudi Basic Industries Corporation, Zamil Plastic Industries Co, Sealed Air Corporation (Sealed Air Saudi Arabia)*List Not Exhaustive, Takween Advanced Industries, AL-Ghandoura Co Manuf Plastic GhanPlast), Saudi Arabian Packaging Industry WLL (SAPIN), Saudi Plastic Factory Company, Arnon Plastic Industry Co Ltd, Plastico SPS, Coloredsun, National Plastic Factory LLC, Packaging Products Company (PPC).
3. What are the main segments of the MEA Plastic Packaging Industry?
The market segments include Packaging Type, Product, Geography.
4. Can you provide details about the market size?
The market size is estimated to be USD 4.65 million as of 2022.
5. What are some drivers contributing to market growth?
Demand for Oxo-Degradable Plastics.
6. What are the notable trends driving market growth?
Flexible Packaging is Expected to Witness Significant Growth.
7. Are there any restraints impacting market growth?
Environmental Concerns Over Recycling and Safe Disposal and Price Volatility of Raw Materials.
8. Can you provide examples of recent developments in the market?
June 2022: Sabic, a global leader in the chemical industry, joined forces with Heinz, Tesco, and Berry in an innovative recycling trial in the United Kingdom designed to close the loop on soft plastic food packaging. Flexible plastic packaging collected from Tesco stores has been used to produce certified circular polypropylene (PP) from Sabic's Trucircle portfolio for microwavable Heinz Beanz Snap Pots, made from 39% recycled soft plastic. Consumers are encouraged to return the soft plastic packaging to collection points at Tesco stores.
9. What pricing options are available for accessing the report?
Pricing options include single-user, multi-user, and enterprise licenses priced at USD 4750, USD 5250, and USD 8750 respectively.
10. Is the market size provided in terms of value or volume?
The market size is provided in terms of value, measured in million.
11. Are there any specific market keywords associated with the report?
Yes, the market keyword associated with the report is "MEA Plastic Packaging Industry," which aids in identifying and referencing the specific market segment covered.
12. How do I determine which pricing option suits my needs best?
The pricing options vary based on user requirements and access needs. Individual users may opt for single-user licenses, while businesses requiring broader access may choose multi-user or enterprise licenses for cost-effective access to the report.
13. Are there any additional resources or data provided in the MEA Plastic Packaging Industry report?
While the report offers comprehensive insights, it's advisable to review the specific contents or supplementary materials provided to ascertain if additional resources or data are available.
14. How can I stay updated on further developments or reports in the MEA Plastic Packaging Industry?
To stay informed about further developments, trends, and reports in the MEA Plastic Packaging Industry, consider subscribing to industry newsletters, following relevant companies and organizations, or regularly checking reputable industry news sources and publications.
Methodology
Step 1 - Identification of Relevant Samples Size from Population Database


Step 2 - Approaches for Defining Global Market Size (Value, Volume* & Price*)

Note*: In applicable scenarios
Step 3 - Data Sources
Primary Research
- Web Analytics
- Survey Reports
- Research Institute
- Latest Research Reports
- Opinion Leaders
Secondary Research
- Annual Reports
- White Paper
- Latest Press Release
- Industry Association
- Paid Database
- Investor Presentations

Step 4 - Data Triangulation
Involves using different sources of information in order to increase the validity of a study
These sources are likely to be stakeholders in a program - participants, other researchers, program staff, other community members, and so on.
Then we put all data in single framework & apply various statistical tools to find out the dynamic on the market.
During the analysis stage, feedback from the stakeholder groups would be compared to determine areas of agreement as well as areas of divergence